


 |
市场调查报告书
商品编码
1693535
亚太地区控制释放肥料:市场占有率分析、产业趋势与统计、成长预测(2025-2030 年)Asia-Pacific Controlled Release Fertilizer - Market Share Analysis, Industry Trends & Statistics, Growth Forecasts (2025 - 2030) |
||||||
※ 本网页内容可能与最新版本有所差异。详细情况请与我们联繫。
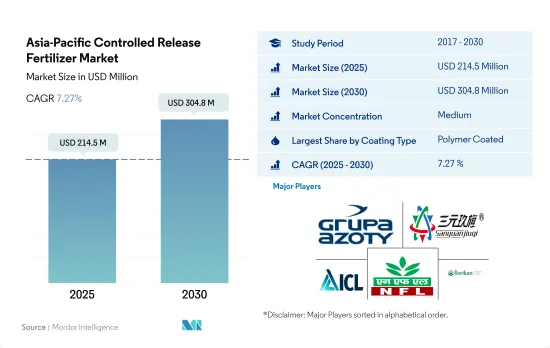
亚太地区控制释放肥料市场规模预计在 2025 年为 2.145 亿美元,预计到 2030 年将达到 3.048 亿美元,预测期内(2025-2030 年)的复合年增长率为 7.27%。
中国和印度主导亚太控制释放肥料市场
- 在研究期间,聚合物包膜控制释放肥料市场经历了显着的成长。到 2022 年,这些肥料将占据整个亚太地区控制释放肥料 (CRF) 市场的 76.0% 份额。该地区对生态学安全肥料的日益重视是新型控制释放肥料需求激增的主要驱动力。
- 玉米、大豆、油菜籽等谷物和油籽种植面积的扩大正在推动多硫包衣尿素市场的发展。此外,土壤中尿素的过量累积导致了尿素的枯竭,从而刺激了对多硫包膜控制释放肥料的需求。此外,由于对高效环保产品的需求不断增加等因素,多硫涂层 CRF 市场可望成长。预计该地区 2023 年至 2030 年的复合年增长率为 6.8%。
- 2022年,中国在其他类型的包膜控制释放肥料市场占据主导地位,占控释肥市场42.3%的价值份额。在这些肥料中,约69.6%施用于田间作物,其次是园艺作物。
- 使用化学肥料会产生有害影响,包括改变土壤 pH 值、抑制微生物生长以及过度施氮释放温室气体。这些环境问题,加上营养物质流失的增加,刺激了对替代肥料的需求。因此,预计 2023 年至 2030 年市场以金额为准将达到 6.2%。
中国主导亚太控制释放肥市场
- 亚太地区约70.0%的人口直接依赖农业作为主要生计。然而,该地区的农业部门面临着许多生产力低下的许多挑战。
- 中国在亚太控制释放肥市场占据主导地位,2022 年占 43.8% 的市占率。聚合物包膜性肥料在控制释放肥料市场中占有最大份额,其次是聚合物硫包膜性肥料。 2017 年聚合物包膜性肥料市场价值为 1,790 万美元,预计到 2030 年将达到 5,800 万美元,这主要是因为采用 CRF 减少了肥料消费量,从而提高了 NUE。
- 印度将成为该地区第二大控制释放肥料市场,到2022年将占16.6%。控制释放尿素是印度最常使用的控释肥料。氮损失是稻农面临的主要问题之一,水稻的氮利用效率通常较低。这是由于氮透过挥发、淋溶和反硝化作用大量损失所致。提高氮利用效率的一种方法是使用控制释放尿素。控制释放尿素在减少氮损失、促进植物生长和增加氮浓度方面通常优于颗粒尿素肥料。
- 2017年,中国国际植物营养研究所在湖北省进行控制释放尿素肥料应用计画。事实证明,持续使用 CRU 肥料有助于提高水稻和茄子等主要作物的产量和盈利。因此,预计未来该市场将会成长。
亚太控制释放肥料市场趋势
主要作物种植面积的大幅扩大预计将推动市场成长。
- 该地区以田间作物种植为主,占耕地总面积的95%以上。水稻、小麦和玉米是该地区的主要田间作物,到2022年,这三种作物的种植面积总合该地区作物总种植面积的38%。预计种植面积的增加将增加该国对化肥的需求。
- 亚太地区包括中国、印度、巴基斯坦和澳大利亚,是世界上最大的小麦生产区之一。中国和印度分别是世界上最大的小麦生产国和消费国。小麦需求和消费量的增加是由于小麦是该地区的主要主食之一,而且在研究期间小麦种植面积增加了一个百分点。 2022年,中国小麦产量为1.38亿吨,成为全球最大的小麦生产国,印度小麦产量为1.03亿吨。
- 水稻是该地区最大的田间作物。仅其种植面积就占2022年农业用地总面积的约16.44%。水稻是亚洲和太平洋大部分地区的主食。预计2022年中国米产量为1.47亿吨,印度米产量为1.24亿吨。预计印度将消费1.09亿吨,出口1,950万吨,为全球最大出口国。
- 国内外对田间作物的需求迅速增长,促进了田间作物面积的扩大。预计耕地面积的大幅增加将对2023年至2030年亚太地区的CRF市场产生直接正面的影响。
全球农业用地氧化亚氮排放量约有28%来自中国农地。
- 对于田间作物,2022年全国主要养分(氮、钾和磷)的平均施用率为129.1公斤/公顷。氮为58.5%,钾为25.3%,磷为16.1%。大多数主要营养物质都是透过土壤施用方法施用的。 2022 年,传统土壤基主要大量营养素肥料将占主要大量营养素肥料市场总量的 69.2%。
- 亚洲主要的营养元素投入量很高,尤其是氮肥和钾肥。然而,亚太地区作为世界上土地面积和人口最多的地区,也是世界上农药生产量和消费量最大的地区。全球约28%的氧化亚氮排放排放中国的农业用地。
- 在田间作物中,小麦平均一次养分施用量为214.9公斤/公顷,是2022种田间作物中最高的。在主要养分中,氮肥占有首要地位,平均施用量为448.5公斤/公顷。植物代谢需要大量的氮。它也是叶绿素和氨基酸的主要成分。
- 地表水和地下水受到氮和磷的污染,是由于没有向农民提供有关施肥量和大规模作物的建议不足所造成的。然而,趋势正在转向更有效率的肥料。
亚太控制释放肥料产业概况
亚太地区控制释放肥市场适度整合,前五大公司占61.40%的市占率。市场的主要企业是:Grupa Azoty SA(Compo Expert)、河北三元九七化肥、ICL Group Ltd、National Fertilizers Ltd 和 New Mountain Capital(Florikan)(按字母顺序排列)
其他福利
- Excel 格式的市场预测 (ME) 表
- 3个月的分析师支持
目录
第一章执行摘要和主要发现
第二章 报告要约
第三章 引言
- 研究假设和市场定义
- 研究范围
- 调查方法
第四章 产业主要趋势
- 主要作物种植面积
- 田间作物
- 园艺作物
- 平均养分施用量
- 主要营养素
- 田间作物
- 园艺作物
- 主要营养素
- 法律规范
- 价值炼和通路分析
第五章市场区隔
- 涂层类型
- 聚合物涂层
- 聚合物硫涂层
- 其他的
- 作物类型
- 田间作物
- 园艺作物
- 草坪和观赏植物
- 原产地
- 澳洲
- 孟加拉
- 中国
- 印度
- 印尼
- 日本
- 巴基斯坦
- 菲律宾
- 泰国
- 越南
- 其他亚太地区
第六章竞争格局
- 关键策略趋势
- 市场占有率分析
- 商业状况
- 公司简介
- Grupa Azoty SA(Compo Expert)
- Haifa Group
- Hebei Sanyuanjiuqi Fertilizer Co., Ltd.
- Hebei Woze Wufeng Biological Technology Co., Ltd
- ICL Group Ltd
- National Fertilizers Ltd
- New Mountain Capital(Florikan)
- Zhongchuang xingyuan chemical technology co.ltd
第七章:CEO面临的关键策略问题
第 8 章 附录
- 世界概况
- 概述
- 五力分析框架
- 全球价值链分析
- 市场动态(DRO)
- 资讯来源及延伸阅读
- 图片列表
- 关键见解
- 资料包
- 词彙表
The Asia-Pacific Controlled Release Fertilizer Market size is estimated at 214.5 million USD in 2025, and is expected to reach 304.8 million USD by 2030, growing at a CAGR of 7.27% during the forecast period (2025-2030).
China and India dominate the Asia-Pacific controlled-release fertilizers market
- During the study period, the market for polymer-coated controlled-release fertilizers experienced notable growth. By 2022, these fertilizers held a significant share of 76.0% in the overall controlled-release fertilizer (CRF) market in Asia-Pacific. The region's increasing emphasis on ecologically safe fertilizers is a key driver behind the surge in demand for new controlled-release options.
- The cultivation expansion of cereal and oilseeds, including corn, soybeans, and rapeseed, is propelling the market for poly-sulfur-coated urea. Moreover, excessive urea accumulation in soils has led to depletion, fueling the demand for poly-sulfur-coated controlled-release fertilizers. In addition, the market for poly-sulfur-coated CRFs is poised for growth, driven by factors like the rising demand for highly efficient and eco-friendly products. It is projected to achieve a value CAGR of 6.8% in the region between 2023-2030.
- In 2022, China dominated the market for other types of coated controlled-release fertilizers, commanding a 42.3% value share in the CRF market. Of these fertilizers, approximately 69.6% were utilized in field crops, with horticultural crops following suit.
- The use of chemical fertilizers has detrimental effects, including soil pH alteration, inhibition of microbial growth, and the release of greenhouse gases from excessive nitrogen application. These environmental concerns, coupled with escalating nutrient losses, are fueling the demand for alternative fertilizers. As a result, the market is projected to witness a CAGR of 6.2% in value during the period spanning from 2023 to 2030.
China dominates the APAC controlled-release fertilizer market
- Approximately 70.0% of the population in the Asia-Pacific region depends directly on agriculture as the primary source of their livelihood. However, the region's agriculture sector is facing many issues in terms of low productivity.
- China dominates the APAC controlled-release fertilizer market, accounting for 43.8% of the market value share in 2022. Polymer-coated fertilizers accounted for the largest share of the controlled-release fertilizer market, followed by polymer sulfur-coated fertilizers. The polymer-coated fertilizer segment was valued at USD 17.9 million in 2017, and it is anticipated to reach USD 58.0 million by 2030, mainly due to increasing NUE by reducing fertilizer consumption by adopting CRFs.
- India is the region's second-largest market for controlled-release fertilizers, accounting for 16.6% in 2022. Controlled-release urea is the most commonly used form of CRF in India. Nitrogen loss is one of the main problems faced by rice farmers, and the efficiency of nitrogen utilization in rice is often inadequate. This is due to the large loss of nitrogen due to volatilization, leaching, and denitrification. One way to improve nitrogen efficiency is to use controlled-release urea. Controlled-release urea generally outperforms granular urea fertilizers in reducing nitrogen loss, stimulating plant growth, and increasing nitrogen concentration.
- In 2017, the International Plant Nutrition Institute of China conducted a controlled-release urea fertilizer Application Program in Hubei province. It was proven that the consistent use of CRU fertilizer helps improve the yield and profitability of major crops, such as rice and eggplant. Hence, the market is expected to grow in the future.
Asia-Pacific Controlled Release Fertilizer Market Trends
The significant expansion of cultivation of major growing crops is anticipated to boost the growth of the market
- Field crop cultivation dominates the region, accounting for more than 95% of the total crop area. Rice, wheat, and corn are the major field crops produced in the region, together accounting for about 38% of the total crop area in 2022. The rising area under cultivation is expected to increase the demand for fertilizer usage in the country.
- The Asia-Pacific region, which includes China, India, Pakistan, and Australia, is among the world's largest wheat producers. China and India are also the world's largest wheat producers and consumers. The increase in demand and consumption of wheat is due to wheat being one of the major staple foods of this region, and the area increased by a percentage point during the study period. In 2022, China accounted for the production of 138 million metric tons of wheat, making it the largest wheat producer in the world, and India had a wheat production of 103 million metric tons.
- Rice is the largest cultivated field crop in the region. Its cultivation alone accounted for about 16.44% of the total agricultural land in 2022. Rice is the staple food of Asia and most parts of the Pacific region. China was projected to produce 147 million tons of rice, and India was expected to harvest 124 million tons of rice in 2022. India was expected to consume 109 million tons while exporting a world-leading 19.5 million tons.
- The surge in both domestic and international demand for field crops has prompted an expansion in the cultivation area dedicated to these crops. This significant increase in cultivated land is expected to have a direct and positive impact on the Asia-Pacific CRF market from 2023 to 2030.
About 28% of nitrous oxide emissions from croplands in the world are from China's agricultural lands
- In field crops, the average primary nutrient (nitrogen, potassium, and phosphorus) application rate in the country was 129.1 kg/ha in 2022. Nitrogen accounted for 58.5%, potassium for 25.3%, and phosphorus for 16.1% of the average primary nutrient application for field crops. Most primary nutrients were applied through the soil application method. Conventional soil-based primary macronutrient fertilizers accounted for 69.2% of the total primary macronutrient fertilizer market in 2022.
- In Asia, the primary nutrient input is high, particularly for nitrogenous and potassic fertilizers, because most soils in the region are deficient in nitrogen and potassic nutrients. However, Asia-Pacific, which is the largest region in the world in terms of land area and population, is also the largest producer and consumer of agrochemicals among all the regions worldwide. About 28% of nitrous oxide emissions from croplands worldwide are from China's agricultural lands.
- In field crops, wheat had an average primary nutrient application rate of 214.9 kg/ha, the highest among field crops in 2022. In primary nutrients, nitrogen occupies the first place with an average application rate of 448.5 kg/ha, as nitrogen is required in large amounts for plant metabolism. It is also a major component of chlorophyll and amino acids.
- The contamination of surface and groundwater with nitrogen and phosphorus has been considered a result of inadequate advice given to farmers regarding fertilizer application rates and a possible larger crop. However, the trend is shifting toward highly efficient fertilizers.
Asia-Pacific Controlled Release Fertilizer Industry Overview
The Asia-Pacific Controlled Release Fertilizer Market is moderately consolidated, with the top five companies occupying 61.40%. The major players in this market are Grupa Azoty S.A. (Compo Expert), Hebei Sanyuanjiuqi Fertilizer Co., Ltd., ICL Group Ltd, National Fertilizers Ltd and New Mountain Capital (Florikan) (sorted alphabetically).
Additional Benefits:
- The market estimate (ME) sheet in Excel format
- 3 months of analyst support
TABLE OF CONTENTS
1 EXECUTIVE SUMMARY & KEY FINDINGS
2 REPORT OFFERS
3 INTRODUCTION
- 3.1 Study Assumptions & Market Definition
- 3.2 Scope of the Study
- 3.3 Research Methodology
4 KEY INDUSTRY TRENDS
- 4.1 Acreage Of Major Crop Types
- 4.1.1 Field Crops
- 4.1.2 Horticultural Crops
- 4.2 Average Nutrient Application Rates
- 4.2.1 Primary Nutrients
- 4.2.1.1 Field Crops
- 4.2.1.2 Horticultural Crops
- 4.2.1 Primary Nutrients
- 4.3 Regulatory Framework
- 4.4 Value Chain & Distribution Channel Analysis
5 MARKET SEGMENTATION (includes market size in Value in USD and Volume, Forecasts up to 2030 and analysis of growth prospects)
- 5.1 Coating Type
- 5.1.1 Polymer Coated
- 5.1.2 Polymer-Sulfur Coated
- 5.1.3 Others
- 5.2 Crop Type
- 5.2.1 Field Crops
- 5.2.2 Horticultural Crops
- 5.2.3 Turf & Ornamental
- 5.3 Country
- 5.3.1 Australia
- 5.3.2 Bangladesh
- 5.3.3 China
- 5.3.4 India
- 5.3.5 Indonesia
- 5.3.6 Japan
- 5.3.7 Pakistan
- 5.3.8 Philippines
- 5.3.9 Thailand
- 5.3.10 Vietnam
- 5.3.11 Rest of Asia-Pacific
6 COMPETITIVE LANDSCAPE
- 6.1 Key Strategic Moves
- 6.2 Market Share Analysis
- 6.3 Company Landscape
- 6.4 Company Profiles
- 6.4.1 Grupa Azoty S.A. (Compo Expert)
- 6.4.2 Haifa Group
- 6.4.3 Hebei Sanyuanjiuqi Fertilizer Co., Ltd.
- 6.4.4 Hebei Woze Wufeng Biological Technology Co., Ltd
- 6.4.5 ICL Group Ltd
- 6.4.6 National Fertilizers Ltd
- 6.4.7 New Mountain Capital (Florikan)
- 6.4.8 Zhongchuang xingyuan chemical technology co.ltd
7 KEY STRATEGIC QUESTIONS FOR FERTILIZER CEOS
8 APPENDIX
- 8.1 Global Overview
- 8.1.1 Overview
- 8.1.2 Porter's Five Forces Framework
- 8.1.3 Global Value Chain Analysis
- 8.1.4 Market Dynamics (DROs)
- 8.2 Sources & References
- 8.3 List of Tables & Figures
- 8.4 Primary Insights
- 8.5 Data Pack
- 8.6 Glossary of Terms
 控释肥料市场-全球产业规模、份额、趋势、机会和预测,按类型、最终用途、应用方式、地区和竞争格局划分,2020-2030年预测
 全球控释肥料(CRF)市场按类型、功能、产品等级、应用方法、最终用途和地区划分-预测至2030年
 缓释性肥市场按包覆类型、作物类型、释放期、养分类型、应用、最终用途和销售管道划分-2025-2032 年全球预测包衣肥料市场-全球产业规模、份额、趋势、机会和预测(按类型、作物类型、地区和竞争情况划分,2020-2030 年)控制释放液态氮市场按产品类型、包衣类型、形态、释放机制、施用方法、作物类型、最终用户和分销管道划分 - 全球预测 2025-2030
 全球硝化抑制剂及尿素酶抑制剂市场分析及预测(至2032年):依产品类型、营养类型、作物类型、施用方法、通路、最终用户及地区划分
 2025年全球控制释放肥市场报告
 2025-2033年控释肥料市场(按类型、形式、应用和地区)报告
 硝化抑制剂及脲酶抑制剂市场机会、成长动力、产业趋势分析及 2025 - 2034 年预测2032 年控制释放和缓释性肥市场预测:按类型、作物类型、应用类型和地区分類的全球分析