


 |
市场调查报告书
商品编码
1693616
北美电动公车:市场占有率分析、行业趋势和成长预测(2025-2030 年)North America Electric Bus - Market Share Analysis, Industry Trends & Statistics, Growth Forecasts (2025 - 2030) |
||||||
价格
※ 本网页内容可能与最新版本有所差异。详细情况请与我们联繫。
简介目录
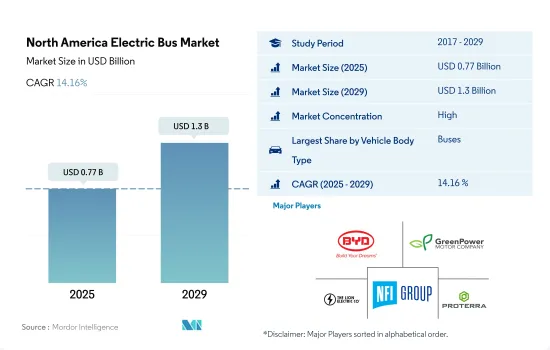
北美电动公车市场规模预计在 2025 年为 7.7 亿美元,预计到 2029 年将达到 13 亿美元,预测期内(2025-2029 年)的复合年增长率为 14.16%。
环境问题和减少碳排放的需要促使政府和交通部门采用更清洁、更永续的交通方式。
- 北美对电动公车的需求正在大幅成长。美国是电动公车销量最高的国家之一,其次是加拿大和墨西哥。人口成长、交通量增加以及公共运输使用优先顺序的改变等因素促进了该地区电动公车的成长。
- 在新冠疫情期间,电动公车市场遭遇挫折,导致交通运输业陷入停滞。然而,随着该地区摆脱疫情,公共运输需求显着增加,这对电动公车市场产生了积极影响。因此,2022 年北美电动公车销量与 2021 年相比有所增加。
- 到2027年,北美电动公车市场规模预计将超过8.5亿美元。美国和加拿大政府都在製定计划,在全部区域建立强大的充电基础设施。 2021 年 6 月,美国运输部下属的联邦运输管理局 (FTA) 拨款约 1.82 亿美元。预计这些资金将惠及46个州的约49个电动公车计划。透过 Low-No 计划,FTA 旨在鼓励采用环保技术和燃料,并帮助公车采购电动和氢动力公车。这些倡议将进一步推动北美电动公车市场的成长。
北美电动巴士市场趋势
由于政府支持和对环境问题的日益关注,北美对电动车的需求不断增加
- 近年来,俄罗斯共产党经历了显着的起伏。从 2017 年的 2.082 亿美元稳步上升至 2019 年的高峰。然而,由于新冠疫情带来的经济挑战,2020 年这一数字下降至 1.939 亿美元。值得注意的是,该市场预计将在 2022 年强劲復苏,达到 2.698 亿美元。復苏凸显了俄罗斯汽车产业的韧性以及奖励策略的潜在影响。
- 政府的激励和补贴对客户(尤其是物流和电子商务公司)采用电动商用车具有强大的吸引力。其中一个例子是加拿大和北美,政府宣布将于 2022 年 4 月为轻型和中型电动车提供 5,000 美元的联邦退税。预计这些努力将推动2024年至2030年间北美对电动商用车的需求大幅成长。
- 电动车部署计划、有吸引力的税收优惠和外国投资津贴等政府措施将推动北美国家的电动车市场发展。引人注目的是,2022 年 3 月,福斯承诺斥资 70 亿美元在北美建立电动车製造工厂。至2030年,福斯汽车计画为美国、墨西哥和加拿大的客户推出25款新型电动车型。因此,预计 2024 年至 2030 年间北美对电动车的需求将显着成长。
北美电动巴士产业概况
北美电动公车市场格局较为集中,前五大公司占了81.84%的市场。该市场的主要企业包括比亚迪汽车、GreenPower Motor Company Inc.、Lion Electric Company、NFI Group Inc.、Proterra INC. 等。
其他福利
- Excel 格式的市场预测 (ME) 表
- 3个月的分析师支持
目录
第一章执行摘要和主要发现
第二章 报告要约
第三章 引言
- 研究假设和市场定义
- 研究范围
- 调查方法
第四章 产业主要趋势
- 人口
- 人均GDP
- 消费者汽车支出(cvp)
- 通货膨胀率
- 汽车贷款利率
- 共乘
- 电气化的影响
- 电动车充电站
- 电池组价格
- 新款 Xev 车型发布
- 燃油价格
- OEM生产统计
- 法律规范
- 价值炼和通路分析
第五章市场区隔
- 燃料类别
- BEV
- FCEV
- HEV
- 国家
- 加拿大
- 墨西哥
- 美国
第六章 竞争格局
- 关键策略趋势
- 市场占有率分析
- 商业状况
- 公司简介
- Blue Bird Corporation
- BYD Auto Co. Ltd.
- CAF Group(Solaris Bus & Coach)
- Daimler Truck Holding AG
- GILLIG LLC
- GreenPower Motor Company Inc.
- Lion Electric Company
- NFI Group Inc.
- Proterra INC.
- Volvo Group
- Xiamen King Long Motor Group Co. Ltd.
第七章 CEO 的关键策略问题
第 8 章 附录
- 世界概况
- 概述
- 五力分析框架
- 全球价值链分析
- 市场动态(DRO)
- 资讯来源及延伸阅读
- 图片列表
- 关键见解
- 数据包
- 词彙表
简介目录
Product Code: 93000
The North America Electric Bus Market size is estimated at 0.77 billion USD in 2025, and is expected to reach 1.3 billion USD by 2029, growing at a CAGR of 14.16% during the forecast period (2025-2029).
Environmental concerns and the need to reduce carbon emissions have pushed governments and transportation authorities to adopt cleaner and more sustainable modes of transportation
- The demand for electric buses in North America is growing significantly. The United States is one of the top countries with the highest sales of electric buses, followed by Canada and Mexico. Factors such as expanding populations, rising traffic, and a change in priorities for using public transit are contributing to the growth of electric buses in the region.
- The electric bus market faced a setback during the COVID-19 pandemic, which brought the transportation sector to a standstill. However, as the region emerged from the pandemic, there was a notable uptick in public transportation demand, positively impacting the electric bus market. Consequently, North America saw a rise in electric bus sales in 2022 compared to 2021.
- By 2027, the market value of electric buses in North America is projected to exceed USD 850 million. Both the United States and Canadian governments are devising plans to establish robust charging infrastructure across the region. In June 2021, the Federal Transit Administration (FTA), a division of the US Department of Transportation, awarded approximately USD 182 million. These funds are expected to benefit around 49 electric bus projects spanning 46 states. Through its Low-No Program, the FTA aims to facilitate the adoption of green technologies and fuels, assisting transportation organizations in procuring electric and hydrogen buses. These initiatives are poised to further propel the growth of the North American electric bus market in the future.
North America Electric Bus Market Trends
Growing demand for electric vehicles in North America driven by government support and growing environmental concerns
- The CVP in Russia has experienced significant fluctuations in recent years. It climbed steadily from USD 208.2 million in 2017, peaking in 2019. However, it dipped to USD 193.9 million in 2020, largely due to the economic challenges brought on by the COVID-19 pandemic. Notably, the market rebounded sharply in 2022, reaching USD 269.8 million. This resurgence highlights both the resilience of the Russian automotive sector and the potential impact of economic stimulus measures and heightened consumer demand.
- Government incentives and subsidies are proving to be a strong draw for customers, particularly logistics and e-commerce firms, in their adoption of electric commercial vehicles. A case in point is Canada and North America, where, in April 2022, the government unveiled federal rebates of USD 5000 for electric light- and medium-duty vehicles. These initiatives are expected to significantly bolster the demand for electric commercial vehicles in North America from 2024 to 2030.
- Government initiatives, including plans for EV deployment, attractive incentives, and foreign investment allowances, are set to propel the electric vehicle market across North American nations. In a notable move, in March 2022, Volkswagen committed a staggering USD 7 billion to establish an electric car manufacturing facility in North America. By 2030, the automaker plans to roll out 25 new EV models, catering to customers in the US, Mexico, and Canada. As a result, the demand for electric vehicles is projected to witness a notable surge across various North American countries from 2024 to 2030.
North America Electric Bus Industry Overview
The North America Electric Bus Market is fairly consolidated, with the top five companies occupying 81.84%. The major players in this market are BYD Auto Co. Ltd., GreenPower Motor Company Inc., Lion Electric Company, NFI Group Inc. and Proterra INC. (sorted alphabetically).
Additional Benefits:
- The market estimate (ME) sheet in Excel format
- 3 months of analyst support
TABLE OF CONTENTS
1 EXECUTIVE SUMMARY & KEY FINDINGS
2 REPORT OFFERS
3 INTRODUCTION
- 3.1 Study Assumptions & Market Definition
- 3.2 Scope of the Study
- 3.3 Research Methodology
4 KEY INDUSTRY TRENDS
- 4.1 Population
- 4.2 GDP Per Capita
- 4.3 Consumer Spending For Vehicle Purchase (cvp)
- 4.4 Inflation
- 4.5 Interest Rate For Auto Loans
- 4.6 Shared Rides
- 4.7 Impact Of Electrification
- 4.8 EV Charging Station
- 4.9 Battery Pack Price
- 4.10 New Xev Models Announced
- 4.11 Fuel Price
- 4.12 Oem-wise Production Statistics
- 4.13 Regulatory Framework
- 4.14 Value Chain & Distribution Channel Analysis
5 MARKET SEGMENTATION (includes market size in Value in USD and Volume, Forecasts up to 2029 and analysis of growth prospects)
- 5.1 Fuel Category
- 5.1.1 BEV
- 5.1.2 FCEV
- 5.1.3 HEV
- 5.2 Country
- 5.2.1 Canada
- 5.2.2 Mexico
- 5.2.3 US
6 COMPETITIVE LANDSCAPE
- 6.1 Key Strategic Moves
- 6.2 Market Share Analysis
- 6.3 Company Landscape
- 6.4 Company Profiles
- 6.4.1 Blue Bird Corporation
- 6.4.2 BYD Auto Co. Ltd.
- 6.4.3 CAF Group (Solaris Bus & Coach)
- 6.4.4 Daimler Truck Holding AG
- 6.4.5 GILLIG LLC
- 6.4.6 GreenPower Motor Company Inc.
- 6.4.7 Lion Electric Company
- 6.4.8 NFI Group Inc.
- 6.4.9 Proterra INC.
- 6.4.10 Volvo Group
- 6.4.11 Xiamen King Long Motor Group Co. Ltd.
7 KEY STRATEGIC QUESTIONS FOR VEHICLES CEOS
8 APPENDIX
- 8.1 Global Overview
- 8.1.1 Overview
- 8.1.2 Porter's Five Forces Framework
- 8.1.3 Global Value Chain Analysis
- 8.1.4 Market Dynamics (DROs)
- 8.2 Sources & References
- 8.3 List of Tables & Figures
- 8.4 Primary Insights
- 8.5 Data Pack
- 8.6 Glossary of Terms
02-2729-4219
+886-2-2729-4219
 2025年全球电动校车车队管理市场报告
 电动巴士和公共交通市场预测至2032年:按动力方式、车辆配置、充电类型、应用和区域分類的全球分析
 电动公车市场(按推进类型、底盘类型、应用、载客量、行驶里程和最终用户划分)—2025-2032 年全球预测电动小巴市场按动力类型、座位数、续航里程、电池容量、应用领域和所有权类型划分-2025-2032年全球预测电动式中重型客车市场:依动力系统、车辆尺寸、应用、电池容量、充电方式和所有权类型划分-2025-2032年全球预测电动校车市场按动力类型、车身长度、电池容量和最终用户划分-2025-2032年全球预测
 全球电动公车市场(按公车长度、电池类型、电池容量、功率输出、续航里程、载客量、应用、消费者、车辆总重、推进系统、零件、自主水平和地区划分)- 预测至 2032 年
 电动公车互联基础设施 - 第三版
 全球电动校车市场
 全球燃料电池电动公车市场研究报告 - 产业分析、规模、份额、成长、趋势及 2025 年至 2033 年预测
▼