


 |
市场调查报告书
商品编码
1693686
亚太地区干混砂浆:市场占有率分析、产业趋势与统计、成长预测(2025-2030 年)Asia-Pacific Dry Mix Mortar - Market Share Analysis, Industry Trends & Statistics, Growth Forecasts (2025 - 2030) |
||||||
价格
※ 本网页内容可能与最新版本有所差异。详细情况请与我们联繫。
简介目录
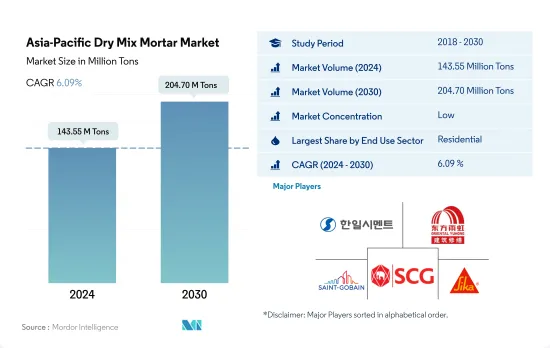
预计 2024 年亚太干混砂浆市场规模为 1.4355 亿吨,到 2030 年将达到 2.047 亿吨,预测期内(2024-2030 年)的复合年增长率为 6.09%。
住宅需求成长可能推动干混砂浆的成长
- 到2022年,亚太地区将主导全球干混砂浆市场,占40.73%的市场。 2023年,受商业和住宅建筑领域需求成长的推动,该地区干混砂浆消费量增加了4.07%。
- 2022年,亚太地区住宅领域成为干混砂浆的主要消费领域,占60.34%的市占率。都市化加快、政府倡议以及国内外投资刺激了该地区的住宅需求。例如,印尼政府的目标是到2025年建造100万套住宅,而该国的住宅总需求预计将达到3,000万套。因此,预计住宅领域对干混砂浆的需求将从 2023 年的 8,150 万吨激增至 2030 年的 1.197 亿吨。
- 预计亚太地区商业领域的干混砂浆消费量量成长率最高,预测期内复合年增长率为 7.64%。预计购物中心、办公空间和零售中心的成长将导致 2025 年商业占地面积与前一年同期比较增加 1.78 亿平方英尺。例如,预计到 2026 年,印度前七大城市的甲级办公室市场将扩大到 10 亿平方英尺,到 2030 年将进一步扩大到 12 亿平方英尺。因此,预计到 2030 年,商业领域对干混砂浆的需求将比 2023 年增加 1,395 万吨。
由于政府加大对建筑业的投资,亚太地区对干混砂浆的需求旺盛
- 干混砂浆由精确比例的水泥、沙子、矿物和功能添加剂製成,可用于混凝土保护、维修、抹灰、抹灰和防水。 2022 年澳洲干混砂浆市场销售量与 2021 年相比大幅成长 17.32%。 2023 年,受住宅和基础建设强劲投资的推动,亚太地区销量较去年与前一年同期比较成长 4.07%。
- 2022 年,中国将在亚太干混砂浆市场占据主要份额。儘管政府实施封锁,但中国基础设施产业的规模在 2021 年至 2022 年期间仍成长了 4.29%。这一增长得益于交通基础设施支出的显着增加,从 2021 年的 1,576 亿美元增加到 2022 年的 1,656 亿美元。此外,中国住宅建筑业经历了重大改革和政策变化,重新点燃了消费者对购屋的兴趣。随着持续的投入和努力,中国市场预计2023年将实现3.83%的销售成长。
- 在预测期内,印尼干混砂浆市场将以 6.74% 的复合年增长率最快。根据《首都建设法案》,印尼已启动一项耗资 320 亿美元的计划,计划在 2045 年将首都从雅加达迁至婆罗洲。这项雄心勃勃的计划包括多用户住宅、製造单位和基础设施,这意味着干混砂浆的需求将激增。
亚太干混砂浆市场趋势
印度及其他地区零售和办公空间的成长推动了亚太商业建筑业的发展
- 2022年亚太地区新增零售占地面积与前一年同期比较3.23%。造成这项挫折的因素包括监管压力、通货膨胀上升和抵押房屋抵押贷款利率飙升等。预计到 2023 年,该地区将復苏,新增商业占地面积约 1.46 亿平方英尺。激增的主要原因是外国直接投资(FDI)增加,刺激了对新办公室、仓库、零售店和其他设施的需求。其中,预计2023年越南建筑业将吸引7,144万美元的外国直接投资。
- 2020 年,亚太地区新零售占地面积遭遇重大挫折,与 2019 年相比下降了 21.92%。下降的主要原因是政府大规模封锁扰乱了计划工作,并严重影响了供应链、设施和劳动力。然而,随着限制的放宽,该地区出现了显着的復苏,2021 年新的商业占地面积跃升 20.98%,达到约 5.26 亿平方英尺的占地面积。
- 预计亚太地区新商业占地面积将大幅成长,预计 2030 年将比 2023 年增加 14.1 亿平方英尺。这一增长是由对购物中心、办公空间和零售店不断增长的需求所推动的。亚太地区已成为全球零售强国,贡献了全球零售成长的近四分之三。例如,印度前七大城市的甲级办公室市场到 2026 年可能会成长到 10 亿平方英尺,到 2030 年可能会成长到 12 亿平方英尺。整体而言,预测期内亚太地区新商业占地面积预计复合年增长率为 5.16%。
印度的经济适用住宅将会增加,到2030年可能达到2,500万套,该地区的住宅建设也将扩大。
- 2022年亚太地区住宅占地面积较去年与前一年同期比较下降约5.39%。在新冠疫情期间建筑活动激增之后,该行业正逐渐恢復正常,而此次建筑活动数量出现下降。该地区住宅产业的发展受到人口成长、富裕程度提高和都市化快速发展的推动。预计 2023 年该地区新住宅占地面积将比 2022 年增加 4.1 亿平方英尺。
- 2020年,亚太地区新建住宅占地面积较2019年下降约5.06%。这主要是由于政府封锁、供应链中断、劳动力短缺、建筑生产力放缓以及外国投资低迷。然而,随着限制措施的放宽,该地区出现了强劲復苏,由于新房屋建设增加,2021 年新住宅住宅占地面积激增约 14 亿平方英尺。例如,仅在 2021 年,印度住宅房地产市场将在前七大城市推出约 163,000 套住宅。
- 预计预测期内亚太地区住宅新建建筑占地面积的复合年增长率将达到 3.98%。这一增长是由于住宅需求、投资增加和政府的优惠政策所致。重点建造更多经济适用住宅预计将振兴该地区的住宅建筑业并有助于其復苏。到 2030 年,预计印度将有超过 40% 的人口居住在都市区,这将需要额外 2,500 万套经济适用住宅。预计需求激增将推动印度住宅房地产市场到 2030 年达到 150 万套。
亚太干混砂浆产业概况
亚太干混砂浆市场较为分散,前五大公司占12.67%的市占率。该市场的主要企业有:韩一控股、东方雨虹、圣戈班、SCG和西卡股份公司(按字母顺序排列)。
其他福利
- Excel 格式的市场预测 (ME) 表
- 3个月的分析师支持
目录
第一章执行摘要和主要发现
第二章 报告要约
第三章 引言
- 研究假设和市场定义
- 研究范围
- 调查方法
第四章 产业主要趋势
- 终端使用领域的趋势
- 商业
- 工业/设施
- 基础设施
- 住宅
- 重大基础设施计划(目前和已宣布)
- 法律规范
- 价值炼和通路分析
第五章市场区隔
- 最终用途领域
- 商业
- 工业/设施
- 基础设施
- 住宅
- 应用
- 混凝土保护与维修
- 水泥浆
- 绝缘和饰面系统
- 石膏
- 使成为
- 磁砖胶
- 防水浆料
- 其他用途
- 国家
- 澳洲
- 中国
- 印度
- 印尼
- 日本
- 马来西亚
- 韩国
- 泰国
- 越南
- 其他亚太地区
第六章 竞争格局
- 关键策略趋势
- 市场占有率分析
- 商业状况
- 公司简介
- Asia Cement Co., Ltd.
- BBMG Corporation
- HANIL HOLDINGS CO.,LTD.
- MBCC Group
- Oriental Yuhong
- Saint-Gobain
- SAMPYO GROUP
- SCG
- Sika AG
- UltraTech Cement Ltd.
第七章:CEO面临的关键策略问题
第 8 章 附录
- 世界概况
- 概述
- 五力分析框架(产业吸引力分析)
- 全球价值链分析
- 市场动态(DRO)
- 资讯来源及延伸阅读
- 图片列表
- 关键见解
- 数据包
- 词彙表
简介目录
Product Code: 93365
The Asia-Pacific Dry Mix Mortar Market size is estimated at 143.55 million Tons in 2024, and is expected to reach 204.70 million Tons by 2030, growing at a CAGR of 6.09% during the forecast period (2024-2030).
Rising demand for housing units is likely to drive the dry mix mortar growth
- By 2022, Asia-Pacific dominated the global dry mix mortar market, accounting for 40.73% of the total share. In 2023, the region's dry mix mortar consumption grew by 4.07% in volume, driven by rising demand from both commercial and residential construction sectors.
- In 2022, the residential sector in Asia-Pacific emerged as the leading consumer of dry mix mortar, comprising 60.34% of the market. Factors such as increasing urbanization, government initiatives, and investments, both domestic and foreign, fueled the region's housing needs. For example, the Government of Indonesia (GOI) aimed to build 1 million housing units by 2025, with the country's total housing demand projected to hit 30 million units. Consequently, the demand for dry mix mortar in the residential sector was forecast to surge from 81.5 million tons in 2023 to 119.7 million tons in 2030.
- The commercial sector in Asia-Pacific was poised to witness the highest growth rate in dry mix mortar consumption, with a CAGR of 7.64% during the forecast period. Anticipated growth in shopping malls, office spaces, and retail centers led to a rise of 178 million sq. ft in commercial floor area in 2025 compared to the previous year. For instance, India's Grade A office market in its top seven cities was projected to expand to 1 billion square feet by 2026 and further to 1.2 billion square feet by 2030. Consequently, the demand for dry mix mortar in the commercial sector was estimated to increase by 13.95 million tons by 2030 compared to 2023.
High demand for dry-mix mortar forecast in Asia-pacific due to rising government investments in the construction sector
- Dry-mix mortar, comprising cement, sand, minerals, and functional additives in precise ratios, finds applications in concrete protection, renovation, rendering, plastering, and waterproofing. Australia's dry-mix mortar market witnessed a significant 17.32% volume growth in 2022 compared to 2021. In the year 2023, Asia-Pacific, driven by robust investments in residential and infrastructure construction, experienced a 4.07% volume growth over the previous year.
- In the year 2022, China held a substantial share of the Asia-Pacific dry-mix mortar market. Despite government-imposed lockdowns, China's infrastructure sector witnessed a 4.29% volume growth between 2021 and 2022. This growth was fueled by a notable increase in transport infrastructure spending, rising from USD 157.6 billion in 2021 to USD 165.6 billion in 2022. Additionally, the residential construction sector in China underwent significant reforms and policy changes, rekindling consumer interest in property purchases. With continued investments and initiatives, the Chinese market experienced a 3.83% volume growth in 2023.
- Indonesia's dry-mix mortar market is set to witness the fastest CAGR of 6.74% in volume during the forecast period. Under the "Capital City Bill," Indonesia embarked on a USD 32 billion project to relocate its capital from Jakarta to Borneo Island by the year 2045. This ambitious endeavor encompasses housing complexes, manufacturing units, and infrastructure, signaling a surge in dry-mix mortar demand.
Asia-Pacific Dry Mix Mortar Market Trends
Rising retail and office spaces in countries such as India to boost the Asia-Pacific commercial construction sector
- In 2022, Asia-Pacific witnessed a 3.23% decline in its commercial new floor area compared to the previous year. This setback was attributed to factors such as regulatory pressures, higher inflation, and a surge in mortgage rates. In 2023, the region rebounded, with commercial construction new floor area increasing by approximately 146 million sq. ft. This surge was primarily driven by a rise in foreign direct investment (FDI), which spurred the demand for new offices, warehouses, retail outlets, and other facilities. Notably, the Vietnamese construction sector attracted an FDI capital of USD 71.44 million in 2023.
- In 2020, the Asia-Pacific region experienced a significant setback in commercial new floor area, with a volume decline of 21.92% compared to 2019. This decline was primarily due to widespread government lockdowns, which disrupted project work and severely impacted supply chains, equipment, and labor. However, as restrictions eased, the region witnessed a remarkable rebound, with its commercial new floor area surging by 20.98% in 2021, reaching a volume of approximately 526 million sq. ft.
- Asia-Pacific's commercial new floor area is projected to witness substantial growth, with an estimated increase of 1.41 billion sq. ft by 2030 compared to 2023. This surge is fueled by a rising demand for shopping malls, office spaces, retail outlets, and more. The Asia-Pacific region is emerging as a global retail powerhouse, contributing to nearly three-quarters of the worldwide retail growth. For instance, the Indian Grade A office market in its top seven cities may to expand to 1 billion sq. ft by 2026 and further to 1.2 billion sq. ft. by 2030. Overall, the commercial new floor area in Asia-Pacific is projected to witness a volume CAGR of 5.16% during the forecast period.
Rising affordable housing units, such as India's likely to reach 25 million by 2030, to augment the residential constructions in the region
- In 2022, the residential new floor area in the Asia-Pacific region saw a volume decline of approximately 5.39% from the previous year. This dip was a result of the sector normalizing after a surge in building activity during the COVID-19 pandemic. The region's residential sector is driven by a growing population, increasing wealth, and rapid urbanization. The residential new floor area in the region was expected to rise by 410 million sq. ft in 2023 compared to 2022.
- In 2020, the residential new floor area in Asia-Pacific declined in volume by around 5.06% compared to 2019. This was primarily due to government-imposed lockdowns, disruptions in the supply chain, labor shortages, reduced construction productivity, and low foreign investments. However, as restrictions eased, the region saw a significant rebound, with the residential new floor area surging by about 1.4 billion sq. ft in 2021, driven by the addition of new residential housing units. For instance, in 2021 alone, the Indian residential real estate market introduced approximately 163 thousand new residential units across its top seven cities.
- The residential new floor area in the Asia-Pacific region is projected to witness a CAGR of 3.98% during the forecast period. This growth can be attributed to the demand for housing, increased investments, and favorable government policies. The focus on constructing more affordable housing units is expected to rejuvenate the residential construction sector in the region, aiding its recovery. By 2030, it is estimated that over 40% of India's population will reside in urban areas, leading to a demand for an additional 25 million affordable housing units. This surge in demand is expected to push the Indian residential real estate market to reach 1.5 million units by 2030.
Asia-Pacific Dry Mix Mortar Industry Overview
The Asia-Pacific Dry Mix Mortar Market is fragmented, with the top five companies occupying 12.67%. The major players in this market are HANIL HOLDINGS CO.,LTD., Oriental Yuhong, Saint-Gobain, SCG and Sika AG (sorted alphabetically).
Additional Benefits:
- The market estimate (ME) sheet in Excel format
- 3 months of analyst support
TABLE OF CONTENTS
1 EXECUTIVE SUMMARY & KEY FINDINGS
2 REPORT OFFERS
3 INTRODUCTION
- 3.1 Study Assumptions & Market Definition
- 3.2 Scope of the Study
- 3.3 Research Methodology
4 KEY INDUSTRY TRENDS
- 4.1 End Use Sector Trends
- 4.1.1 Commercial
- 4.1.2 Industrial and Institutional
- 4.1.3 Infrastructure
- 4.1.4 Residential
- 4.2 Major Infrastructure Projects (current And Announced)
- 4.3 Regulatory Framework
- 4.4 Value Chain & Distribution Channel Analysis
5 MARKET SEGMENTATION (includes market size, forecasts up to 2030 and analysis of growth prospects.)
- 5.1 End Use Sector
- 5.1.1 Commercial
- 5.1.2 Industrial and Institutional
- 5.1.3 Infrastructure
- 5.1.4 Residential
- 5.2 Application
- 5.2.1 Concrete Protection and Renovation
- 5.2.2 Grouts
- 5.2.3 Insulation and Finishing Systems
- 5.2.4 Plaster
- 5.2.5 Render
- 5.2.6 Tile Adhesive
- 5.2.7 Water Proofing Slurries
- 5.2.8 Other Applications
- 5.3 Country
- 5.3.1 Australia
- 5.3.2 China
- 5.3.3 India
- 5.3.4 Indonesia
- 5.3.5 Japan
- 5.3.6 Malaysia
- 5.3.7 South Korea
- 5.3.8 Thailand
- 5.3.9 Vietnam
- 5.3.10 Rest of Asia-Pacific
6 COMPETITIVE LANDSCAPE
- 6.1 Key Strategic Moves
- 6.2 Market Share Analysis
- 6.3 Company Landscape
- 6.4 Company Profiles
- 6.4.1 Asia Cement Co., Ltd.
- 6.4.2 BBMG Corporation
- 6.4.3 HANIL HOLDINGS CO.,LTD.
- 6.4.4 MBCC Group
- 6.4.5 Oriental Yuhong
- 6.4.6 Saint-Gobain
- 6.4.7 SAMPYO GROUP
- 6.4.8 SCG
- 6.4.9 Sika AG
- 6.4.10 UltraTech Cement Ltd.
7 KEY STRATEGIC QUESTIONS FOR CONCRETE, MORTARS AND CONSTRUCTION CHEMICALS CEOS
8 APPENDIX
- 8.1 Global Overview
- 8.1.1 Overview
- 8.1.2 Porter's Five Forces Framework (Industry Attractiveness Analysis)
- 8.1.3 Global Value Chain Analysis
- 8.1.4 Market Dynamics (DROs)
- 8.2 Sources & References
- 8.3 List of Tables & Figures
- 8.4 Primary Insights
- 8.5 Data Pack
- 8.6 Glossary of Terms
02-2729-4219
+886-2-2729-4219
 东协干混砂浆:市占率分析、产业趋势与统计、成长预测(2026-2031)干混砂浆:市场占有率分析、产业趋势与统计、成长预测(2026-2031)欧洲干粉砂浆:市场占有率分析、产业趋势与统计、成长预测(2026-2031)
 2026年全球干混砂浆添加剂和化学品市场报告
 塔式干粉砂浆搅拌站市场按产品类型、搅拌能力、应用、最终用途和分销管道划分-2026-2032年全球预测自流平砂浆添加剂市场按类型、形态、应用、终端用户产业和分销管道划分,全球预测,2026-2032年预拌建筑砂浆市场(依产品类型、形态、包装类型、应用、最终用途及通路划分)-2026-2032年全球预测
 干混砂浆添加剂和化学品市场规模、份额和成长分析(按添加剂类型、化学品类型、应用、最终用户和地区划分)—2026-2033年产业预测
 干混砂浆市场规模、份额和成长分析(按产品类型、粘合剂类型、添加剂、最终用户、技术、应用和地区划分)—产业预测(2026-2033 年)
 全球干混砂浆市场:依产品种类、塑化剂种类、应用、黏结剂系统及地区划分(至2032年)
▼