


 |
市场调查报告书
商品编码
1693753
美国生物防治剂:市场占有率分析、产业趋势、统计数据、成长预测(2025-2030 年)United States Biocontrol Agents - Market Share Analysis, Industry Trends & Statistics, Growth Forecasts (2025 - 2030) |
||||||
※ 本网页内容可能与最新版本有所差异。详细情况请与我们联繫。
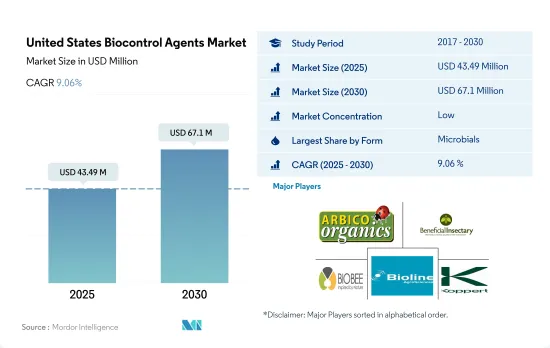
美国生物防治剂市场规模预计在 2025 年为 4,349 万美元,预计到 2030 年将达到 6,710 万美元,预测期内(2025-2030 年)的复合年增长率为 9.06%。
- 在美国,生物防治剂是农业生技药品市场中第二大消费品。 2022 年在作物保护领域的份额为 2.6%。
- 以微生物为基础的生物防治剂是美国生物防治剂市场中最大的消费者,2022 年占 89.1% 的份额。细菌、真菌、病毒和原生动物就是其中一些微生物。微生物以三种不同的方式充当生物防治剂:将疾病注入害虫体内、与害虫竞争或杀死害虫。
- 2022 年,真菌生物防治剂市场约占微生物生物防治剂市场以金额为准的 62.7%。预计从 2017 年到 2022 年,真菌生物防治剂市场规模将成长约 44.4%,可归因于农民对综合虫害管理和永续农业的认识不断提高。
- 2022年美国宏观生物防治剂的市占率为10.9%。大型生物是害虫的天敌,被称为无脊椎动物生物防治剂。这些包括螨虫、昆虫捕食者、寄生虫和昆虫病原线虫 (EPN)。
- 掠食者在生物防治剂市场占据主导地位,约占 2022 年市场价值的 83.8%。捕食者部分在整个生物防治剂市场中占据主导地位,主要是因为它能够攻击害虫的不同生命阶段,甚至不同害虫种类。与其他生物防治剂相比,掠食者是贪婪的。
- 使用以大肠桿菌和微生物为基础的生物防治剂可以减少对化学农药的需求,直接降低种植的整体成本。
美国生物防治剂市场趋势
由于国家法规的实施,有机种植面积增加,尤其是连作作物。
- 2021年,美国有机农业面积为62.3万公顷。过去二十年来,美国的有机农业取得了显着成长,这主要归功于具体法律法规的实施。 2021年加州有机农场和牧场数量为3061个,是美国获得认证的有机农场最多的州。宾州有超过 1,125 个经过认证的有机农场。 2019 年,有近 15,548,000 个经过认证的有机农场运作作物,有 7,139,000 个农场经营牧场和草场。包括苗圃和温室在内的作物销售额达到近 58 亿美元。
- 该国的有机农业以种植作物为主。 2021年,其占有机农地总面积的约71.8%。谷类生产是该国农业的主要支柱。主要谷物有玉米、小麦、稻米、小米等。有机产品的消费在美国消费者中越来越流行,他们越来越多地选择有机食品,因为它们具有多种健康益处。
- 有机园艺作物的总种植面积正在增加,从 2017 年的 112,900 公顷增加到 2021 年的 156,100 公顷。就 2021 年国内产量而言,前五的水果和蔬菜是苹果(31.1%)、草莓(9.5%)、橘子(6.9%)、罗马生菜(6.7%)和马铃薯(6.2%)。在贸易方面,进口量最大的产品是香蕉(53.1%)、酪梨(7.7%)、芒果(5.8%)、蓝莓(5.0%)和南瓜(4.3%),出口量最大的产品是苹果(80.0%)、梨子(14.4%)、樱桃(4.0%)、洋葱干(1.5%)。
对有机农产品的需求不断增加,尤其是在水果和蔬菜领域,人均有机食品支出也在增加
- 美国是世界最大的有机产品消费国。根据《营养商业日誌》(NBJ,2021)报道,截至 2020 年,该国有机食品总销售额达 516 亿美元。美国是北美地区人均有机产品支出最高的国家,2021年为186.7美元。
- 自有机食品零售业诞生以来,有机新鲜水果和蔬菜一直是主导的有机食品类别。 2020年,这些有机产品的零售额达到200亿美元,显示对有机农产品的需求不断成长。过去二十年来,对有机新鲜水果和蔬菜的需求稳定成长。有机食品销售的成长是由于消费者意识的增强,尤其是高所得族群。需求量最大的有机食品类别包括鸡蛋、乳製品、水果和蔬菜等主食。
- 不同人群和地区的人们对有机食品的偏好各不相同。 18-29 岁的年轻人比 65 岁以上的老年人更有可能想要有机产品(超过 50%)。收入和地区也起着一定的作用,42% 的收入低于 30,000 美元的人想要有机产品,而 49% 的收入超过 75,000 美元的人想要有机产品。
- 该国有机产品的人均支出正在增加,2017-2021 年期间的复合年增长率为 5.2%。有机产品需求的不断增长为美国有机生产商创造了进入国内和国际高价值市场的机会。有机产品的价格溢价是低收入消费者消费有机食品的主要限制因素之一。
美国生物防治剂产业概况
美国生物防治剂市场细分,前五大公司占28.07%。市场的主要企业包括 Arizona Biological Control Inc.、Beneficial Insectary Inc.、Biobee Ltd、Bioline AgroSciences Ltd、Koppert Biological Systems Inc. 等。
其他福利
- Excel 格式的市场预测 (ME) 表
- 3个月的分析师支持
目录
第一章执行摘要和主要发现
第二章 报告要约
第三章 引言
- 研究假设和市场定义
- 研究范围
- 调查方法
第四章 产业主要趋势
- 有机种植区
- 有机产品人均支出
- 法律规范
- 美国
- 价值炼和通路分析
第五章市场区隔
- 形式
- 大型微生物
- 按生物体
- 昆虫病原线虫
- 寄生虫
- 铁血战士
- 微生物
- 按生物体
- 细菌生物防治剂
- 真菌生物防治剂
- 其他微生物
- 大型微生物
- 作物类型
- 经济作物
- 园艺作物
- 耕地作物
第六章竞争格局
- 重大策略倡议
- 市场占有率分析
- 商业状况
- 公司简介
- Andermatt Group AG
- Arizona Biological Control Inc.
- Beneficial Insectary Inc.
- Biobee Ltd
- Bioline AgroSciences Ltd
- Bioworks Inc.
- Koppert Biological Systems Inc.
第七章:CEO面临的关键策略问题
第 8 章 附录
- 世界概况
- 概述
- 五力分析框架
- 全球价值链分析
- 市场动态(DRO)
- 资讯来源及延伸阅读
- 图片列表
- 关键见解
- 数据包
- 词彙表
The United States Biocontrol Agents Market size is estimated at 43.49 million USD in 2025, and is expected to reach 67.1 million USD by 2030, growing at a CAGR of 9.06% during the forecast period (2025-2030).
- Biocontrol agents are the second most consumed in the agricultural biologicals market in the United States. They accounted for a share of 2.6% in the crop protection segment in 2022.
- Microbials-based biocontrol agents are most consumed in the biocontrol agents market in the United States, and they accounted for a share of 89.1% in 2022. Bacteria, fungi, viruses, and protozoans are some of these microbes. In three different ways, microbes function as biocontrol agents: either they inject pests with diseases, outcompete them, or even kill them.
- The fungi biocontrol agents segment of the market accounted for about 62.7% of the total microbial biocontrol agents market by value in 2022. The market value for fungal biocontrol agents increased by about 44.4% from 2017 to 2022, which can be attributed to farmers' increased awareness of integrated pest management and sustainable agriculture.
- Macrobials-based biocontrol agents accounted for a share of 10.9% in the United States in 2022. Macrobials are natural enemies of pests and are known as invertebrate biocontrol agents. They include mites, insect predators, parasitoids, and entomopathogenic nematodes (EPNs).
- Predators dominated the biocontrol agents market, and they accounted for about 83.8% of the market value in 2022. The dominance of the predators' segment in the overall biocontrol agents market is mainly due to their ability to attack different life stages of pests and even different pest species. They are voracious feeders compared to other biocontrol agents.
- Using macrobials-based and microbials-based biocontrol agents can reduce the need for chemical pesticides, directly reducing the overall cost of cultivation.
United States Biocontrol Agents Market Trends
Increase in organic area, particularly in row crops, due to country's laws and regulations
- In 2021, the area under organic agricultural farming in the United States was 623 thousand hectares. Organic agriculture in the United States has increased significantly in the previous 20 years, mostly due to the introduction of particular laws and regulations. The number of organic farms and ranches in California was 3,061 in 2021, the largest number of certified organic farms in the United States. There were over 1,125 certified organic farms in Pennsylvania. Nearly 15,548 thousand certified organic farms in operation used cropland in 2019, while 7,139 thousand farms operated pastureland and rangeland. The sales value of crops, including those from nurseries and greenhouses, amounted to nearly USD 5.8 billion.
- Row crops dominated organic farming in the nation. In 2021, they accounted for about 71.8% of all organic cropland. The production of cereal crops predominates the country's agricultural sector. The main cereals include maize, wheat, rice, and millet. The consumption of organic products has become popular among US consumers who increasingly choose to eat organic foods because of their various health benefits.
- There is an increasing trend in the overall organic horticultural crop cultivation area, from 112.9 thousand hectares in 2017 to 156.1 thousand hectares in 2021. Regarding domestic production in 2021, the top five fruits and vegetables were apples (31.1%), strawberries (9.5%), oranges (6.9%), romaine lettuce (6.7%), and potatoes (6.2%). In the case of trade, the most imported produce was bananas (53.1%), avocados (7.7%), mangoes (5.8%), blueberries (5.0%), and squashes (4.3%), while the most exported were apples (80.0%), pears (14.4%), cherries (4.0%), dried onions (1.5%), and potatoes (0.2%).
Growing demand for organic produce especially in the fruits and vegetables sector, rise in per capita spending on organic food
- The United States is one of the largest organic product consumers in the world. As of 2020, the total sales of organic food products in the country accounted for USD 51.6 billion, according to the Nutrition Business Journal (NBJ, 2021). The United States had the largest per capita spending on organic products in the North American region, worth USD 186.7 in 2021.
- Organic fresh fruits and vegetables have been the leading category of organic food since the establishment of the organic food retail industry. In 2020, retail sales for these organic products were valued at USD 20.0 billion, showing a growing demand for organic produce. The demand for organic fresh fruits and vegetables has steadily risen over the past two decades. Organic food sales are rising due to growing consumer awareness, especially among high-income consumers. The most in-demand organic categories include basic foods like eggs, dairy, fruits, and vegetables.
- Organic food preferences vary by demographic and region. Younger people aged between 18 and 29 are more likely to seek organic products (over 50%) compared to older people aged 65 and above. Income and region also play a role, with 42% of those with under USD 30,000 income and 49% of those with over USD 75.0 thousand seeking organic products.
- The per capita spending on organic products is increasing in the country, recording a CAGR of 5.2% between 2017 and 2021. The growing demand for organic products is creating opportunities for US organic producers to tap into high-value markets both domestically and abroad. The price premium associated with organic products is one of the major limiting factors for organic food consumption for low-income consumers.
United States Biocontrol Agents Industry Overview
The United States Biocontrol Agents Market is fragmented, with the top five companies occupying 28.07%. The major players in this market are Arizona Biological Control Inc., Beneficial Insectary Inc., Biobee Ltd, Bioline AgroSciences Ltd and Koppert Biological Systems Inc. (sorted alphabetically).
Additional Benefits:
- The market estimate (ME) sheet in Excel format
- 3 months of analyst support
TABLE OF CONTENTS
1 EXECUTIVE SUMMARY & KEY FINDINGS
2 REPORT OFFERS
3 INTRODUCTION
- 3.1 Study Assumptions & Market Definition
- 3.2 Scope of the Study
- 3.3 Research Methodology
4 KEY INDUSTRY TRENDS
- 4.1 Area Under Organic Cultivation
- 4.2 Per Capita Spending On Organic Products
- 4.3 Regulatory Framework
- 4.3.1 United States
- 4.4 Value Chain & Distribution Channel Analysis
5 MARKET SEGMENTATION (includes market size in Value in USD and Volume, Forecasts up to 2030 and analysis of growth prospects)
- 5.1 Form
- 5.1.1 Macrobials
- 5.1.1.1 By Organism
- 5.1.1.1.1 Entamopathogenic Nematodes
- 5.1.1.1.2 Parasitoids
- 5.1.1.1.3 Predators
- 5.1.2 Microbials
- 5.1.2.1 By Organism
- 5.1.2.1.1 Bacterial Biocontrol Agents
- 5.1.2.1.2 Fungal Biocontrol Agents
- 5.1.2.1.3 Other Microbials
- 5.1.1 Macrobials
- 5.2 Crop Type
- 5.2.1 Cash Crops
- 5.2.2 Horticultural Crops
- 5.2.3 Row Crops
6 COMPETITIVE LANDSCAPE
- 6.1 Key Strategic Moves
- 6.2 Market Share Analysis
- 6.3 Company Landscape
- 6.4 Company Profiles (includes Global Level Overview, Market Level Overview, Core Business Segments, Financials, Headcount, Key Information, Market Rank, Market Share, Products and Services, and Analysis of Recent Developments).
- 6.4.1 Andermatt Group AG
- 6.4.2 Arizona Biological Control Inc.
- 6.4.3 Beneficial Insectary Inc.
- 6.4.4 Biobee Ltd
- 6.4.5 Bioline AgroSciences Ltd
- 6.4.6 Bioworks Inc.
- 6.4.7 Koppert Biological Systems Inc.
7 KEY STRATEGIC QUESTIONS FOR AGRICULTURAL BIOLOGICALS CEOS
8 APPENDIX
- 8.1 Global Overview
- 8.1.1 Overview
- 8.1.2 Porter's Five Forces Framework
- 8.1.3 Global Value Chain Analysis
- 8.1.4 Market Dynamics (DROs)
- 8.2 Sources & References
- 8.3 List of Tables & Figures
- 8.4 Primary Insights
- 8.5 Data Pack
- 8.6 Glossary of Terms
 生物防治剂市场-2026-2031年预测
 全球生物防治剂市场
 生物防治剂市场机会、成长动力、产业趋势分析及 2025 - 2034 年预测
 生物防治剂市场按类型、施用方法、剂型、作物类型、施用方式及地区划分
 中国生物防治剂市场:份额分析、产业趋势与统计、成长预测(2025-2030)亚太地区生物防治剂:市场占有率分析、产业趋势与统计、成长预测(2025-2030 年)北美生物防治剂:市场占有率分析、产业趋势、统计数据、成长预测(2025-2030 年)印度生物防治剂:市场占有率分析、产业趋势与统计、成长预测(2025-2030)欧洲生物防治剂:市场占有率分析、产业趋势与统计、成长预测(2025-2030)
 生物防治剂市场:2033年市场分析与预测 - 依类型、产品、应用、技术、最终用户、形式、组件、模式、阶段和服务