


 |
市场调查报告书
商品编码
1693772
亚太地区生物防治剂:市场占有率分析、产业趋势与统计、成长预测(2025-2030 年)Asia-Pacific Biocontrol Agents - Market Share Analysis, Industry Trends & Statistics, Growth Forecasts (2025 - 2030) |
||||||
※ 本网页内容可能与最新版本有所差异。详细情况请与我们联繫。
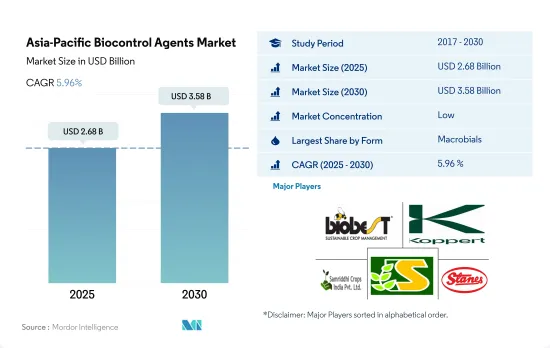
预计 2025 年亚太地区生物防治剂市场规模将达到 26.8 亿美元,到 2030 年预计将达到 35.8 亿美元,预测期内(2025-2030 年)的复合年增长率为 5.96%。
- 食肉动物在宏观生物领域占据主导地位,2022 年的市场占有率为 90.6%。捕食者在整个生物防治剂市场中的主导地位主要是因为它们能够攻击不同生命阶段的害虫,甚至不同的害虫种类,因为它们比其他生物防治剂更贪婪地进食。
- 许多捕食性节肢动物,包括甘蓝夜蛾、臭虫幼虫和螨虫,都是敏捷而凶猛的猎人。它们积极地在地面或植被中寻找猎物。其他捕猎者,例如蜻蜓和蚊蚋,在飞行时捕捉猎物。相较之下,伏击猎人会耐心地坐着,等待移动中的猎物。例如,螳螂通常伪装得很好,并利用出其不意的方式捕获毫无戒心的受害者。
- 微生物生物防治剂市场到2022年将占0.1%。微生物生物防治剂比宏观生物防治剂更容易在实验室中培养和用于商业用途,也更容易应用。
- 2022 年,真菌生物防治剂占亚太生物防治剂市场微生物部分的 31.0%。商业性最常用作生物防治剂的真菌种类是白殭菌和绿色木霉。白菌是一种用于防治多种害虫的真菌,而绿色木霉则透过麻痹引起有害疾病的真菌来控制多种植物疾病。
- 2022 年,细菌生物防治剂占亚太微生物市场的 28.9%。研究最深入的细菌属于假单胞菌属、芽孢桿菌属和链霉菌属,并且已註册为商业产品。
- 亚太生物防治剂市场成长迅速,印度占据主导地位,2022 年的市场占有率为 51.0%。同年,微生物生物防治剂部分占亚太市场的 60.1%。微生物生物防治剂之所以受欢迎,是因为它们比宏观生物防治剂更容易在实验室中生长以用于商业目的,并且更容易应用。预计 2023 年至 2029 年期间微生物领域的复合年增长率将达到 8.4%。
- 连续作物种植在该地区占主导地位,占 2022 年亚太地区有机种植总面积的约 67.5%,同年消耗了 82.7% 的市场以金额为准。稻米、木薯、玉米、大豆、甘蔗、椰子和橡胶是该地区的主要作物。
- 中国将占据亚太地区生物防治剂市场第二大份额,到2022年将占42.3%。中国政府为减少化学农药整体使用所做的努力以及各级地方政府制定的有机农业发展计画正在推动中国生物防治剂市场的发展。此外,还推出了奖励,鼓励生产者转向有机农业。这些因素可能会在 2023 年至 2029 年期间进一步推动该国的生物防治剂市场的发展。
- 亚太生物防治剂市场为公司和投资者带来了巨大的成长机会。由于对有机产品的需求不断增长以及政府和非政府推动有机农业的各种倡议,预计亚太生物防治剂市场在 2023-2029 年期间的复合年增长率将达到 8.4%。
亚太生物防治剂市场趋势
中国、印度、印尼和澳洲等国政府的支持日益增强,有助于推动该地区的有机农业
- 根据FiBL统计,2021年亚太地区有机农地面积将超过370万公顷,占全球有机农地面积的26.4%。 2017年至2022年间,有机种植面积增加了19.3%。截至 2020 年,该地区共有 183 万家有机生产者,其中印度以 130 万家位居榜首。中国、印度、印尼和澳洲是该地区有机种植面积最大的国家。中国和印度等国家的政府部门正在不断推广有机农业,以减少作物种植对化学物质的依赖。例如,印度实施了「Paramparagat Krishi Vikas Yojana」和「全印度有机农业网路计画」(AI-NPOF)等计画。
- 2021年,中国以250万公顷的面积占最大份额,为66.1%,其次是印度,为19.3%,印尼,为1.5%,澳大利亚,为1.4%。所有有机农地分为三种作物类型:连续作物、园艺作物和经济作物。连作作物占该地区有机土地的最大份额,2021 年为 67.5%,即 250 万公顷。该地区种植的主要连作作物包括水稻、小麦、豆类、大豆和小米。
- 经济作物将占第二大份额,到2021年将达到70万公顷,占有机农地的18.5%。全球对糖和有机茶等有机经济作物的需求正在增加。中国和印度分别是有机绿茶和有机红茶的最大生产国。由于国际需求不断增长,该地区有机种植面积预计会增加。
澳洲人均有机产品支出最高,而中国有机食品市场成长迅速
- 2021 年该地区人均有机产品支出为 85.1 美元。同年,澳洲人均有机产品支出较高,为 58.3 美元,主要是由于消费者认为有机食品更健康,导致需求增加。根据全球有机贸易的数据,2021 年澳洲有机包装食品和饮料市场价值 8.852 亿美元。
- 预计2021年中国有机食品市场将成长13.3%,并将持续维持正成长模式,2023年至2029年的复合年增长率为7.1%。预计到2025年,有机市场规模将达到64亿美元,这得益于年轻一代越来越重视有机产品,以及由于职业母亲数量的增加和健康保健趋势的普及,对有机婴儿食品的需求不断增长。
- 印度的有机产品远远落后于全球需求的 1.0%,2021 年的人均支出仅 0.08 美元。然而,印度市场在未来几年可能会继续成长,到 2025 年将达到 1.533 亿美元。目前,该地区的有机市场高度分散,只有少数超级市场和专卖店销售有机产品。增加消费者知识和改变购买模式可能会让人们更了解该地区有机食品的永续性。人均收入的增加和消费者对有机食品重要性的认识的提高可能会推动亚太地区人均有机食品支出的增加。
亚太地区生物防治剂产业概况
亚太生物防治剂市场细分化,前五大公司占2.52%。市场的主要企业有 Biobest Group NV、Koppert Biological Systems Inc.、Samriddhi Crops India Pvt Ltd、Sonkul Agro Industries、T.Stanes, Company Limited 等。
其他福利
- Excel 格式的市场预测 (ME) 表
- 3个月的分析师支持
目录
第一章执行摘要和主要发现
第二章 报告要约
第三章 引言
- 研究假设和市场定义
- 研究范围
- 调查方法
第四章 产业主要趋势
- 有机种植区
- 有机产品人均支出
- 法律规范
- 澳洲
- 中国
- 印度
- 印尼
- 日本
- 菲律宾
- 泰国
- 越南
- 价值炼和通路分析
第五章市场区隔
- 形式
- 宏观营养学
- 按生物体
- 昆虫病原线虫
- 寄生虫
- 铁血战士
- 微生物
- 按生物体
- 细菌生物防治剂
- 真菌生物防治剂
- 其他微生物
- 宏观营养学
- 作物类型
- 经济作物
- 园艺作物
- 耕地作物
- 原产地
- 澳洲
- 中国
- 印度
- 印尼
- 日本
- 菲律宾
- 泰国
- 越南
- 其他亚太地区
第六章竞争格局
- 关键策略趋势
- 市场占有率分析
- 商业状况
- 公司简介
- Andermatt Group AG
- Biobest Group NV
- Henan Jiyuan Baiyun Industry Co. Ltd
- KN Bio Sciences India Pvt. Ltd
- Koppert Biological Systems Inc.
- Samriddhi Crops India Pvt Ltd
- Sonkul Agro Industries
- T.Stanes and Company Limited
第七章:CEO面临的关键策略问题
第 8 章 附录
- 世界概况
- 概述
- 五力分析框架
- 全球价值链分析
- 市场动态(DRO)
- 资讯来源及延伸阅读
- 图片列表
- 关键见解
- 数据包
- 词彙表
The Asia-Pacific Biocontrol Agents Market size is estimated at 2.68 billion USD in 2025, and is expected to reach 3.58 billion USD by 2030, growing at a CAGR of 5.96% during the forecast period (2025-2030).
- Predators dominated the macrobials segment with a market share of 90.6% in 2022. The dominance of the predators segment in the overall biocontrol agents market is mainly due to their ability to attack different life stages of pests and even different pest species, as they are more voracious feeders than other biocontrol agents.
- Many predatory arthropods, including lady beetles, lacewing larvae, and mites, are agile and ferocious hunters. They actively stalk their prey on the ground or in vegetation. Other hunters, such as dragonflies and robber flies, catch their prey in flight. In contrast, ambushers patiently sit and wait for mobile prey. Praying mantids, for example, are usually well camouflaged and use the element of surprise to nab their unsuspecting victims.
- The microbial biocontrol agents market accounted for 0.1% in the year 2022. The microbial biocontrol agents can easily be multiplied for commercial purposes in laboratories and have higher ease of application compared to macrobial biocontrol agents.
- Fungal biocontrol agents accounted for 31.0% of the microbial segment of the Asia-Pacific biocontrol agents market in 2022. The most commercially exploited fungal species as biocontrol agents are Beauvaria bassiania and Trichoderma viride. Beauvaria bassiania is a fungus that is used against a wide range of pests, and Trichoderma viride is used to control a wide range of plant diseases by paralyzing the harmful disease-causing fungi.
- Bacterial biocontrol agents accounted for 28.9% of the Asia-Pacific microbials market in 2022. Some of the most intensively studied are bacteria belonging to the genus Pseudomonas spp., Bacillus spp., and Streptomyces spp., which have already been registered as commercial products.
- The Asia-Pacific biocontrol agents market is growing rapidly, dominated by India, which held a market share of 51.0% in 2022. The microbial biocontrol agents segment accounted for 60.1% of the Asia-Pacific market in the same year. They are popular since they can be easily multiplied for commercial purposes in laboratories and have higher ease of application than macrobial biocontrol agents. The microbial segment is projected to witness a CAGR of 8.4% between 2023 and 2029.
- The dominance of row crop cultivation in the region, accounting for about 67.5% of the total organic cultivation area in the Asia-Pacific region in 2022, led to them recording consumption of 82.7% of the market by value in the same year. Rice, cassava, corn, soybean, sugarcane, coconut, and rubber are major crops cultivated in the region.
- China holds the second-largest share in the Asia-Pacific biocontrol agents market, accounting for a share of 42.3% in 2022. The Chinese government's initiatives to decrease the overall use of chemical pesticides and development plans for local organic agriculture by municipal governments at all levels are helping boost the Chinese biological controls market. In addition, incentives have been introduced to encourage producers to switch to organic farming. These factors may further drive the biocontrol agents market in the country between 2023 and 2029.
- The Asia-Pacific biocontrol agents market represents significant growth opportunities for businesses and investors. With the increasing demand for organic products and various government and non-government initiatives to promote organic farming, the Asia-Pacific biocontrol agents market is projected to witness a CAGR of 8.4% between 2023 and 2029.
Asia-Pacific Biocontrol Agents Market Trends
Growing government support in countries like China, India, Indonesia, and Australia, boosts organic farming in the region
- The area of organic agricultural land in Asia-Pacific was over 3.7 million ha in 2021, representing 26.4% of the global organic area, as per FiBL statistics. The organic area under cultivation grew by 19.3% between 2017-2022. As of 2020, the region had 1.83 million organic producers, with India topping the list with 1.3 million organic producers. China, India, Indonesia, and Australia are the major countries with large organic cultivation areas in the region. Government authorities in countries like China and India are constantly promoting organic agriculture to reduce reliance on chemical inputs for crop cultivation. For instance, India has implemented schemes like Paramparagat Krishi Vikas Yojana and the All India Network Programme on Organic Farming (AI-NPOF).
- In 2021, China accounted for a maximum share of 66.1%, with 2.5 million ha, followed by India, Indonesia, and Australia, with 19.3%, 1.5%, and 1.4%, respectively. The total organic land is divided into three crop types, namely row crops, horticultural crops, and cash crops. Row crops occupy a major share of organic agricultural land in the region, accounting for 67.5% share, i.e., 2.5 million ha in 2021. The major row crops grown in the region include paddy, wheat, pulses, soybeans, and millets.
- Cash crops held the second largest share, with 0.7 million ha in 2021, accounting for an 18.5% share of organic cropland. The demand for organic cash crops like sugar and organic tea is increasing worldwide. China and India are the largest organic green and black tea producers, respectively. The growing international demand is expected to increase the organic acreages in the region.
Per capita spending on organic product predominant in Australia and China's organic food market growing significantly
- The per capita spending on organic products in the region was recorded at USD 85.1 in 2021. Australia witnessed a higher per capita spending on organic products, with USD 58.3 in the same year, attributed to the higher demand due to consumers' perception of organic food as healthy. As per the Global Organic Trade data, the organic packaged food and beverage market in Australia was valued at USD 885.2 million in 2021.
- China's organic food market grew by 13.3% in 2021, and the positive growth pattern is expected to continue, with a CAGR of 7.1% between 2023 and 2029. With an increasing emphasis on the importance of organic products among the younger generation and the rising demand for organic baby food due to the growing number of mothers in the workforce and the increasing adoption of the health and wellness trend, organic products are expected to reach a value of USD 6.4 billion by 2025.
- Organic products in India represent far less than 1.0% of global demand, with a per capita expenditure of just USD 0.08 in 2021. However, the Indian market may grow over the coming years, reaching a value of USD 153.3 million by 2025. Currently, the region's organic goods market is highly fragmented, with just a few supermarkets and specialty stores selling them, as people from higher-income families are the only potential customers. Growing consumer knowledge and changing buying patterns may lead to a better understanding of organic food sustainability in the region. Increasing per capita income and increased consumer awareness of the importance of organic food can raise per capita expenditure on organic food items in the Asia-Pacific region.
Asia-Pacific Biocontrol Agents Industry Overview
The Asia-Pacific Biocontrol Agents Market is fragmented, with the top five companies occupying 2.52%. The major players in this market are Biobest Group NV, Koppert Biological Systems Inc., Samriddhi Crops India Pvt Ltd, Sonkul Agro Industries and T.Stanes and Company Limited (sorted alphabetically).
Additional Benefits:
- The market estimate (ME) sheet in Excel format
- 3 months of analyst support
TABLE OF CONTENTS
1 EXECUTIVE SUMMARY & KEY FINDINGS
2 REPORT OFFERS
3 INTRODUCTION
- 3.1 Study Assumptions & Market Definition
- 3.2 Scope of the Study
- 3.3 Research Methodology
4 KEY INDUSTRY TRENDS
- 4.1 Area Under Organic Cultivation
- 4.2 Per Capita Spending On Organic Products
- 4.3 Regulatory Framework
- 4.3.1 Australia
- 4.3.2 China
- 4.3.3 India
- 4.3.4 Indonesia
- 4.3.5 Japan
- 4.3.6 Philippines
- 4.3.7 Thailand
- 4.3.8 Vietnam
- 4.4 Value Chain & Distribution Channel Analysis
5 MARKET SEGMENTATION (includes market size in Value in USD and Volume, Forecasts up to 2030 and analysis of growth prospects)
- 5.1 Form
- 5.1.1 Macrobials
- 5.1.1.1 By Organism
- 5.1.1.1.1 Entamopathogenic Nematodes
- 5.1.1.1.2 Parasitoids
- 5.1.1.1.3 Predators
- 5.1.2 Microbials
- 5.1.2.1 By Organism
- 5.1.2.1.1 Bacterial Biocontrol Agents
- 5.1.2.1.2 Fungal Biocontrol Agents
- 5.1.2.1.3 Other Microbials
- 5.1.1 Macrobials
- 5.2 Crop Type
- 5.2.1 Cash Crops
- 5.2.2 Horticultural Crops
- 5.2.3 Row Crops
- 5.3 Country
- 5.3.1 Australia
- 5.3.2 China
- 5.3.3 India
- 5.3.4 Indonesia
- 5.3.5 Japan
- 5.3.6 Philippines
- 5.3.7 Thailand
- 5.3.8 Vietnam
- 5.3.9 Rest of Asia-Pacific
6 COMPETITIVE LANDSCAPE
- 6.1 Key Strategic Moves
- 6.2 Market Share Analysis
- 6.3 Company Landscape
- 6.4 Company Profiles (includes Global Level Overview, Market Level Overview, Core Business Segments, Financials, Headcount, Key Information, Market Rank, Market Share, Products and Services, and Analysis of Recent Developments).
- 6.4.1 Andermatt Group AG
- 6.4.2 Biobest Group NV
- 6.4.3 Henan Jiyuan Baiyun Industry Co. Ltd
- 6.4.4 KN Bio Sciences India Pvt. Ltd
- 6.4.5 Koppert Biological Systems Inc.
- 6.4.6 Samriddhi Crops India Pvt Ltd
- 6.4.7 Sonkul Agro Industries
- 6.4.8 T.Stanes and Company Limited
7 KEY STRATEGIC QUESTIONS FOR AGRICULTURAL BIOLOGICALS CEOS
8 APPENDIX
- 8.1 Global Overview
- 8.1.1 Overview
- 8.1.2 Porter's Five Forces Framework
- 8.1.3 Global Value Chain Analysis
- 8.1.4 Market Dynamics (DROs)
- 8.2 Sources & References
- 8.3 List of Tables & Figures
- 8.4 Primary Insights
- 8.5 Data Pack
- 8.6 Glossary of Terms
 生物防治剂市场-2026-2031年预测
 全球生物防治剂市场
 生物防治剂市场机会、成长动力、产业趋势分析及 2025 - 2034 年预测
 生物防治剂市场按类型、施用方法、剂型、作物类型、施用方式及地区划分
 中国生物防治剂市场:份额分析、产业趋势与统计、成长预测(2025-2030)北美生物防治剂:市场占有率分析、产业趋势、统计数据、成长预测(2025-2030 年)印度生物防治剂:市场占有率分析、产业趋势与统计、成长预测(2025-2030)欧洲生物防治剂:市场占有率分析、产业趋势与统计、成长预测(2025-2030)美国生物防治剂:市场占有率分析、产业趋势、统计数据、成长预测(2025-2030 年)
 生物防治剂市场:2033年市场分析与预测 - 依类型、产品、应用、技术、最终用户、形式、组件、模式、阶段和服务