


 |
市场调查报告书
商品编码
1848087
储能:市场占有率分析、产业趋势、统计数据和成长预测(2025-2030 年)Energy Storage - Market Share Analysis, Industry Trends & Statistics, Growth Forecasts (2025 - 2030) |
||||||
※ 本网页内容可能与最新版本有所差异。详细情况请与我们联繫。
预计到 2025 年,储能市场规模将达到 2,950 亿美元,到 2030 年将达到 4,650 亿美元,预测期(2025-2030 年)的复合年增长率为 9.53%。
电池组价格下降、政策奖励鼓励独立储能以及随着太阳能和风能发电组合的扩大,对灵活容量的需求日益增长,这些因素共同推动了储能规模的扩大。磷酸铁锂(LFP)技术成本的快速下降、向六小时以上续航时间的电池能源储存系统(BESS)的转变以及交通运输电气化的加速,都进一步巩固了当前的成长动能。竞争格局同样瞬息万变:中国供应商追求成本领先和全球合同,而北美和欧洲的系统整合商则更注重软体、电网形成控制和安全合规性。在那些重视多小时调度能力和低生命週期成本的市场中,热电池、重力电池和液流电池等长寿命技术正开始与锂离子电池形成互补。
全球储能市场趋势与洞察
磷酸铁锂电池成本的快速下降将推动电池续航时间达到6小时或更长的储能係统(BESS)的普及。
2024年,磷酸铁锂电池(LFP)价格将创历史新低,仅115美元/度数,使其稳固确立了长寿命电池储能係统(BESS)的核心地位。预计到2024年,磷酸铁锂电池的装置份额将达到88%,其安全性优势降低了授权和保险门槛,并允许电力公司用放电时间长达10小时的电池储能係统取代燃气储能係统。中国的过剩供应正在增强买方的影响力,并加速美国和欧洲的吉瓦级采购。
电网级奖励机制加速市场转型
美国《通货膨胀与復苏法案》(IRA)的投资税额扣抵使得2024年新增电池储能容量达到11.9吉瓦,预计2025年将新增18.2吉瓦。欧盟的《可再生能源指令III》也带来了类似的推动力,该指令要求提高再生能源的渗透率;此外,中国的长期储能目标也在推动液流电池技术的创新。公共津贴,例如加州能源委员会提供的2.7亿美元长期试点项目,正在弥合实验室规模与商业规模之间的差距。
适宜水库选址的匮乏限制了抽水蓄能发电的发展。
目前,抽水蓄能电站全球储电量约为9,000吉瓦时,但在欧洲、日本及北美部分地区,新建待开发区的前景十分渺茫。授权可能需要八年甚至更长时间,这削弱了该技术的成本优势。利用废弃封闭式的闭环系统(例如Energy Vault公司的撒丁岛计划)和重力系统旨在保留长期运作的可能性,但尚未在同等规模上得到验证。
细分市场分析
预计到2024年,电池系统将占据490亿美元的储能市场,并在2030年之前以16.5%的复合年增长率成长。价格低于115美元/千瓦时的磷酸铁锂电池组能够实现8小时的调度,使其在日间套利週期中与传统的抽水蓄能係统竞争。同时,由于水库用地短缺、授权週期长以及环境限制等因素,欧洲和日本的新计画停滞不前,预计到2024年,抽水蓄能係统的市场份额将下降至84%。
在需要数天甚至数週储能的场景下,热电池、重力电池和液流电池正获得越来越多的支援。铁空气电池技术近期获得了4.05亿美元的资金筹措,预计将实现100小时的放电窗口;而锌溴液流电池和钒液流电池则规避了锂供应风险。混合拓扑结构允许重力储能或压缩空气储能模组提供基本负载放电,同时电池在电网故障发生后的最初几分钟内提供辅助设备服务。
储能市场报告按技术(电池、抽水蓄能、热能储存、压缩空气储能、液态空气/低温储存、飞轮储能等)、连接类型(併网和离网)、应用(电网级公用事业、住宅用户侧储能等)和地区(北美、欧洲、亚太、南美以及中东和非洲)进行细分。
区域分析
亚太地区将在2024年占全球销售额的43%,是供应链规模化发展的核心。光是中国一国,2024年就将新增81吉瓦时储能容量,超过世界其他地区的总合,这主要得益于其2025年可再生能源占比达到33%的目标。澳洲在住宅储能部署方面处于领先地位,屋顶太阳能的高渗透率和浮动收费系统加速了配套储能电池的投资回报。印度将于2025年安装其首个独立公用事业储能係统,这标誌着混合可再生能源园区采购週期的开始。
北美是成长最快的地区,预计到2030年将以14.5%的复合年增长率成长。 IRA对独立储能的直接奖励降低了以往太阳能併网的要求,从而释放了主要集中在加利福尼亚州和德克萨斯的吉瓦级储能项目。美国能源资讯署(EIA)预测,到2025年,电池储能将占新增发电量的18.2吉瓦,仅次于太阳能光电发电。区域趋势强调在极端天气事件导致的停电后增强电力系统的恢復能力,这进一步推动了对微电网和社区储能方案的需求。
预计到2023年,欧洲发电装置容量将年增94%,达到1,720万千瓦时。德国运作,这得益于其高昂的零售价格和简化的授权,预计到2024年底,将有1.9吉瓦时的大型系统投入运作。英国和法国虽然落后,但也有数百吉瓦的装置容量正在筹建中,这得益于容量市场收入和电网平衡服务。从住宅用电向公用事业规模的转变也体现在道达尔能源公司(TotalEnergies)位于德国的新建100兆瓦/200兆瓦时电站项目中,该项目将太阳能光伏发电与两小时的储能係统相结合,用于白天的电力平滑。
其他福利:
- Excel格式的市场预测(ME)表
- 3个月的分析师支持
目录
第一章 引言
- 研究假设和市场定义
- 调查范围
第二章调查方法
第三章执行摘要
第四章 市场情势
- 市场概览
- 市场驱动因素
- 磷酸铁锂电池成本的快速下降将推动续航时间超过6小时的储能係统(BESS)在亚太地区的普及。
- 电网级奖励机制(美国IRA、欧盟RED III、中国长期义务)
- 海湾合作委员会可再生能源併网目标强制要求,促进火力发电和压缩空气储能的发展。
- 资料中心电源品质需求 飞轮和储能係统(北美,北欧)
- 需要固定储能设施的电动车充电走廊建设计画
- 企业购电协议的快速成长推动了用户侧储能的发展(欧盟、澳洲)
- 市场限制
- 缺乏合适的蓄水库选址限制了抽水蓄能发电的新建(欧盟、日本)
- 钒/锌电解供应不稳定阻碍了液流电池的规模化生产。
- 严格的消防规范(NFPA 855、IEC 62933)推动了都市区对储能係统(BESS)的投资。
- 新兴市场收入累积的不确定性
- 供应链分析
- 政府政策和法规
- 技术展望
- 储能价格趋势及预测
- 装置容量和渗透率分析
- 五力分析
- 供应商的议价能力
- 买方的议价能力
- 新进入者的威胁
- 替代品的威胁
- 竞争对手之间的竞争强度
第五章 市场规模与成长预测
- 透过技术
- 电池(锂离子电池、固体锂电池、钠离子电池、铅酸电池、钠硫电池、液流电池(钒电池、溴化锌电池))
- 抽水蓄能发电
- 热能储存(显热(熔盐、水)、潜热(相变材料)、热化学)
- 压缩空气储能
- 液态空气/低温存储
- 飞轮储能
- 重力储能
- 利用氢能进行能量储存(电能转换为氢能)
- 其他新兴技术(铁空气复合技术、锌空气复合技术)
- 连结性别
- 併网
- 离网
- 透过使用
- 网格尺度公用事业(电錶正面)
- 住宅电錶后端
- 商业和工业用电錶后端
- 资料中心和关键设施
- 偏远地区及离网/微电网
- 其他(交通/铁路电气化、电动车充电基础设施、电力传输和分配的延期)
- 按地区
- 北美洲
- 美国
- 加拿大
- 墨西哥
- 欧洲
- 英国
- 德国
- 法国
- 西班牙
- 北欧国家
- 俄罗斯
- 其他欧洲
- 亚太地区
- 中国
- 印度
- 日本
- 韩国
- 东南亚国协
- 亚太其他地区
- 南美洲
- 巴西
- 阿根廷
- 哥伦比亚
- 其他南美洲
- 中东和非洲
- 阿拉伯聯合大公国
- 沙乌地阿拉伯
- 南非
- 埃及
- 其他中东和非洲地区
- 北美洲
第六章 竞争情势
- 市场集中度
- 策略性倡议(併购、伙伴关係、购电协议)
- 市场占有率分析(主要企业的市场排名/份额)
- 公司简介
- Contemporary Amperex Technology Co. Ltd.(CATL)
- LG Energy Solution Ltd.
- Tesla Inc.
- BYD Co. Ltd.
- Fluence Energy Inc.
- Wartsila Energy
- Siemens Gamesa Renewable Energy
- GS Yuasa Corporation
- NGK Insulators Ltd.
- Samsung SDI Co. Ltd.
- General Electric(Vernova)
- ABB Ltd.
- Hitachi Energy Ltd.
- Eaton Corporation
- Mitsubishi Power Americas|
- AES Corporation
- Voith Hydro GmbH
- ANDRITZ AG
- Hydrostor Inc.
- Highview Powe
- Amber Kinetics Inc
第七章 市场机会与未来展望
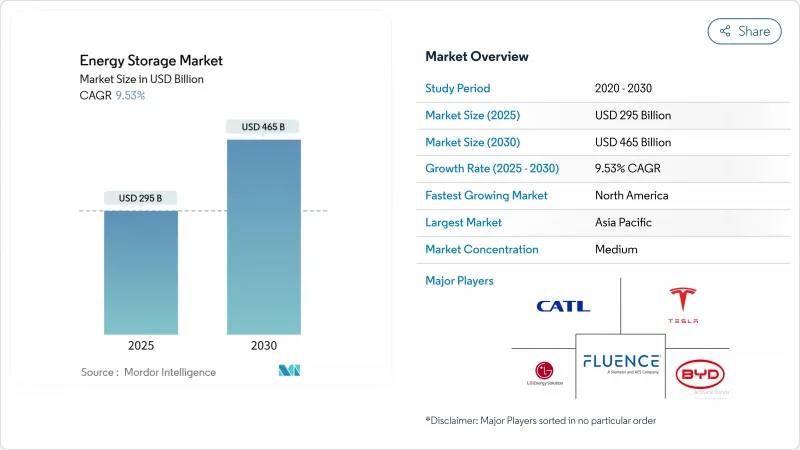
The Energy Storage Market size is estimated at USD 295 billion in 2025, and is expected to reach USD 465 billion by 2030, at a CAGR of 9.53% during the forecast period (2025-2030).
This scale-up rests on falling battery pack prices, policy incentives that reward standalone storage, and a rising need for flexible capacity as solar and wind portfolios expand. Rapid cost declines in lithium-iron-phosphate (LFP) technology, the pivot to >6-hour battery energy storage systems (BESS), and the accelerating electrification of transport all reinforce the current growth trajectory. Competitive dynamics are equally fluid: Chinese suppliers are pursuing cost leadership and global contracts, while North American and European integrators emphasize software, grid-forming controls, and safety compliance. Longer-duration technologies-thermal, gravity, and flow batteries-are beginning to complement lithium-ion in markets that prize multi-hour dispatchability and low lifetime cost.
Global Energy Storage Market Trends and Insights
Rapid LFP Battery Cost Declines Driving >6-Hour BESS Adoption
Record lows of USD 115/kWh in 2024 firmly repositioned LFP as the anchor chemistry for long-duration BESS. With 88% share of 2024 installations, the chemistry's safety profile is easing permitting and insurance barriers while enabling utilities to displace gas peakers for up to 10 hours of discharge. Chinese oversupply is reinforcing buyer leverage, accelerating multigigawatt procurement rounds in the United States and Europe.
Grid-Scale Incentive Schemes Accelerating Market Transformation
Investment tax credits under the U.S. Inflation Reduction Act (IRA) unlocked 11.9 GW of storage additions in 2024 and a pipeline of 18.2 GW for 2025. Similar momentum stems from the EU Renewable Energy Directive III, which mandates higher renewables penetration, and China's long-duration storage targets that foster flow-battery innovation. Public grants, such as the California Energy Commission's USD 270 million program for long-duration pilots, are bridging the gap between lab and commercial scale.
Scarcity of Suitable Reservoir Sites Limiting New Pumped Hydro
Although pumped hydro still stores about 9,000 GWh worldwide, greenfield prospects are scarce in Europe, Japan, and parts of North America. Permitting can exceed 8 years, eroding the technology's cost advantage. Closed-loop concepts and gravity systems repurposing disused mine shafts, such as Energy Vault's Sardinia project, aim to keep long-duration options alive but remain unproven at comparable scale.
Other drivers and restraints analyzed in the detailed report include:
- Mandatory GCC Renewable-Integration Targets Boosting Thermal & CAES
- Data-Center Power-Quality Demands Spurring Flywheel & BESS
- Fire Safety Regulations Increasing Urban Storage Costs
For complete list of drivers and restraints, kindly check the Table Of Contents.
Segment Analysis
Battery systems delivered USD 49 billion of the energy storage market size in 2024 and are forecast to expand at a 16.5% CAGR through 2030. LFP packs under USD 115/kWh are allowing 8-hour dispatch to compete with conventional pumped hydro for daily arbitrage cycles. Meanwhile, the energy storage market share of pumped-storage hydroelectricity slipped to 84% in 2024 as reservoir-site scarcity, long permitting cycles, and environmental constraints stalled new projects in Europe and Japan.
Thermal, gravity, and flow batteries are gaining traction where multi-day or week-long storage is desired. Iron-air technology, backed by USD 405 million of recent funding, promises 100-hour discharge windows, while zinc-bromine and vanadium flow stacks avoid lithium supply risks. Hybrid topologies are proliferating: gravity or CAES modules supply baseload discharge while batteries handle ancillary services in the first minutes after a grid event.
The Energy Storage Market Report is Segmented by Technology (Batteries, Pumped-Storage Hydroelectricity, Thermal Energy Storage, Compressed Air Energy Storage, Liquid Air/Cryogenic Storage, Flywheel Energy Storage, and Others), Connectivity (On-Grid and Off-Grid), Application (Grid-Scale Utility, Residential Behind-The-Meter, and Others), and Geography (North America, Europe, Asia-Pacific, South America, and Middle East and Africa)
Geography Analysis
Asia-Pacific retained 43% of 2024 revenue and is central to supply-chain scale-up. China alone installed 81 GWh in 2024-more than the rest of the world combined-bolstered by its 33% renewable-energy share target for 2025. Australia leads residential adoption as high rooftop-solar penetration and volatile tariffs accelerate payback for paired batteries. India's first stand-alone utility BESS in 2025 signals an emerging procurement cycle aimed at hybrid renewable parks.
North America is the fastest-growing region at a projected 14.5% CAGR through 2030. The IRA's direct incentive for stand-alone storage flattened the previous solar-coupling requirement, unleashing gigawatt-scale pipelines centered in California and Texas. The U.S. Energy Information Administration expects batteries to supply 18.2 GW of new utility-scale capacity in 2025, second only to solar additions. Regional focus on resilience after extreme-weather outages further reinforces demand for microgrids and community-storage schemes.
Europe recorded a 94% y-o-y capacity jump in 2023, reaching 17.2 GWh. Germany dominates with 1.9 GWh of large-scale systems in operation by late-2024, aided by high retail prices and streamlined permitting. The United Kingdom and France trail but have multigigawatt pipelines backed by capacity-market revenue and grid-balancing services. The continent's shift from residential to utility-scale projects is evident in TotalEnergies' new 100 MW/200 MWh German site that pairs solar with two-hour storage for intraday smoothing.
- Contemporary Amperex Technology Co. Ltd. (CATL)
- LG Energy Solution Ltd.
- Tesla Inc.
- BYD Co. Ltd.
- Fluence Energy Inc.
- Wartsila Energy
- Siemens Gamesa Renewable Energy
- GS Yuasa Corporation
- NGK Insulators Ltd.
- Samsung SDI Co. Ltd.
- General Electric (Vernova)
- ABB Ltd.
- Hitachi Energy Ltd.
- Eaton Corporation
- Mitsubishi Power Americas |
- AES Corporation
- Voith Hydro GmbH
- ANDRITZ AG
- Hydrostor Inc.
- Highview Powe
- Amber Kinetics Inc
Additional Benefits:
- The market estimate (ME) sheet in Excel format
- 3 months of analyst support
TABLE OF CONTENTS
1 Introduction
- 1.1 Study Assumptions & Market Definition
- 1.2 Scope of the Report
2 Research Methodology
3 Executive Summary
4 Market Landscape
- 4.1 Market Overview
- 4.2 Market Drivers
- 4.2.1 Rapid LFP Battery Cost Declines Driving >6-Hour BESS Adoption (Asia-Pacific
- 4.2.2 Grid-Scale Incentive Schemes (IRA-US, EU RED III, China Long-Duration Mandate
- 4.2.3 Mandatory GCC Renewable-Integration Targets Boosting Thermal & CAES
- 4.2.4 Data-Center Power-Quality Demands Spurring Flywheel & BESS (NA, Nordics)
- 4.2.5 EV-Charging Corridor Build-outs Requiring Stationary Storage
- 4.2.6 Corporate PPA Surge Triggering Behind-the-Meter Storage (EU, AUS)
- 4.3 Market Restraints
- 4.3.1 Scarcity of Suitable Reservoir Sites Limiting New Pumped Hydro (EU, JP)
- 4.3.2 Vanadium/Zinc Electrolyte Supply Volatility Hindering Flow-Battery Scale-up
- 4.3.3 Stringent Fire Codes (NFPA 855, IEC 62933) Raising Urban BESS CAPEX
- 4.3.4 Revenue-Stacking Uncertainty in Emerging Markets
- 4.4 Supply-Chain Analysis
- 4.5 Government Policies & Regulations
- 4.6 Technological Outlook
- 4.7 Energy Storage Price Trends & Forecast
- 4.8 Installed Capacity & Deployment Analysis
- 4.9 Porter's Five Forces
- 4.9.1 Bargaining Power of Suppliers
- 4.9.2 Bargaining Power of Buyers
- 4.9.3 Threat of New Entrants
- 4.9.4 Threat of Substitutes
- 4.9.5 Intensity of Competitive Rivalry
5 Market Size & Growth Forecasts
- 5.1 By Technology
- 5.1.1 Batteries (Lithium-ion, Solid-State Li, Sodium-ion, Lead-acid, Sodium-Sulfur, and Flow Batteries (Vanadium, Zinc-Bromine))
- 5.1.2 Pumped-Storage Hydroelectricity
- 5.1.3 Thermal Energy Storage (Sensible Heat (Molten Salt, Water), Latent Heat (Phase-Change Materials), Thermochemical)
- 5.1.4 Compressed Air Energy Storage
- 5.1.5 Liquid Air/Cryogenic Storage
- 5.1.6 Flywheel Energy Storage
- 5.1.7 Gravity-Based Storage
- 5.1.8 Hydrogen-Based Storage (Power-to-H2-to-Power)
- 5.1.9 Other Emerging Technologies (Iron-Air, Zinc-Air)
- 5.2 By Connectivity
- 5.2.1 On-Grid
- 5.2.2 Off-Grid
- 5.3 By Application
- 5.3.1 Grid-Scale Utility (Front-of-Meter)
- 5.3.2 Residential Behind-the-Meter
- 5.3.3 Commercial and Industrial Behind-the-Meter
- 5.3.4 Data Centers and Critical Facilities
- 5.3.5 Remote and Off-Grid/Microgrids
- 5.3.6 Others (Transportation and Rail Electrification, EV-Charging Infrastructure, Transmission and Distribution Deferral)
- 5.4 By Geography
- 5.4.1 North America
- 5.4.1.1 United States
- 5.4.1.2 Canada
- 5.4.1.3 Mexico
- 5.4.2 Europe
- 5.4.2.1 United Kingdom
- 5.4.2.2 Germany
- 5.4.2.3 France
- 5.4.2.4 Spain
- 5.4.2.5 Nordic Countries
- 5.4.2.6 Russia
- 5.4.2.7 Rest of Europe
- 5.4.3 Asia-Pacific
- 5.4.3.1 China
- 5.4.3.2 India
- 5.4.3.3 Japan
- 5.4.3.4 South Korea
- 5.4.3.5 ASEAN Countries
- 5.4.3.6 Rest of Asia-Pacific
- 5.4.4 South America
- 5.4.4.1 Brazil
- 5.4.4.2 Argentina
- 5.4.4.3 Colombia
- 5.4.4.4 Rest of South America
- 5.4.5 Middle East and Africa
- 5.4.5.1 United Arab Emirates
- 5.4.5.2 Saudi Arabia
- 5.4.5.3 South Africa
- 5.4.5.4 Egypt
- 5.4.5.5 Rest of Middle East and Africa
- 5.4.1 North America
6 Competitive Landscape
- 6.1 Market Concentration
- 6.2 Strategic Moves (M&A, Partnerships, PPAs)
- 6.3 Market Share Analysis (Market Rank/Share for key companies)
- 6.4 Company Profiles (includes Global level Overview, Market level overview, Core Segments, Financials as available, Strategic Information, Products & Services, and Recent Developments)
- 6.4.1 Contemporary Amperex Technology Co. Ltd. (CATL)
- 6.4.2 LG Energy Solution Ltd.
- 6.4.3 Tesla Inc.
- 6.4.4 BYD Co. Ltd.
- 6.4.5 Fluence Energy Inc.
- 6.4.6 Wartsila Energy
- 6.4.7 Siemens Gamesa Renewable Energy
- 6.4.8 GS Yuasa Corporation
- 6.4.9 NGK Insulators Ltd.
- 6.4.10 Samsung SDI Co. Ltd.
- 6.4.11 General Electric (Vernova)
- 6.4.12 ABB Ltd.
- 6.4.13 Hitachi Energy Ltd.
- 6.4.14 Eaton Corporation
- 6.4.15 Mitsubishi Power Americas |
- 6.4.16 AES Corporation
- 6.4.17 Voith Hydro GmbH
- 6.4.18 ANDRITZ AG
- 6.4.19 Hydrostor Inc.
- 6.4.20 Highview Powe
- 6.4.21 Amber Kinetics Inc
7 Market Opportunities & Future Outlook
- 7.1 White-space & Unmet-Need Assessment
 储能电感器市场按产品类型、磁芯材料、电路类型、绕组类型、输入电压、端子、应用和终端用户-全球预测,2026-2032年
 可再生能源併网电力电子元件,全球市场预测至2034年:按元件类型、应用、最终用户和地区划分
 无电池化催生巨大的新市场:2026-2046
 2026年全球人工智慧(AI)储能解决方案市场报告2026年全球可再生能源储存市场报告
 储能市场-全球产业规模、份额、趋势、机会和预测:按技术、类型、最终用户、地区和竞争格局划分,2021-2031年
 全球焊锡助焊剂市场:依产品类型、应用/焊接工艺、形态和最终用途行业划分 - 市场规模、行业动态、机会分析和预测(2026-2035 年)
 公用事业规模太阳能发电市场-2026-2031年预测全球先进氟化学品市场预测(至2032年):按产品类型、应用、最终用户和地区划分可再生能源电力电子市场预测至2032年:按组件、再生能源来源、材料类型、最终用户和地区分類的全球分析