


 |
市场调查报告书
商品编码
1849829
水耕法:市场占有率分析、产业趋势、统计数据和成长预测(2025-2030 年)Hydroponics - Market Share Analysis, Industry Trends & Statistics, Growth Forecasts (2025 - 2030) |
||||||
※ 本网页内容可能与最新版本有所差异。详细情况请与我们联繫。
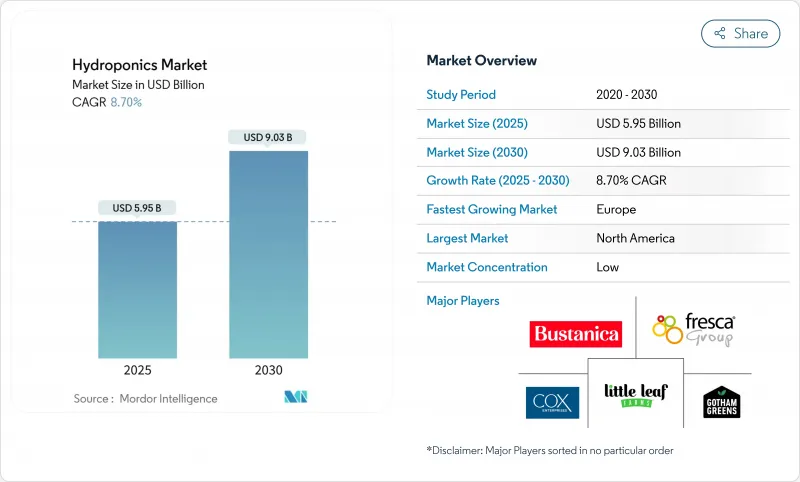
预计到 2025 年,水耕市场规模将达到 59.5 亿美元,到 2030 年将达到 90.3 亿美元,预测期(2025-2030 年)复合年增长率为 8.7%。
这种上升趋势是由不断增长的城市人口、企业永续性要求以及快速发展的可控环境技术的共同推动的。虽然目前密集型种植系统因其操作简单而占据主导地位,但随着经营者寻求更高的资源效率,液态种植系统正在迅速扩张。主要企业正在整合人工智慧驱动的水耕程序,以提高产量并降低营运成本,而LED价格的下降也使得全年生产更具经济效益。儘管能源消耗的成长仍然令人担忧,但照明效率的提高和现场可再生能源的普及正在降低企业受电价波动的影响。
全球水耕市场趋势与洞察
每平方公尺产量高,用水量低
水耕农业系统因其平方公尺产量可提高至多11倍,同时节水80%至90%,而对干旱或人口密集的城市环境极具吸引力。像摩天大楼农场这样的垂直农场几乎可以循环利用所有灌溉用水,与传统农地相比,节水消费量高达95%至99%。伊甸园绿色科技公司位于德克萨斯州的工厂仅占地6.2万平方英尺,每年即可生产34万株植物,检验了可控环境农业如何将边际土地转化为可靠的食物来源。不断上涨的市政水费进一步提升了水耕技术的市场提案,因为节省的每一公升水都直接转化为营运成本的降低。城市负责人在核准城市中心的新农场时,优先考虑用水效率,加快审批流程,并在土地资源有限的大都会圈进行建设。这一趋势在中东和亚洲的特大城市尤其明显,这些地区的地下水枯竭和对进口水的依赖促使政府推出政策支持闭合迴路农业。
城市人口迁移和对本地生产食品的需求
城市人口占全球总人口的56%以上,居民越来越倾向购买近距离种植的农产品,以确保新鲜度和可追溯性。新冠疫情期间,供应链衝击促使沃尔玛等零售商与本地垂直农业供应商共同投资,以保障货架供应。卡加利和休士顿等城市的地方政府项目正在将閒置的城市办公空间改造成全年开放的种植中心,这表明閒置的商业空间可以转化为食品工厂。年轻消费者愿意为不含农药的本地蔬菜支付15%至20%的溢价,这为提供订阅服务的城市农场创造了稳定的现金流。公共和私人津贴抵消了推出成本,使规模较小的经营者也能在以前通常用于零售或共享办公室的黄金地段获得租赁权。这些因素共同建构了一个稳定的都市区基本客群,从而支撑了更高的平均售价并减少了配送排放。
前期投资和较长的投资回收期
高昂的前期成本和漫长的投资回收期阻碍了水耕技术的商业性应用。典型的500平方公尺的初始农场需要1.5万至4万美元的投资,每月能源和营养液费用高达1300美元,这对融资紧张的创业家来说是一大障碍。能源成本占营运成本的50%之多,使得利润率极易受到电力市场现货价格上涨的影响。 2023年的市场动盪导致多家美国垂直农场破产,凸显了激进扩张速度远超融资的现状。 2023年初,室内农业的创业融资下降了91%,迫使企业将盈利置于成长之上。在许多新兴国家,两位数的利率加剧了投资回报的难度,儘管潜在需求旺盛,但市场渗透速度却十分缓慢。在主权财富基金补贴粮食安全基础设施的地区,大型商业计划得以推进,而小型生产商往往只能推迟投资,直到价格更低的承包套件出现。
细分市场分析
预计到2024年,整体式灌溉系统仍将占销售额的79.6%,显示从土壤种植过渡到无肥种植的种植者对土壤种植的熟悉程度感到满意。较低的资本投入和简单的系统操作是其持续占据主导地位的原因。然而,随着业者寻求对氧气供应和养分施用的更精准控制,液态灌溉系统预计到2030年将以12.6%的复合年增长率快速增长。与整体式灌溉系统相比,采用深水栽培(DWC)和营养液膜技术可使绿叶蔬菜产量提高30%至50%。闭合迴路设计还能实现径流液的近乎完全回收利用,这在水费不断上涨的地区是一项关键优势。
混合式方法也正在涌现。嵌入惰性基材中的感测器可自动触发液态营养液脉衝,将基质的根系稳定性与液态营养液精准输送结合。这种适应性符合企业ESG目标,并能提高投资报酬率。因此,随着水耕市场的成熟,预计会有更多种植者从静态基质升级到感测器引导的营养液膜系统。
区域分析
北美预计在2024年占据全球35.8%的销售额,这得益于成熟的基础设施、美国强有力的津贴以及充足的风险投资。在美国,随着医院、学校和企业园区建造内部农场以减少食品运输里程,商业水耕市场持续扩张。加拿大在可控环境种植方面的专业技术,得益于大麻合法化,正被应用于蔬菜生产,进一步增强了其技术排放。
预计欧洲将实现最快成长,到2030年复合年增长率将达到13.2%。欧盟的「从农场到餐桌」倡议提供了明确的政策支持,荷兰等国正在部署人工智慧驱动的感测器网络,以减少化学投入并提高产量。德国正在推动温室丛集与再生能源资产的协同发展,以降低营运成本并增加长期融资的机会。在西班牙,水耕生菜已获得主流市场的认可,凸显了消费者的接受度。
亚太地区蕴藏着巨大的未开发潜力。中国拥有60多家专业设备製造商,且地方政府的奖励政策鼓励在主要城市发展垂直农业。印度的新兴企业已经证明,与传统的土壤种植相比,垂直农业的产量可以提高40倍,这吸引了风险投资。在东南亚国家,粮食安全问题正获得法律支持,推动新计划的发展,但创业投资供应不稳定仍是规模化发展的一大障碍。随着该地区中产阶级的壮大和城市的扩张,随着技术成本的下降,水耕市场可能会向东转移。
其他福利:
- Excel格式的市场预测(ME)表
- 3个月的分析师支持
目录
第一章 引言
- 研究假设和市场定义
- 调查范围
第二章调查方法
第三章执行摘要
第四章 市场情势
- 市场概览
- 市场驱动因素
- 每平方公尺产量高,用水量低
- 城市人口变化和对本地生产食品的需求
- 减少LED技术的资本投入
- 强制企业从事ESG农业相关工作
- 利用人工智慧驱动的营养配比优化提高投资报酬率
- CEA农场碳信用货币化
- 市场限制
- 初始投资和较长的投资回收期
- 受控环境农业技能差距
- 加强含磷营养废弃物的管理规定
- 电网故障和能源价格波动的风险
- 监管环境
- 技术展望
- 五力分析
- 供应商的议价能力
- 买方的议价能力
- 新进入者的威胁
- 替代品的威胁
- 竞争对手之间的竞争
第五章 市场规模与成长预测
- 按类型
- 聚合系统
- 封闭式系统
- 开放系统
- 流体系统
- 聚合系统
- 按作物类型
- 番茄
- 生菜和绿叶蔬菜
- 胡椒
- 黄瓜
- 微型菜苗
- 其他作物(草莓、罗勒等)
- 按地区
- 北美洲
- 美国
- 加拿大
- 墨西哥
- 北美其他地区
- 欧洲
- 德国
- 英国
- 法国
- 西班牙
- 义大利
- 荷兰
- 其他欧洲地区
- 亚太地区
- 中国
- 日本
- 印度
- 澳洲
- 亚太其他地区
- 南美洲
- 巴西
- 阿根廷
- 其他南美洲
- 中东
- 沙乌地阿拉伯
- 阿拉伯聯合大公国
- 其他中东地区
- 非洲
- 南非
- 其他非洲地区
- 北美洲
第六章 竞争情势
- 市场集中度
- 策略趋势
- 市占率分析
- 公司简介
- GrowUp Farms
- BrightFarms(COX Enterprises, Inc)
- Pure Harvest Smart Farms
- Little Leaf Farms
- Thanet Earth(Fresca Group)
- Hydro Produce
- Emirates Hydroponics Farms
- Revol Greens
- Gotham Greens
- Nutrifresh India
- Badia Farms
- Sundrop Farms(Centuria Capital)
- Emirates Bustanica
- Sky Greens
第七章 市场机会与未来展望
The Hydroponics Market size is estimated at USD 5.95 billion in 2025 and is projected to reach USD 9.03 billion by 2030, at a CAGR of 8.7% during the forecast period (2025-2030).
This upward trajectory is propelled by the convergence of urban population growth, corporate sustainability mandates, and rapidly improving controlled-environment technologies. Aggregate growing systems currently dominate because they are simple to operate, but liquid systems are expanding more quickly as operators seek higher resource efficiency. Companies are integrating AI-driven nutrient routines to boost yields and cut operating costs, while falling LED prices are making year-round production economical. Rising energy use remains a concern; however, improvements in lighting efficiency and access to onsite renewables are lowering exposure to volatile power prices.
Global Hydroponics Market Trends and Insights
High-yield per square meter and lower water use
Hydroponic installations deliver up to 11-fold higher output per square meter while cutting water consumption by 80-90%, making them compelling for arid or densely built environments. Vertical farms such as Skyscraper Farm recycle nearly all irrigation water, demonstrating 95-99% savings compared with field agriculture. Eden Green Technology's Texas facility produces 340,000 plants annually on just 62,000 square feet, validating how controlled-environment agriculture turns marginal real estate into reliable food sources. Rising municipal water tariffs strengthen the hydroponics market value proposition as each liter of savings converts directly into lower operating costs. Urban planners highlight water efficiency when approving new inner-city farms, accelerating permit cycles, and build-outs in land-constrained metro areas. The trend is particularly acute in Middle Eastern and Asian megacities, where groundwater depletion and import dependency drive policy support for closed-loop farming.
Urban population shift and demand for local food
Cities account for over 56% of the world's population, and residents increasingly demand produce grown within a short radius to guarantee freshness and traceability. During the COVID-19 period, supply chain shocks pushed retailers such as Walmart to co-invest in regional vertical-farm suppliers to safeguard shelf continuity. Municipal programs convert under-utilized downtown offices into year-round grow hubs, as seen in Calgary and Houston, demonstrating how commercial vacancies can become food factories. Younger consumers willingly pay a 15-20% premium for pesticide-free local greens, creating predictable cash flow for urban farms serving subscription boxes. Public-private grants offset start-up costs, allowing small operators to secure leases in prime locations once reserved for retail or coworking ventures. Together, these factors underpin a steady urban customer base that supports higher average selling prices and reduces distribution emissions.
Up-front capex and long pay-back periods
High upfront costs and long payback periods hinder commercial hydroponics adoption. Typical 500 square meter starter farms require USD 15,000-40,000, while monthly energy and nutrient bills can reach USD 1,300, deterring cash-constrained entrepreneurs. Energy accounts for up to 50% of operating costs, exposing margins to spot-price spikes in liberalized power markets. The 2023 shakeout that pushed several U.S. vertical farms into bankruptcy highlighted how aggressive expansion outpaced cash flow. Venture funding for indoor agriculture slipped 91% during early 2023, forcing firms to prioritize profitability over growth. In many developing countries, double-digit interest rates exacerbate pay-back horizons, slowing hydroponics market penetration despite latent demand. Where sovereign wealth funds subsidize food security infrastructure, larger commercial projects move forward, and smaller growers often delay investments until cheaper turnkey kits emerge.
Other drivers and restraints analyzed in the detailed report include:
- Reduced capital expenditure for LED technology
- Corporate on-site ESG farming mandates
- Skills gap in controlled-environment agronomy
For complete list of drivers and restraints, kindly check the Table Of Contents.
Segment Analysis
Aggregate substrates continued to command 79.6% of revenue in 2024, illustrating how familiarity reassures growers shifting from soil to soilless cultivation. Their lower capital needs and simple mechanics underpin persistent dominance. Liquid systems, however, are accelerating at a 12.6% CAGR through 2030 as operators pursue finer control of oxygenation and nutrient dosing. Deep-water culture and nutrient film technique installations boost leafy-green yields by 30-50% compared with aggregate counterparts. Closed-loop designs also recycle nearly all solution runoff, an important differentiator where water tariffs are rising.
Hybrid approaches are emerging: sensors embedded in inert substrates automatically trigger liquid nutrient pulses, merging the root stability of aggregates with the precision of liquids. Such adaptability aligns with corporate ESG targets and elevates return on invested capital. Hence, more producers are expected to upgrade from static substrates to sensor-guided nutrient film lines as the hydroponics market matures.
The Hydroponics Market Report is Segmented by Type (Aggregate System and Liquid System), by Crop Type (Tomato, Lettuce and Leafy Greens, Pepper, Cucumber, and More), and by Geography (North America, Europe, Asia-Pacific, South America, Middle East, and Africa). The Market Forecasts are Provided in Terms of Value (USD).
Geography Analysis
North America secured 35.8% of global revenue in 2024 on the back of mature infrastructure, proactive USDA grants, and abundant venture financing. The hydroponics market size for U.S. commercial operations continues to swell as hospitals, schools, and corporate campuses build onsite farms to trim food-mile emissions. Canada's controlled-environment expertise, honed during cannabis legalization, is migrating into vegetable production and adding technical depth.
Europe promises the fastest climb with a 13.2% CAGR through 2030. The EU's Farm-to-Fork initiative supplies clear policy backing, while countries such as the Netherlands deploy AI-fueled sensor networks that cut chemical inputs and lift yields. Germany's push to co-locate greenhouse clusters with renewable power assets is lowering operating expenses and broadening access to long-term financing. Spain's mainstream acceptance of hydroponic lettuce highlights strong consumer readiness, a factor that accelerates supermarket partnerships.
Asia-Pacific presents a large untapped upside. China has more than 60 specialized equipment manufacturers, and provincial incentives encourage vertical farming in megacities. India's start-ups demonstrate 40-fold yield gains over soil plots, enticing additional venture capital. Food-security concerns in Southeast Asian nations are winning legislative support for new projects, although inconsistent power supply still complicates scaling. The region's rising middle class and urban footprint suggest the hydroponics market will pivot eastward as technological costs fall.
- GrowUp Farms
- BrightFarms (COX Enterprises, Inc)
- Pure Harvest Smart Farms
- Little Leaf Farms
- Thanet Earth (Fresca Group)
- Hydro Produce
- Emirates Hydroponics Farms
- Revol Greens
- Gotham Greens
- Nutrifresh India
- Badia Farms
- Sundrop Farms (Centuria Capital)
- Emirates Bustanica
- Sky Greens
Additional Benefits:
- The market estimate (ME) sheet in Excel format
- 3 months of analyst support
TABLE OF CONTENTS
1 Introduction
- 1.1 Study Assumptions and Market Definition
- 1.2 Scope of the Study
2 Research Methodology
3 Executive Summary
4 Market Landscape
- 4.1 Market Overview
- 4.2 Market Drivers
- 4.2.1 High-yield per square meter and lower water use
- 4.2.2 Urban population shift and demand for local food
- 4.2.3 Reduced capital expenditure for LED technology
- 4.2.4 Corporate on-site ESG farming mandates
- 4.2.5 AI nutrient-mix optimization boosting ROI
- 4.2.6 Carbon-credit monetization of CEA farms
- 4.3 Market Restraints
- 4.3.1 Up-front capex and long pay-back periods
- 4.3.2 Skills gap in controlled-environment agronomy
- 4.3.3 Rising P-based nutrient-waste regulations
- 4.3.4 Grid-outage risk and energy-price volatility
- 4.4 Regulatory Landscape
- 4.5 Technological Outlook
- 4.6 Porters Five Forces
- 4.6.1 Bargaining Power of Suppliers
- 4.6.2 Bargaining Power of Buyers
- 4.6.3 Threat of New Entrants
- 4.6.4 Threat from Substitutes
- 4.6.5 Intensity of Competitive Rivalry
5 Market Size and Growth Forecasts (Value, USD)
- 5.1 By Type
- 5.1.1 Aggregate System
- 5.1.1.1 Closed System
- 5.1.1.2 Open System
- 5.1.2 Liquid System
- 5.1.1 Aggregate System
- 5.2 By Crop Type
- 5.2.1 Tomato
- 5.2.2 Lettuce and Leafy Greens
- 5.2.3 Pepper
- 5.2.4 Cucumber
- 5.2.5 Micro-greens
- 5.2.6 Other Crops (Strawberry, Basil, etc.)
- 5.3 By Geography
- 5.3.1 North America
- 5.3.1.1 United States
- 5.3.1.2 Canada
- 5.3.1.3 Mexico
- 5.3.1.4 Rest of North America
- 5.3.2 Europe
- 5.3.2.1 Germany
- 5.3.2.2 United Kingdom
- 5.3.2.3 France
- 5.3.2.4 Spain
- 5.3.2.5 Italy
- 5.3.2.6 Netherlands
- 5.3.2.7 Rest of Europe
- 5.3.3 Asia-Pacific
- 5.3.3.1 China
- 5.3.3.2 Japan
- 5.3.3.3 India
- 5.3.3.4 Australia
- 5.3.3.5 Rest of Asia-Pacific
- 5.3.4 South America
- 5.3.4.1 Brazil
- 5.3.4.2 Argentina
- 5.3.4.3 Rest of South America
- 5.3.5 Middle East
- 5.3.5.1 Saudi Arabia
- 5.3.5.2 United Arab Emirates
- 5.3.5.3 Rest of Middle East
- 5.3.6 Africa
- 5.3.6.1 South Africa
- 5.3.6.2 Rest of Africa
- 5.3.1 North America
6 Competitive Landscape
- 6.1 Market Concentration
- 6.2 Strategic Moves
- 6.3 Market Share Analysis
- 6.4 Company Profiles (includes Global level Overview, Market level overview, Core Segments, Financials as available, Strategic Information, Market Rank/Share for key companies, Products and Services, and Recent Developments)
- 6.4.1 GrowUp Farms
- 6.4.2 BrightFarms (COX Enterprises, Inc)
- 6.4.3 Pure Harvest Smart Farms
- 6.4.4 Little Leaf Farms
- 6.4.5 Thanet Earth (Fresca Group)
- 6.4.6 Hydro Produce
- 6.4.7 Emirates Hydroponics Farms
- 6.4.8 Revol Greens
- 6.4.9 Gotham Greens
- 6.4.10 Nutrifresh India
- 6.4.11 Badia Farms
- 6.4.12 Sundrop Farms (Centuria Capital)
- 6.4.13 Emirates Bustanica
- 6.4.14 Sky Greens
7 Market Opportunities and Future Outlook
 2026年全球水耕市场报告
 合成无土栽培基质市场:依产品类型、作物类型、应用及通路划分-2026-2032年全球市场预测
 全球水耕栽培系统市场预测(至2032年):依系统类型、组件、结构类型、作物类型、技术、最终用户及地区划分全球水耕室内植物市场(按系统类型、通路、植物类型、最终用户和照明类型划分)预测(2026-2032年)
 日本水耕市场报告(按类型、作物类型、设备和地区划分,2026-2034年)
 水耕市场规模、份额和成长分析(按类型、作物类型、栽培方法、设备、面积和地区划分)-2026-2033年产业预测2025 年至 2033 年水耕市场规模、份额、趋势及预测(按类型、作物类型、设备及地区)
 水耕市场-全球产业规模、份额、趋势、机会及预测,依类型、设备、投入、耕作方式、作物类型、地区及竞争细分,2020-2030 年预测2032 年水耕市场预测:按类型、设备、投入、作物类型、作物面积、应用和地区分類的全球分析
 全球水耕市场:2025 年至 2030 年预测