


 |
市场调查报告书
商品编码
1849866
机器状态监测:市场占有率分析、产业趋势、统计数据和成长预测(2025-2030 年)Machine Condition Monitoring - Market Share Analysis, Industry Trends & Statistics, Growth Forecasts (2025 - 2030) |
||||||
※ 本网页内容可能与最新版本有所差异。详细情况请与我们联繫。
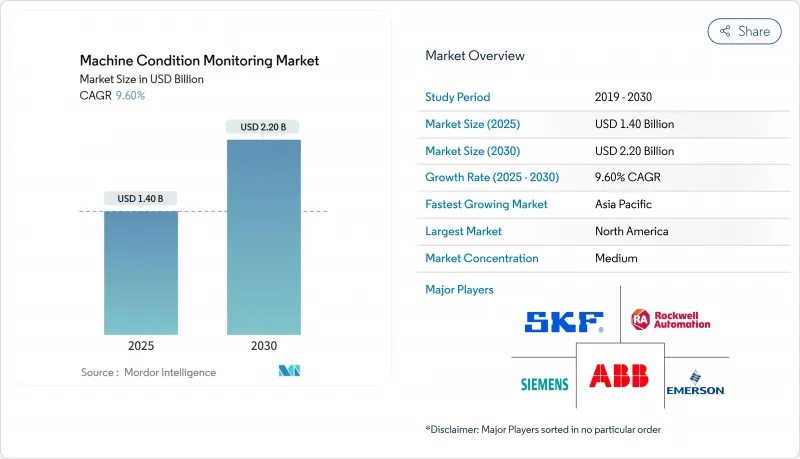
机器状态监测市场预计到 2025 年将达到 14 亿美元,到 2030 年将达到 22 亿美元,复合年增长率为 9.6%。
这一势头的推动力源于无线工业物联网感测器和人工智慧诊断平台的日益普及,这些平台缩短了决策週期。工业生产商面临劳动力限制和更高的执行时间目标,这推动了对自动故障检测系统的需求。无线感测器节点与边缘分析相结合,降低了整体拥有成本,并将覆盖范围扩大到先前未受监控的小型资产。永续性要求将进一步推动采用,因为持续的能源性能洞察有助于製造商满足排放揭露规则。竞争强度将保持适度,因为现有企业依赖其装置量的规模,而专注于人工智慧的参与企业则透过高级分析和软体即服务 (SaaS) 产品在价值上竞争。
全球机器状态监测市场趋势与洞察
强调预测性维护以减少非计划性停机时间
由于非计画停机每年对製造业造成500亿美元的损失,企业正在用预测性方法取代基于日历的维护,从而将停机时间减少20-50%,维护成本降低5-10%。机器学习演算法使用多感测器资料流提前数週识别故障,使团队能够在计划停机期间进行干预。在汽车工厂,宝马和特斯拉成功地利用即时分析来延长设备生命週期。数位双胞胎模型透过模拟磨损场景和优化零件采购来改进计划。
采用工业 4.0 边缘分析平台
边缘处理将分析功能转移到感测器节点,消除了延迟,同时在网路中断期间保持洞察。意法半导体将其微控制器定位于需要亚秒级检测的状态监控用例。西门子的 SIMOCODE M-CP 透过单对乙太网路将监控功能嵌入马达控制中心,从而减少了布线工作量,并将诊断功能扩展到小型马达。早期采用者报告称,其异常检测精度达到毫秒级,频宽节省高达 50%。
维修遗留棕地资产的成本
老旧设施通常缺乏感测器支架和网路主干,因此实施需要进行工程变更、获得安全核准,并分阶段停工,这些过程可能持续一年半以上。美国指出,相互衝突的遗留政策是采用「基于状态的维护升级版」的一大障碍,这与民用加工厂面临的类似困境如出一辙。无线设备减轻了布线的负担,但电源和危险区域认证仍然会推高预算,促使企业根据计划的关键程度分阶段实施。
細項分析
到2024年,硬体将占销售额的45%,凸显了感测器、闸道器和资料撷取单元在每个装置中所扮演的重要角色。这一细分市场受益于微机电系统的稳定发展,该系统在提高灵敏度的同时降低了功耗。西门子透过SIMOCODE M-CP将硬体与可授权的分析模组结合,简化了配电盘使用者的部署。斯凯孚与LKAB签订的价值6000万美元的合约将振动测量和远距离诊断整合到多年期协议中。
无线工业物联网感测器网路预计年增率为 12.4%,证实了客户对便利维修的偏好。随着部署的扩展,整合平台将原始资料流转换为维护工单,从而产生经常性的 SaaS 收入。这些因素为现有企业维持了规模经济,同时为分析订阅引入了新的利润池。
到2024年,振动分析将保持34.2%的份额,因为专业人员依赖丰富的旋转资产故障特征库,而设备製造商将加速计与采购捆绑销售,从而增强了网路效应。由于工厂注重早期轴承故障检测和压缩空气洩漏识别,即使在高噪音区域,超音波辐射预计将以每年11.8%的速度增长。
热成像技术的应用将日益广泛,人工智慧技术将在云端仪錶板上标记热异常,并藉助Teledyne FLIR与RealWear伙伴关係等穿戴式装置的整合。马达电流特征和油液分析将增强诊断信心,并完善涵盖电气和润滑系统的多模态套件。
区域分析
受严格的安全法规和工业4.0的早期部署支撑,北美地区将占2024年销售额的32.4%。美国美国)的排放报告和加州第253条法规正在推动企业持续进行效率测量。成熟的客户群将进一步推动边缘感测器的升级週期。
亚太地区年增率将达9.9%。中国和印度的智慧製造补贴将降低启动成本,日本感测器创新中心将在2024年IEEE感测器大会上展示其专业知识。电池、半导体和可再生能源设备工厂将迅速扩张,并将预测性维护纳入规划中。
欧洲正在利用 ESG 框架来证明投资的合理性,中东正在调整对石油和天然气大型企划的监控,而随着矿业公司将传送带车队数位化以及水力发电厂寻求提高可靠性,拉丁美洲正在实现新的成长。
其他福利:
- Excel 格式的市场预测 (ME) 表
- 3个月的分析师支持
目录
第一章 引言
- 研究假设和市场定义
- 调查范围
第二章调查方法
第三章执行摘要
第四章 市场状况
- 市场概况
- 市场驱动因素
- 专注于预测性维护以减少非计划性停机时间
- 推出工业 4.0 边缘分析平台
- 新兴亚洲资产密集型产业快速成长
- 无线工业物联网感测器大幅降低整体拥有成本
- 推动ESG主导的节能工厂运营
- 要求零容错的军事和太空计划(低调)
- 市场限制
- 棕地资产维修成本
- 振动分析专家短缺
- 始终在线系统的网路安全问题
- 不断上升的贸易壁垒正悄悄限制硬体供应链
- 价值/供应链分析
- 监管格局
- 技术展望
- 波特五力模型
- 新进入者的威胁
- 买方的议价能力
- 供应商的议价能力
- 替代品的威胁
- 竞争对手之间的竞争
第五章市场规模及成长预测
- 按报价
- 硬体
- 软体
- 服务
- 按监测方式
- 振动分析
- 热成像
- 超音波发射
- 润滑油分析
- 马达电流特征
- 腐蚀和磨损碎片
- 其他技术
- 按部署
- 线上/连续系统
- 可携式/定期仪器
- 无线工业物联网感测器网络
- 按最终用户产业
- 石油和天然气
- 发电
- 金属和采矿
- 化学/石化产品
- 汽车和运输
- 航太和国防
- 饮食
- 海洋
- 其他行业
- 按地区
- 北美洲
- 美国
- 加拿大
- 南美洲
- 巴西
- 阿根廷
- 欧洲
- 德国
- 英国
- 法国
- 俄罗斯
- 亚洲
- 中国
- 日本
- 印度
- 韩国
- 中东和非洲
- 中东
- 沙乌地阿拉伯
- 阿拉伯聯合大公国
- 非洲
- 南非
- 北美洲
第六章 竞争态势
- 市场集中度
- 策略趋势
- 市占率分析
- 公司简介
- SKF AB
- Emerson Electric Co.(Bently Nevada)
- Rockwell Automation Inc.
- ABB Ltd.
- Siemens AG
- Meggitt PLC
- Bruel and Kjaer Vibro
- Fluke Corporation
- FLIR Systems Inc.
- Parker Hannifin Corp.(Kittiwake)
- AMETEK Inc.(Spectro Scientific)
- Thermo Fisher Scientific Inc.
- Bentley Nevada(Baker Hughes)
- Schaeffler Group
- Azima DLI
- Honeywell International Inc.
- National Instruments Corp.
- Schneider Electric SE
- Gastops Ltd.
- Wilcoxon Sensing Technologies
第七章 市场机会与未来展望
The machine condition monitoring market reached a value of USD 1.4 billion in 2025 and is on course to attain USD 2.2 billion by 2030, reflecting a 9.6% CAGR.
The shift from reactive repair to data-driven predictive maintenance underpins this momentum, supported by rising wireless IIoT sensor deployments and AI-enabled diagnostics platforms that shorten decision cycles. Industrial producers face constrained workforces and escalating uptime targets, which heighten demand for automated fault-detection systems. Wireless sensor nodes paired with edge analytics reduce total cost of ownership and unlock coverage for smaller, previously unmonitored assets. Sustainability mandates further elevate adoption because continuous insight into energy performance helps manufacturers meet emissions disclosure rules. Competitive intensity remains moderate as incumbents rely on installed-base scale while AI-centric entrants contest value through advanced analytics and SaaS delivery.
Global Machine Condition Monitoring Market Trends and Insights
Predictive-maintenance focus to cut unplanned downtime
Manufacturing operations lose USD 50 billion each year to surprise stoppages, so firms are replacing calendar-based servicing with predictive approaches that trim downtime by 20-50% and maintenance spend by 5-10% . Machine-learning algorithms draw on multi-sensor data streams to pinpoint failures weeks ahead, letting teams intervene during scheduled pauses. Automotive plants show success as BMW and Tesla extend equipment life cycles using real-time analytics . Digital twin models refine schedules by simulating wear scenarios and optimizing parts procurement.
Adoption of industry 4.0 edge-analytics platforms
Edge processing moves analytics to the sensor node, eliminating latency while maintaining insight during network outages. STMicroelectronics positions its microcontrollers for condition monitoring use cases that require sub-second detection . Siemens' SIMOCODE M-CP embeds monitoring within motor control centers via Single Pair Ethernet, trimming wiring effort and extending diagnostics to smaller motors . Early adopters report millisecond-level anomaly detection and bandwidth cuts of up to 50%.
Retrofit cost for legacy brown-field assets
Older facilities rarely feature sensor mounts or network backbones, so rollout involves engineering changes, safety approvals, and staged shutdowns that can stretch over 18 months. The US Marine Corps flagged conflicting legacy policies as barriers during Condition Based Maintenance Plus adoption, echoing similar struggles in civilian process plants. Wireless devices ease wiring pain yet power delivery and hazardous-area certification still raise budgets, prompting firms to phase projects by criticality.
Other drivers and restraints analyzed in the detailed report include:
- Surging Asset-intensive sectors in emerging Asia
- Wireless IIoT sensors slashing total cost of ownership
- ESG-driven push for energy-efficient plant operations
- Shortage of vibration-analysis specialists
For complete list of drivers and restraints, kindly check the Table Of Contents.
Segment Analysis
Hardware claimed 45% of 2024 revenue, underscoring the indispensable role of sensors, gateways, and acquisition units in every installation. This segment benefits from steady advances in micro-electromechanical systems that boost sensitivity while lowering power draw. Siemens blended hardware with licensable analytics modules in its SIMOCODE M-CP to simplify adoption for switchboard users . Services revenue expands as manufacturers outsource round-the-clock surveillance; SKF's USD 60 million agreement with LKAB packages vibration measurements and remote diagnostics into a multi-year contract.
Wireless IIoT sensor networks are forecast to grow at 12.4% annually, underlining customer preference for low-touch retrofits. As adoption broadens, integrated platforms convert raw streams into maintenance tickets, creating recurring SaaS income. These factors collectively preserve scale benefits for incumbents while introducing fresh margin pools in analytics subscriptions.
Vibration analysis retained 34.2% share in 2024. Practitioners trust its rich fault signature library for rotating assets, and equipment makers bundle accelerometers at purchase, reinforcing network effects. Ultrasound emission is projected to expand 11.8% per year as plants value early bearing fault detection and compressed-air leak identification even in high-noise areas.
Thermography adoption rises with AI that flags thermal anomalies in cloud dashboards, aided by wearable integrations like the Teledyne FLIR and RealWear partnership. Motor current signature and oil analysis round out multi-modal suites that boost diagnostic confidence and extend reach into electrical and lubrication systems.
The Machine Condition Monitoring Market report segments the industry into Type (Hardware [Vibration Condition Monitoring Equipment, Thermography Equipment, and more], Software, Services), End User Industry (Oil and Gas, Power Generation, and more), and Geography (North America [United States, Canada], Europe [United Kingdom, Germany, France], Asia [China, Japan, India], and more).
Geography Analysis
North America held 32.4% of 2024 revenue, sustained by stringent safety codes and early Industry 4.0 rollouts. SEC emissions reporting and California SB 253 guide firms toward continuous efficiency measurement . Mature installed bases further encourage upgrade cycles to edge-capable sensors.
Asia-Pacific is poised for 9.9% annual growth. Smart-manufacturing subsidies in China and India defray upfront costs, while Japan's sensor innovation hub showcases domain expertise at IEEE SENSORS 2024 . Rapid expansion of battery, semiconductor, and renewable-equipment factories embeds predictive maintenance from conception.
Europe leverages ESG frameworks to justify investment, and the Middle East aligns monitoring with oil and gas mega-projects. Latin America records emerging growth as miners digitalize conveyor fleets and hydro plants seek reliability uplift.
- SKF AB
- Emerson Electric Co. (Bently Nevada)
- Rockwell Automation Inc.
- ABB Ltd.
- Siemens AG
- Meggitt PLC
- Bruel and Kjaer Vibro
- Fluke Corporation
- FLIR Systems Inc.
- Parker Hannifin Corp. (Kittiwake)
- AMETEK Inc. (Spectro Scientific)
- Thermo Fisher Scientific Inc.
- Bentley Nevada (Baker Hughes)
- Schaeffler Group
- Azima DLI
- Honeywell International Inc.
- National Instruments Corp.
- Schneider Electric SE
- Gastops Ltd.
- Wilcoxon Sensing Technologies
Additional Benefits:
- The market estimate (ME) sheet in Excel format
- 3 months of analyst support
TABLE OF CONTENTS
1 INTRODUCTION
- 1.1 Study Assumptions & Market Definition
- 1.2 Scope of the Study
2 RESEARCH METHODOLOGY
3 EXECUTIVE SUMMARY
4 MARKET LANDSCAPE
- 4.1 Market Overview
- 4.2 Market Drivers
- 4.2.1 Predictive-maintenance focus to cut unplanned downtime
- 4.2.2 Adoption of Industry 4.0 edge-analytics platforms
- 4.2.3 Surging asset-intensive sectors in emerging Asia
- 4.2.4 Wireless IIoT sensors slashing total cost of ownership
- 4.2.5 ESG-driven push for energy-efficient plant operations
- 4.2.6 Military & space programs requiring zero-fault tolerance (under-the-radar)
- 4.3 Market Restraints
- 4.3.1 Retrofit cost for legacy brown-field assets
- 4.3.2 Shortage of vibration-analysis specialists
- 4.3.3 Cyber-security concerns in always-connected systems
- 4.3.4 Rising trade barriers limiting hardware supply chains (under-the-radar)
- 4.4 Value / Supply-Chain Analysis
- 4.5 Regulatory Landscape
- 4.6 Technological Outlook
- 4.7 Porter's Five Forces
- 4.7.1 Threat of New Entrants
- 4.7.2 Bargaining Power of Buyers
- 4.7.3 Bargaining Power of Suppliers
- 4.7.4 Threat of Substitutes
- 4.7.5 Intensity of Competitive Rivalry
5 MARKET SIZE & GROWTH FORECASTS
- 5.1 By Offering
- 5.1.1 Hardware
- 5.1.2 Software
- 5.1.3 Services
- 5.2 By Monitoring Technique
- 5.2.1 Vibration Analysis
- 5.2.2 Thermography
- 5.2.3 Ultrasound Emission
- 5.2.4 Lubricating-Oil Analysis
- 5.2.5 Motor-Current Signature
- 5.2.6 Corrosion & Wear Debris
- 5.2.7 Other Techniques
- 5.3 By Deployment
- 5.3.1 Online/Continuous Systems
- 5.3.2 Portable/Periodic Instruments
- 5.3.3 Wireless IIoT Sensor Networks
- 5.4 By End-user Industry
- 5.4.1 Oil & Gas
- 5.4.2 Power Generation
- 5.4.3 Metals & Mining
- 5.4.4 Chemicals & Petrochemicals
- 5.4.5 Automotive & Transportation
- 5.4.6 Aerospace & Defense
- 5.4.7 Food & Beverage
- 5.4.8 Marine
- 5.4.9 Other Industries
- 5.5 By Geography
- 5.5.1 North America
- 5.5.1.1 United States
- 5.5.1.2 Canada
- 5.5.2 South America
- 5.5.2.1 Brazil
- 5.5.2.2 Argentina
- 5.5.3 Europe
- 5.5.3.1 Germany
- 5.5.3.2 United Kingdom
- 5.5.3.3 France
- 5.5.3.4 Russia
- 5.5.4 Asia
- 5.5.4.1 China
- 5.5.4.2 Japan
- 5.5.4.3 India
- 5.5.4.4 South Korea
- 5.5.5 Middle East & Africa
- 5.5.5.1 Middle East
- 5.5.5.1.1 Saudi Arabia
- 5.5.5.1.2 UAE
- 5.5.5.2 Africa
- 5.5.5.2.1 South Africa
- 5.5.1 North America
6 COMPETITIVE LANDSCAPE
- 6.1 Market Concentration
- 6.2 Strategic Moves
- 6.3 Market Share Analysis
- 6.4 Company Profiles (includes Global level Overview, Market level overview, Core Segments, Financials as available, Strategic Information, Market Rank/Share for key companies, Products & Services, and Recent Developments)
- 6.4.1 SKF AB
- 6.4.2 Emerson Electric Co. (Bently Nevada)
- 6.4.3 Rockwell Automation Inc.
- 6.4.4 ABB Ltd.
- 6.4.5 Siemens AG
- 6.4.6 Meggitt PLC
- 6.4.7 Bruel and Kjaer Vibro
- 6.4.8 Fluke Corporation
- 6.4.9 FLIR Systems Inc.
- 6.4.10 Parker Hannifin Corp. (Kittiwake)
- 6.4.11 AMETEK Inc. (Spectro Scientific)
- 6.4.12 Thermo Fisher Scientific Inc.
- 6.4.13 Bentley Nevada (Baker Hughes)
- 6.4.14 Schaeffler Group
- 6.4.15 Azima DLI
- 6.4.16 Honeywell International Inc.
- 6.4.17 National Instruments Corp.
- 6.4.18 Schneider Electric SE
- 6.4.19 Gastops Ltd.
- 6.4.20 Wilcoxon Sensing Technologies
7 MARKET OPPORTUNITIES & FUTURE OUTLOOK
- 7.1 White-space & Unmet-need Assessment
 设施监控市场规模、份额和成长分析(按监控类型、部署类型、垂直产业和地区划分)-2026-2033年产业预测
 2026年全球机器状态监测市场报告
 设施监控市场 - 全球产业规模、份额、趋势、机会及预测(按监控类型、监控流程、最终用户、地区和竞争格局划分,2021-2031年)
 机器状态监测市场规模、份额和趋势分析报告:按监测技术、组件、产品、应用、架构、工厂、监控过程、最终用途、地区和细分市场预测(2026-2033 年)
 机器状态监测市场规模、占有率、成长及全球产业分析:依类型、应用和地区划分的洞察与预测(2026-2034)
 日本机械状态监测市场报告:依监测技术、交付方式、部署方式、最终用户产业和地区划分,2026-2034年
 机器状态监测市场规模、份额和成长分析(按部署类型、解决方案、应用、最终用途和地区划分)-2026-2033年产业预测机器状态监测市场-全球产业规模、份额、趋势、机会和预测,按监测技术、产品/服务、部署类型、监测流程、最终用户、地区和竞争格局细分,2020-2030 年预测
 机器状态监测市场(按产品、监测方法、组件和最终用户划分)—2025-2032 年全球预测2025 年至 2033 年机器状态监测市场报告(按监测技术、产品、部署类型、最终用途产业和地区划分)