


 |
市场调查报告书
商品编码
1849875
印度农业化学品产业:市场份额分析、产业趋势、统计和成长预测(2025-2030 年)Agrochemical Industry In India - Market Share Analysis, Industry Trends & Statistics, Growth Forecasts (2025 - 2030) |
||||||
※ 本网页内容可能与最新版本有所差异。详细情况请与我们联繫。
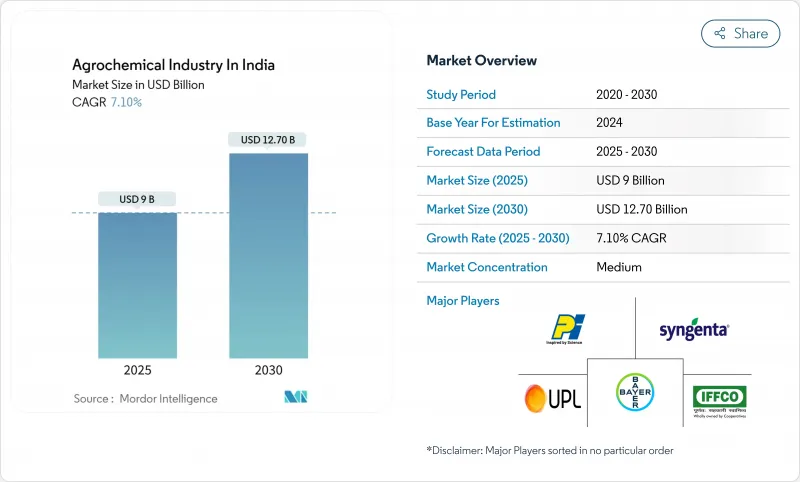
印度农业化学品产业市场规模预计在 2025 年为 90 亿美元,预计到 2030 年将达到 127 亿美元,预测期内复合年增长率为 7.10%。
强大的国内生产能力、不断增长的出口管道以及有利于永续投入的政策奖励正在推动这一发展势头。印度仍是世界第四大农化产品生产国,每年向欧洲、东南亚和西非出口价值50亿美元的成品。製剂科学也在不断发展,奈米营养液和水分散粒剂因其减少用量和提高田间安全性而越来越受到农民的认可。然而,对中国原材料的依赖以及各邦之间错综复杂的毒性禁令,继续为印度农化市场带来成本波动和合规复杂性。
印度农化产业市场趋势与洞察
政府补助合理化刺激生物投入的采用
新的补贴框架奖励各州减少化肥消耗,并将预算支持用于堆肥、生物肥料和奈米营养液。 2025年联邦预算中包含了农业预算拨款,并启动了「总理农业计画」(PM Dhan Dhanya Krishi Yojana),为改用认证生物肥料的农民提供正式的补贴机制。 PM-PRANAM等平行计画将支出与化学品减量目标挂钩,并鼓励管理人员加快训练模组和田间示范。
数位化农业信贷和电子商务网路拓展最后一英里
政府资助的数位基础设施已将土地记录、土壤健康卡和农民信用卡限额与统一农民登记册整合,使投入品公司能够在几分钟内审查信用状况,并透过基于应用程式的平台发送订单。例如,IFFCO 的 e-Bazar 在上个财年处理了超过 20 万笔线上交易,并向 2.7 万个邮递区号的地区配送产品。对于印度农化市场而言,这些数位化管道将转化为优质製剂销售量的成长,尤其是在长期以来供应受限的偏远地区。
对中国原料的依赖增加了成本波动
印度工厂从中国供应商进口大部分技术中间体,例如铋、碲和石墨,这使得国内製剂製造商在地缘政治危机期间面临价格波动和运输延误的风险。国内生产商必须持有更高的安全库存,在全球运费上涨期间,这会占用营运资金并侵蚀净利率。一个政府工作小组已经确定了印度100%依赖进口的10种关键矿产,并正在起草奖励方案,以迅速采用替代资源。
細項分析
化肥占印度农业化学品市场的55.2%,持续支持稻米、小麦和甘蔗种植体系的粮食安全政策。磷酸二铵和尿素仍占主导地位,但补贴改革正在推动农民对微量营养素混合物和奈米液体肥料的需求,这些肥料可以最大限度地减少地下水污染。
预计到2030年,生物製药销售额的复合年增长率将达到10.52%,这得益于较小的基数、堆肥激励措施、与残留物挂钩的出口标准以及不断扩大的有机认证区域。微生物菌丛和海藻刺激剂的日益普及,正在鼓励传统肥料製造商成立专门的生物部门。在延长保质期、低温运输独立包装和农民教育方面拥有专业知识的生产商可能会获得先发优势。
到2024年,谷物和谷类将占印度农化市场规模的47.3%,反映了印度-甘迪卡特平原水稻、小麦和玉米的种植面积。政府采购价格下限保护种植者免受週期性衰退的影响,即使在平均季风年份也能维持对投入品的需求。水果和蔬菜目前仅占印度农化收益的一小部分,但随着出口级芒果、葡萄和香蕉转向棚架、灌溉和气候控制环境,投入强度增加,预计其复合年增长率将达到9.13%。
普纳、班加罗尔和纳西克週边的温室丛集对残留杀菌剂和生物基杀虫剂的需求正在成长。油籽和豆类种植对价格相对敏感,但受益于国家自给自足计划,该计划为高硫肥料和生物固氮剂提供补贴。
印度农业化学品产业报告按产品类型(肥料、杀虫剂、其他)、用途(作物型、非作物型)、剂型(液体、其他)和分销管道(直销、其他)进行细分。市场预测以美元计算。
其他福利:
- Excel 格式的市场预测 (ME) 表
- 3个月的分析师支持
目录
第一章 引言
- 研究假设和市场定义
- 调查范围
第二章调查方法
第三章执行摘要
第四章 市场状况
- 市场概况
- 市场驱动因素
- 政府补助合理化促进生物投入的采用
- 数位化农业信贷和电子商务平台扩大了化学品的覆盖范围
- 精准无人机喷洒释放小农户尚未开发的需求
- 专利到期分子浪潮扩大了出口管道
- 气候相关虫害爆发增加农药使用量
- 政府计划提高国内製造能力
- 市场限制
- 对中国原料的严重依赖加剧了成本波动
- 加速国家层级禁用剧毒活性物质
- 仿冒品通路的增加正在减少流通中的品牌商品数量。
- 对传统杀虫剂的抗药性不断增强
- 监管格局
- 技术展望
- 波特五力分析
- 供应商的议价能力
- 消费者议价能力
- 新进入者的威胁
- 替代品的威胁
- 竞争对手之间的竞争
第五章市场规模及成长预测
- 依产品类型
- 肥料
- 杀虫剂
- 杀虫剂
- 除草剂
- 消毒剂
- 佐剂
- 植物生长调节剂
- 按用途
- 以作物为基础
- 粮食
- 油籽和豆类
- 水果和蔬菜
- 非作物
- 草坪和观赏植物
- 林业及其他
- 以作物为基础
- 按处方
- 液体
- 颗粒/粉末
- 奈米/微胶囊化
- 按分销管道
- 直接面向农民
- 农业供应零售商
- 电商平台
第六章 竞争态势
- 市场集中度
- 策略趋势
- 市占率分析
- 公司简介
- Bayer AG
- BASF SE
- Syngenta India Private Limited
- UPL
- Corteva Agriscience
- PI Industries
- IFFCO
- Coromandel International Ltd.
- Chambal Fertilisers and Chemicals Limited
- Rallis India Limited
- Deepak Fertilisers and Petrochemicals Corporation Limited(DFPCL)
- Crystal Crop Protection Ltd.
- Sumitomo Chemical India Ltd.
- Dhanuka Agritech Ltd.
- Indofil Industries Limited(Modi Enterprises)
第七章 市场机会与未来展望
The Agrochemical Industry in India Market size is estimated at USD 9 billion in 2025, and is anticipated to reach USD 12.70 billion by 2030, at a CAGR of 7.10% during the forecast period.
Strong domestic manufacturing capacity, expanding export pipelines, and policy incentives that favor sustainable inputs are propelling this momentum. India remains the fourth-largest global producer, shipping finished products worth USD 5 billion each year to destinations in Europe, Southeast Asia, and West Africa. Formulation science is also evolving, nano-nutrient liquids and water-dispersible granules are gaining farmer acceptance because they cut dosage rates and improve field safety. Nonetheless, raw-material dependence on China and a patchwork of state-level toxicity bans continue to inject cost volatility and compliance complexity into the India agrochemicals market.
Agrochemical Industry In India Market Trends and Insights
Government Subsidy Rationalization Spurring Bio-inputs Adoption
New subsidy frameworks reward states for curbing blanket fertilizer consumption and channel budgetary support toward compost, biofertilizers, and nano-nutrient liquids. The 2025 Union Budget set aside for agriculture and launched the Prime Minister Dhan-Dhanya Krishi Yojana, creating a formal mechanism to reimburse farmers who switch to certified biologicals. Parallel programs such as PM-PRANAM link disbursements to chemical reduction targets, encouraging administrators to fast-track training modules and field demonstrations.
Digitized Agri-credit and E-commerce Networks Widening Last-mile Reach
Government-funded digital infrastructure now integrates land records, soil health cards, and Kisan Credit Card limits into a unified farmer registry, allowing input companies to vet credit profiles in minutes and dispatch orders through app-based platforms. IFFCO e-Bazar, for example, fulfilled more than 200,000 online transactions in the past fiscal year and delivered to 27,000 pin codes, a scale previously unimaginable for bulk inputs. For the India agrochemicals market, these digital rails translate into higher off-take of premium formulations, especially in tier-II districts where assortment depth had long been a constraint.
Disruptive Raw-material Dependence on China Raising Cost Volatility
Indian plants import a bulk of technical intermediates such as bismuth, tellurium, and graphite from Chinese suppliers, leaving local formulators exposed to price swings and shipping delays during geopolitical flashpoints. Domestic producers must carry higher safety stocks, locking working capital and eroding margins when global freight rates spike. Government task forces have identified 10 critical minerals where India is 100% import-dependent and are drafting incentive packages to fast-track alternative sources.
Other drivers and restraints analyzed in the detailed report include:
- Drone-based Precision Spraying Unlocking Smallholder Demand
- Off-patent Molecule Wave Expanding Export Pipeline
- Accelerating State-level Bans on High-toxicity Actives
For complete list of drivers and restraints, kindly check the Table Of Contents.
Segment Analysis
Fertilizers captured 55.2% of the India agrochemicals market size, and continue to anchor food security policies for rice, wheat, and sugarcane systems. Di-ammonium phosphate and urea dominate volumes, yet escalating subsidy reforms are nudging growers toward micronutrient blends and nano-liquids that minimize groundwater contamination.
Biologicals, though starting from a smaller base, are projected to add nearly incremental sales by 2030 at a 10.52% CAGR, underpinned by compost incentives, residue-linked export standards, and expanding organic certification acreage. The rising popularity of microbial consortia and seaweed-based stimulants is encouraging conventional fertilizer majors to launch dedicated bio-divisions. Producers that master shelf-life extension, cold-chain independent packaging, and farmer education stand to capture early mover loyalty.
Grains and cereals commanded 47.3% of the India agrochemicals market size in 2024, reflecting the scale of paddy, wheat, and maize acreage across the Indo-Gangetic plain. Government procurement price floors insulate growers from cyclical dips and sustain input demand even in sub-normal monsoon years. Fruits and vegetables, while contributing a smaller revenue share today, are projected to expand at a 9.13% CAGR as export-class mangoes, grapes, and bananas shift to trellis, fertigation, and climate-controlled environments that lift input intensity.
Demand for residue-compliant fungicides and biorational insecticides is rising in greenhouse clusters around Pune, Bengaluru, and Nashik. Oilseed and pulse acreage are relatively price-sensitive but benefit from national self-sufficiency missions that subsidize sulfur-rich fertilizers and bio-nitrogen fixers.
The Agrochemical Industry in India Report is Segmented by Product Type (Fertilizers, Pesticides, and More), by Application (Crop-Based and Non-Crop-Based), by Formulation (Liquid, and More), and by Distribution Channel (Direct To Farmer, and More). The Market Forecasts are Provided in Terms of Value (USD).
List of Companies Covered in this Report:
- Bayer AG
- BASF SE
- Syngenta India Private Limited
- UPL
- Corteva Agriscience
- PI Industries
- IFFCO
- Coromandel International Ltd.
- Chambal Fertilisers and Chemicals Limited
- Rallis India Limited
- Deepak Fertilisers and Petrochemicals Corporation Limited (DFPCL)
- Crystal Crop Protection Ltd.
- Sumitomo Chemical India Ltd.
- Dhanuka Agritech Ltd.
- Indofil Industries Limited (Modi Enterprises)
Additional Benefits:
- The market estimate (ME) sheet in Excel format
- 3 months of analyst support
TABLE OF CONTENTS
1 Introduction
- 1.1 Study Assumptions and Market Definition
- 1.2 Scope of the Study
2 Research Methodology
3 Executive Summary
4 Market Landscape
- 4.1 Market Overview
- 4.2 Market Drivers
- 4.2.1 Government subsidy rationalization spurring bio-inputs adoption
- 4.2.2 Digitized agri-credit and e-commerce platforms expanding chemical reach
- 4.2.3 Drone-based precision spraying unlocking untapped smallholder demand
- 4.2.4 Off-patent molecule wave enlarges export pipeline
- 4.2.5 Climate-linked pest outbreaks increasing pesticide intensity
- 4.2.6 Government schemes boosting domestic manufacturing capacity
- 4.3 Market Restraints
- 4.3.1 Disruptive raw-material dependence on China raising cost volatility
- 4.3.2 Accelerating state-level bans on high-toxicity actives
- 4.3.3 Growing counterfeit channel eroding branded volumes
- 4.3.4 Intensifying resistance to legacy insecticides
- 4.4 Regulatory Landscape
- 4.5 Technological Outlook
- 4.6 Porter's Five Forces Analysis
- 4.6.1 Bargaining Power of Suppliers
- 4.6.2 Bargaining Power of Consumers
- 4.6.3 Threat of New Entrants
- 4.6.4 Threat of Substitute Products
- 4.6.5 Intensity of Competitive Rivalry
5 Market Size and Growth Forecasts (Value, USD)
- 5.1 By Product Type
- 5.1.1 Fertilizers
- 5.1.2 Pesticides
- 5.1.2.1 Insecticides
- 5.1.2.2 Herbicides
- 5.1.2.3 Fungicides
- 5.1.3 Adjuvants
- 5.1.4 Plant Growth Regulators
- 5.2 By Application
- 5.2.1 Crop-based
- 5.2.1.1 Grains and Cereals
- 5.2.1.2 Oilseeds and Pulses
- 5.2.1.3 Fruits and Vegetables
- 5.2.2 Non-crop-based
- 5.2.2.1 Turf and Ornamental
- 5.2.2.2 Forestry and Other
- 5.2.1 Crop-based
- 5.3 By Formulation
- 5.3.1 Liquid
- 5.3.2 Granular/Powder
- 5.3.3 Nano/Micro-encapsulated
- 5.4 By Distribution Channel
- 5.4.1 Direct to Farmer
- 5.4.2 Agri-input Retailers
- 5.4.3 E-commerce Platforms
6 Competitive Landscape
- 6.1 Market Concentration
- 6.2 Strategic Moves
- 6.3 Market Share Analysis
- 6.4 Company Profiles (includes Global level Overview, Market level overview, Core Segments, Financials as available, Strategic Information, Market Rank/Share for key companies, Products and Services, and Recent Developments)
- 6.4.1 Bayer AG
- 6.4.2 BASF SE
- 6.4.3 Syngenta India Private Limited
- 6.4.4 UPL
- 6.4.5 Corteva Agriscience
- 6.4.6 PI Industries
- 6.4.7 IFFCO
- 6.4.8 Coromandel International Ltd.
- 6.4.9 Chambal Fertilisers and Chemicals Limited
- 6.4.10 Rallis India Limited
- 6.4.11 Deepak Fertilisers and Petrochemicals Corporation Limited (DFPCL)
- 6.4.12 Crystal Crop Protection Ltd.
- 6.4.13 Sumitomo Chemical India Ltd.
- 6.4.14 Dhanuka Agritech Ltd.
- 6.4.15 Indofil Industries Limited (Modi Enterprises)
7 Market Opportunities and Future Outlook
 铜肥市场规模、份额和成长分析:按产品类型、配方类型、应用类型、最终用户和地区划分 - 2026-2033 年产业预测
 作物保护市场分析及预测(至2035年):依类型、产品类型、应用、技术、形式、最终用户、服务、实施类型、功能及解决方案划分
 全球农业化学品市场规模、份额、趋势和成长分析报告(2026-2034年)
 特种作物保护解决方案市场,全球预测至2034年:依产品类型、作物类型、配方、应用和地区划分
 2026年全球滷代农药市场报告农药储槽市场-2026-2031年预测
 依运输方式、服务类型、产品类型、货柜类型、温控类型和物流所有权分類的农业化学品分销市场-2026-2032年全球预测农业烷氧基化物市场按产品类型、功能、形态、应用和分销管道划分,全球预测(2026-2032年)按剂型、作物类型、通路和应用方法分類的啶虫脒原料药市场-全球预测,2026-2032年作物保护供应商市场预测至2032年:按产品类型、作物类型、供应商类型、分销管道和地区分類的全球分析