


 |
市场调查报告书
商品编码
1849999
3D列印:市场占有率分析、产业趋势、统计数据和成长预测(2025-2030)3D Printing - Market Share Analysis, Industry Trends & Statistics, Growth Forecasts (2025 - 2030) |
||||||
※ 本网页内容可能与最新版本有所差异。详细情况请与我们联繫。
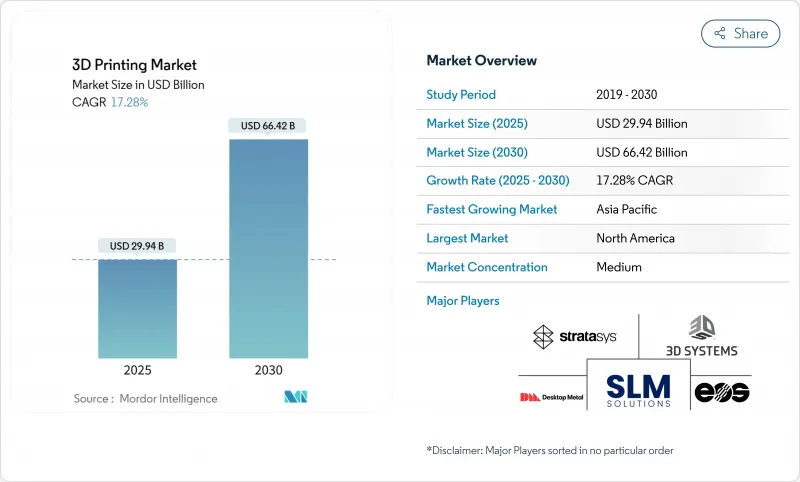
3D列印市场规模预计在2025年为299.4亿美元,预计到2030年将达到664.2亿美元,预测期内(2025-2030年)的复合年增长率为17.28%。
这一成长曲线得益于机器吞吐量的不断提高、材料组合的丰富以及技术从快速原型製作向中小批量最终用途生产的逐步转变。航太、医疗保健和汽车公司目前正在检验用于飞行硬体、植入式设备和结构支架的金属和聚合物零件,这加速了对认证粉末和闭合迴路监控的需求。同时,服务机构正在扩展多雷射系统并提供云端基础的容量,从而降低新采用者的资本投资风险。美国和中国的战略性政府资金正在加快认证时间表并抵消资本成本,而 ASTM主导的标准化预计将协调各地区的测试通讯协定。像 Nano Dimension 收购 Desktop Metal 这样的合併表明投资者对增材工作流程将支撑下一代供应链的信心。
全球 3D 列印市场趋势与洞察
北美政府资助的积层製造中心
联邦和州政府计画持续加速国内应用。 2025年1月,美国製造公司(America Makes)向计划专注于现场计量、永续粉末回收和低成本铝参数集的项目拨款210万美元。该倡议将创建一个连接RTX技术研究中心、爱迪生焊接研究所和地区加工车间的协作测试平台。 ASTM标准化卓越中心提供的1500万美元补充资金将用于协调数据格式和测试样件,弥合研究原型与合格生产之间持续存在的差距。透过编纂製造参数包络,该生态系统将减少重复测试,并缩短3D列印市场的认证週期,尤其是在航太和医疗设备供应链领域。
欧洲采用金属积层製造技术满足航太零件需求激增
欧洲的MRO供应商越来越多地使用粉末冶金熔合技术来替换停产的零件,而无需承担仓储费用。 SpaceX的Raptor 3舱室采用多雷射粉末床熔合技术製造,展示了从演示到飞行就绪部件的路径。欧洲监管机构已经明确了非关键金属内饰的指导方针,使30件或更少件的小批量生产在经济上可行。汉莎技术公司、赛峰集团和劳斯莱斯现在都储备了可在维护点触发列印订单的数位库存,将前置作业时间从数週缩短到不到48小时。随着钛和因科镍合金粉末达到航太级的可重复性,欧洲3D列印市场正受益于与本地生产相关的碳足迹减少。
飞行关键零件的认证瓶颈持续存在
涡轮喷嘴和增压阀等飞行硬体必须符合严格的断裂韧性和疲劳测试。由于现行规则是针对减材製造流程製定的,因此积层製造零件需要重复的试样测试,导致工期延长长达18个月。只有大型主要供应商才能承担这些成本,这限制了小型二级供应商的3D列印市场。虽然ASTM和ISO工作小组正在起草针对特定方法的标准,但全球统一仍需数年时间。
細項分析
到 2024 年,硬体部门将占全球收入的 60.23%,这得益于工业规模金属熔炼、高温聚合物和自动后处理的资本投资。然而,从 2025 年到 2030 年,服务业将以 25.21% 的复合年增长率超过硬体部门。 Stratasys Direct Manufacturing、Materialize 和 Protolabs 等合约製造商利用其多站点网路来分配工作负载,使客户能够创建原型并在 10 天内收到 ISO-13485 製造的零件。服务业的繁荣将降低经济障碍并扩大 3D 列印市场的用户群。然而,随着 3MF 超越 STL,结合晶格生成器和成本估算引擎的云原生建构准备工具将迎来机会。
随着原始设备製造商将基于订阅的机器租赁与远端监控捆绑在一起,3D列印市场受益匪浅。新参与企业模仿影印机租赁,提供按页计费的模式,将维护、校准和粉末补充整合到一张发票中。这种混合模式模糊了硬体和服务之间的界限,使宏观经济週期的收益流更加平滑。
随着汽车、能源和航太产业从原型模具转向批量生产,工业平台将在2024年占据3D列印支出的72.14%。多雷射粉末熔化炉的铬镍铁合金沉积速度达到150cc/小时,超越了过去的速度极限。製造商利用拓朴优化的支架将重量减轻40%,并整合了组装流程。随着3D列印的首次通过率接近数控铣削,整合粉末回收和即时熔池分析的製造腔将提高3D列印市场的可靠性。
桌面系统正在经历復兴,以 Bambu Lab 的高速 CoreXY 架构为代表,儘管销量不大,但其加速度可达 20,000 毫米/秒²。各大学正在部署多达 1,000 个单元的丛集,用于教授增材设计原理,并为业界培养人才。牙医和珠宝商正在采用 XY 解析度达到 30 微米的 LCD 树脂印表机,从而将 3D 列印市场拓展到工程办公室以外的领域。
3D 列印市场报告按组件(硬体、软体、服务)、印表机类型(工业 3D 列印机、桌上型 3D 列印机)、技术(光聚合(SLA、DLP)、其他)、材料(聚合物、金属和合金、其他)、最终用户产业(汽车、航太和国防、其他)和地区进行细分。
区域分析
北美占全球整体的41.68%,是财富500强企业招聘供应商、粉末喷涂机製造商、软体供应商和契约製造製造商的集中地。 America Makes正在将津贴用于粉末回收和即时监控,以填补材料资料表的空白。美国正在采取多层次的积层製造方法,从舰载FDM设备到基地级DED维修,从而建构结构化的需求管道。通用电气航空航太公司投资10亿美元新建一座增材製造工厂,以加强航空合金的供应安全。 metal-am.com 在战略金属出口限制收紧的背景下,陆基粉末生产进一步分化了北美3D列印市场。
预计亚太地区的复合年增长率将达到 26.47%,这主要得益于中国的设备补贴和印度医疗保健的普及。北京的目标是到 2027 年实现 90% 的数位研发渗透率,这支持了对设计套件和模拟软体的广泛需求。日本正在利用积层製造技术生产用于半导体微影术的微分辨率陶瓷组件。韩国正在资助一个产学研联合实验室,以完善电动汽车电机铜的金属黏合剂喷射加工,从而支持该国的电气化目标。在东南亚,新加坡的先进再製造和技术中心正在孵化一种混合增材裂解单元,这可能对船舶和石油钻井平台的维护具有吸引力。
欧洲仍然是科研和生产领域的强国。空中巴士、赛峰集团和MTU航空发动机公司共同主导了一个标准开发联盟,以确保各原始设备製造商(OEM)的几何公差保持一致。一家德国汽车製造商正在使用黏着剂喷涂喷射不銹钢零件作为仪表板支架,理由是对于年产量低于2万辆的汽车,这种製程的循环时间比冲压製程更快。斯堪地那维亚透过整合回收粉末流获得了循环经济认证。东欧契约製造製造商正在赢得西方原始设备製造商的大量订单,这加剧了该地区3D列印市场的差异性。
中东地区透过能源和医疗保健项目加速成长。沙特阿美公司正在试验用于暴露于矫正器具盐度盐水的海水淡化阀的耐腐蚀格栅插件。阿联酋一家医院与一所大学合作,印製用于复杂心血管手术的解剖模型。在非洲,义肢和备件的试点生产正在进行中,但基础设施仍有缺口。巴西的SENAI网路教授「增材设计」课程,为未来的劳动力做好准备。
其他福利:
- Excel 格式的市场预测 (ME) 表
- 3个月的分析师支持
目录
第一章 引言
- 研究假设和市场定义
- 调查范围
第二章调查方法
第三章执行摘要
第四章 市场状况
- 市场概况
- 市场驱动因素
- 北美政府资助的积层製造中心
- 欧洲金属积层製造技术在航太零件按需生产中的应用激增
- 中国「中国製造2025」对工业3DP设备的补贴
- 印度对患者专用整形外科植入的需求不断增长
- 海湾合作委员会能源产业向轻型格栅热交换器 AM 转型
- 电动车平台的全球普及正在导致工具需求的快速成长
- 市场限制
- 飞行关键零件认证瓶颈仍存在
- 高性能金属粉末价格波动
- 适用于食品接触应用的可印刷材料种类有限
- AM 软体与传统 PLM 套件之间的互通性差距
- 价值链/供应链分析
- 监理展望
- 技术展望
- 波特五力分析
- 供应商的议价能力
- 买方的议价能力
- 新进入者的威胁
- 替代品的威胁
- 竞争对手之间的竞争
- COVID-19 市场影响
- 投资分析
第五章市场规模及成长预测
- 按组件
- 硬体
- 软体
- 服务
- 依印表机类型
- 工业3D印表机
- 桌上型3D印表机
- 依技术
- 光聚合(SLA、DLP)
- 粉体熔化成型技术(SLS、SLM、EBM)
- 材料挤压(FDM、FFF)
- 材料喷涂
- 黏着剂喷涂成型
- 定向能量沉淀
- 片材层压
- 按材质
- 聚合物
- 金属和合金
- 陶瓷
- 复合材料
- 其他成分
- 按用途
- 原型製作
- 製造和生产零件
- 工具及固定装置
- 研究与开发
- 个人化消费品
- 按最终用户产业
- 车
- 航太和国防
- 医疗保健和牙科
- 家电
- 建筑与建筑
- 能源(石油与天然气、电力)
- 食物和烹饪
- 教育研究所
- 其他行业
- 按地区
- 北美洲
- 美国
- 加拿大
- 拉丁美洲
- 墨西哥
- 巴西
- 阿根廷
- 其他拉丁美洲地区
- 欧洲
- 英国
- 德国
- 法国
- 义大利
- 西班牙
- 其他欧洲地区
- 中东和非洲
- 阿拉伯聯合大公国
- 沙乌地阿拉伯
- 南非
- 其他中东和非洲地区
- 亚太地区
- 中国
- 日本
- 韩国
- 印度
- 其他亚太地区
- 北美洲
第六章 竞争态势
- 市场集中度
- 策略趋势
- 市占率分析
- 公司简介
- Stratasys Ltd
- 3D Systems Corporation
- EOS GmbH
- General Electric Company(GE Additive)
- Hewlett Packard Inc.
- Desktop Metal Inc.
- Materialise NV
- SLM Solutions Group AG
- Velo3D Inc.
- Renishaw plc
- Ultimaker BV
- Formlabs Inc.
- Markforged Holding Corp.
- Nano Dimension Ltd.
- Prodways Group
- Tritone Technologies
- Carbon Inc.
- HP Inc.(Personalization division)
- UnionTech Inc.
- Sisma SpA
第七章 市场机会与未来展望
The 3D Printing Market size is estimated at USD 29.94 billion in 2025, and is expected to reach USD 66.42 billion by 2030, at a CAGR of 17.28% during the forecast period (2025-2030).
This growth arc is sustained by higher machine throughput, richer material portfolios, and the technology's gradual migration from rapid prototyping to low- and mid-volume end-use production. Aerospace, healthcare, and automotive firms now validate metal and polymer parts for flight hardware, implantable devices, and structural brackets, accelerating demand for certified powders and closed-loop monitoring. At the same time, service bureaus are scaling multi-laser systems to provide cloud-based capacity that de-risks capital investments for new adopters. Strategic government funding in the United States and China compresses qualification timelines and offsets equipment costs, while ASTM-led standardization is expected to harmonize testing protocols across regions. Consolidation, such as Nano Dimension's purchase of Desktop Metal, signals investor conviction that additive workflows will underpin next-generation supply chains.
Global 3D Printing Market Trends and Insights
Government-funded Additive Manufacturing Hubs in North America
Federal and state programs continue to accelerate domestic adoption. In January 2025, America Makes awarded USD 2.1 million to projects focused on in-situ metrology, sustainable powder recycling, and low-cost aluminum parameter sets. The initiative creates collaborative testbeds linking RTX Technology Research Center, Edison Welding Institute, and regional job-shops. Complementary funding under a USD 15 million ASTM Standardization Center of Excellence harmonizes data formats and test coupons, closing a persistent gap between research prototypes and qualified production. By codifying build-parameter envelopes, the ecosystem reduces redundant trials and shortens certification cycles for the 3D printing market, particularly in aerospace and medical device supply chains.
Surging Metal AM Adoption for On-demand Aerospace Spare Parts in Europe
European MRO providers increasingly rely on powder bed fusion to replace out-of-production parts without the overhead of warehousing. SpaceX's Raptor 3 chamber, produced through multi-laser laser-powder-bed fusion, illustrates the pathway from demonstrator to flight-ready part. Euro-control agencies have clarified guidelines for non-critical metallic interiors, making small-batch economics favorable even at volumes below 30 units. Lufthansa Technik, Safran, and Rolls-Royce now stock digital inventories that trigger print orders at the point of maintenance, cutting lead times from weeks to under 48 hours. As titanium and inconel powders reach aerospace-grade repeatability, the 3D printing market in Europe benefits from reduced carbon footprints tied to localized manufacturing.
Persistent Certification Bottlenecks for Flight-critical Parts
Flight hardware like turbine nozzles or pressurization valves must comply with rigorous fracture-toughness and fatigue tests. Current rulebooks were written for subtractive machining; hence, additive parts undergo redundant coupon testing that extends schedules by up to 18 months. Only large primes can absorb the cost, limiting the 3D printing market's reach within smaller tier-two suppliers. Though ASTM and ISO working groups are drafting method-specific standards, global alignment remains a multi-year endeavor.
Other drivers and restraints analyzed in the detailed report include:
- China's 'Made in China 2025' Subsidies for Industrial 3DP Equipment
- Growing Demand for Patient-specific Orthopedic Implants in India
For complete list of drivers and restraints, kindly check the Table Of Contents.
Segment Analysis
In 2024, the hardware segment drew 60.23% of global revenue, driven by capital outlays for industrial-scale metal fusion, high-temperature polymers, and automated post-processing. Yet, from 2025 to 2030, services outpace with a 25.21% CAGR. Contract manufacturers such as Stratasys Direct Manufacturing, Materialize, and Protolabs leverage multi-site networks to distribute load, allowing customers to prototype and receive production ISO-13485 parts within ten days. The services boom lowers financial barriers, expanding the user base of the 3D printing market. By contrast, software suppliers evolve more slowly, hampered by fragmented data formats; however, as 3MF overtakes STL, opportunity emerges for cloud-native build-prep tools that embed lattice generators and cost estimation engines.
The 3D printing market benefits when OEMs bundle subscription-based machine leasing with remote monitoring. New entrants mimic copier leasing, offering print-per-hour models that fold maintenance, calibration, and powder refills into a single invoice. This hybrid approach blurs the line between hardware and services, smoothing revenue streams across macroeconomic cycles.
Industrial platforms command 72.14% of 2024 spending as automotive, energy, and aerospace segments transition from prototype tooling to serial production. Multi-laser powder bed fusion now reaches 150 cc/hour deposition for Inconel, cracking a historical speed ceiling. Manufacturers exploit topology-optimized brackets that drop weight by 40% and consolidate assembly steps. The 3D printing market gains credibility because first-time pass rates approach those of CNC milling when build chambers incorporate powder recycling and real-time melt-pool analytics.
Desktop systems, while smaller in revenue, experience a renaissance marked by Bambu Lab's high-speed CoreXY architectures delivering 20,000 mm/s2 accelerations. Universities deploy clusters of sub-USD 1,000 units to teach design-for-additive principles, forming a talent pipeline for industrial roles. Dentists and jewelers adopt LCD resin printers that achieve 30 µm XY resolution, widening the 3D printing market beyond engineering offices.
The 3D Printing Market Report is Segmented by Component (Hardware, Software, and Services), Printer Type (Industrial 3D Printer and Desktop 3D Printer), Technology (Vat Photopolymerization [SLA, DLP], and More), Material Type (Polymers, Metals and Alloys, and More), End-User Industry (Automotive, Aerospace and Defense, and More), and Geography.
Geography Analysis
North America holds 41.68% of global spending, anchored by Fortune 500 adopters and a tight cluster of powder atomizers, software vendors, and contract manufacturers. America Makes funnels grant dollars toward powder recycling and real-time monitoring, closing material data sheet gaps. The U.S. Navy's layered approach to additive manufacturing, from shipboard FDM units to depot-level DED repair, creates a structured demand pipeline. GE Aerospace's USD 1 billion commitment to new additive facilities cements supply security for aviation alloys metal-am.com. As export controls tighten on strategic metals, onshore powder production further differentiates the North American 3D printing market.
Asia Pacific is forecast to expand at a 26.47% CAGR, influenced by China's equipment subsidies and India's medical adoption. Beijing's 90% digital R&D penetration target by 2027 underpins broad-based demand for design suites and simulation software. Japan leverages additive manufacturing for micro-resolution ceramic components used in semiconductor lithography. South Korea funds joint university-industry labs to perfect metal binder jetting of copper for EV motors, supporting domestic electrification goals. In Southeast Asia, Singapore's Advanced Remanufacturing and Technology Centre incubates hybrid additive-subtractive cells that appeal to marine and oil-rig maintenance.
Europe remains a powerhouse for both research and production. Airbus, Safran, and MTU Aero Engines co-lead standard-development consortia, ensuring geometric tolerances align across OEMs. German automakers deploy binder-jet stainless components into dashboard support brackets, citing faster cycle times than stamped alternatives at volumes under 20,000 units annually. Scandinavia seeks circular-economy credentials by integrating recycled powder streams. Eastern Europe's contract manufacturers attract overflow orders from Western OEMs, adding to the heterogeneity of the regional 3D printing market.
Middle East oxygenates growth through energy and healthcare programs. Saudi Aramco trials corrosion-resistant lattice inserts for desalination valves exposed to high-salinity brines. UAE hospitals partner with universities to print anatomical models for complex cardiac surgeries. Africa shows pilot activity in prosthetics and spare parts, though infrastructure gaps persist. Latin America cultivates in-house tooling for consumer appliance plants; Brazil's SENAI network teaches design-for-additive curricula, prepping a future workforce.
- Stratasys Ltd
- 3D Systems Corporation
- EOS GmbH
- General Electric Company (GE Additive)
- Hewlett Packard Inc.
- Desktop Metal Inc.
- Materialise NV
- SLM Solutions Group AG
- Velo3D Inc.
- Renishaw plc
- Ultimaker B.V.
- Formlabs Inc.
- Markforged Holding Corp.
- Nano Dimension Ltd.
- Prodways Group
- Tritone Technologies
- Carbon Inc.
- HP Inc. (Personalization division)
- UnionTech Inc.
- Sisma S.p.A.
Additional Benefits:
- The market estimate (ME) sheet in Excel format
- 3 months of analyst support
TABLE OF CONTENTS
1 INTRODUCTION
- 1.1 Study Assumptions and Market Definition
- 1.2 Scope of the Study
2 RESEARCH METHODOLOGY
3 EXECUTIVE SUMMARY
4 MARKET LANDSCAPE
- 4.1 Market Overview
- 4.2 Market Drivers
- 4.2.1 Government-funded additive manufacturing hubs in North America
- 4.2.2 Surging metal AM adoption for on-demand aerospace spare-parts in Europe
- 4.2.3 China's 'Made in China 2025' subsidies for industrial 3DP equipment
- 4.2.4 Growing demand for patient-specific orthopedic implants in India
- 4.2.5 Energy-sector shift to AM for lightweight lattice heat-exchangers in GCC
- 4.2.6 Rapid tooling needs driven by EV platform proliferation globally
- 4.3 Market Restraints
- 4.3.1 Persistent certification bottlenecks for flight-critical parts
- 4.3.2 Volatility in high-performance metal powder pricing
- 4.3.3 Limited printable material palette for food-contact applications
- 4.3.4 Inter-operability gaps between AM software and legacy PLM suites
- 4.4 Value/Supply-Chain Analysis
- 4.5 Regulatory Outlook
- 4.6 Technological Outlook
- 4.7 Porter's Five Forces Analysis
- 4.7.1 Bargaining Power of Suppliers
- 4.7.2 Bargaining Power of Buyers
- 4.7.3 Threat of New Entrants
- 4.7.4 Threat of Substitutes
- 4.7.5 Intensity of Competitive Rivalry
- 4.8 Impact of COVID-19 on the Market
- 4.9 Investment Analysis
5 MARKET SIZE AND GROWTH FORECASTS (VALUE)
- 5.1 By Component
- 5.1.1 Hardware
- 5.1.2 Software
- 5.1.3 Services
- 5.2 By Printer Type
- 5.2.1 Industrial 3D Printer
- 5.2.2 Desktop 3D Printer
- 5.3 By Technology
- 5.3.1 Vat Photopolymerization (SLA, DLP)
- 5.3.2 Powder Bed Fusion (SLS, SLM, EBM)
- 5.3.3 Material Extrusion (FDM, FFF)
- 5.3.4 Material Jetting
- 5.3.5 Binder Jetting
- 5.3.6 Directed Energy Deposition
- 5.3.7 Sheet Lamination
- 5.4 By Material
- 5.4.1 Polymers
- 5.4.2 Metals and Alloys
- 5.4.3 Ceramics
- 5.4.4 Composites
- 5.4.5 Other Materials
- 5.5 By Application
- 5.5.1 Prototyping
- 5.5.2 Manufacturing / Production Parts
- 5.5.3 Tooling and Fixtures
- 5.5.4 Research and Development
- 5.5.5 Personalized Consumer Products
- 5.6 By End-user Industry
- 5.6.1 Automotive
- 5.6.2 Aerospace and Defense
- 5.6.3 Healthcare and Dental
- 5.6.4 Consumer Electronics
- 5.6.5 Construction and Architecture
- 5.6.6 Energy (Oil and Gas, Power)
- 5.6.7 Food and Culinary
- 5.6.8 Education and Research Institutes
- 5.6.9 Other Industries
- 5.7 By Geography
- 5.7.1 North America
- 5.7.1.1 United States
- 5.7.1.2 Canada
- 5.7.2 Latin America
- 5.7.2.1 Mexico
- 5.7.2.2 Brazil
- 5.7.2.3 Argentina
- 5.7.2.4 Rest of Latin America
- 5.7.3 Europe
- 5.7.3.1 United Kingdom
- 5.7.3.2 Germany
- 5.7.3.3 France
- 5.7.3.4 Italy
- 5.7.3.5 Spain
- 5.7.3.6 Rest of Europe
- 5.7.4 Middle East and Africa
- 5.7.4.1 United Arab Emirates
- 5.7.4.2 Saudi Arabia
- 5.7.4.3 South Africa
- 5.7.4.4 Rest of Middle East and Africa
- 5.7.5 Asia-Pacific
- 5.7.5.1 China
- 5.7.5.2 Japan
- 5.7.5.3 South Korea
- 5.7.5.4 India
- 5.7.5.5 Rest of Asia-Pacific
- 5.7.1 North America
6 COMPETITIVE LANDSCAPE
- 6.1 Market Concentration
- 6.2 Strategic Moves
- 6.3 Market Share Analysis
- 6.4 Company Profiles (includes Global level Overview, Market level overview, Core Segments, Financials as available, Strategic Information, Market Rank/Share for key companies, Products & Services, and Recent Developments)
- 6.4.1 Stratasys Ltd
- 6.4.2 3D Systems Corporation
- 6.4.3 EOS GmbH
- 6.4.4 General Electric Company (GE Additive)
- 6.4.5 Hewlett Packard Inc.
- 6.4.6 Desktop Metal Inc.
- 6.4.7 Materialise NV
- 6.4.8 SLM Solutions Group AG
- 6.4.9 Velo3D Inc.
- 6.4.10 Renishaw plc
- 6.4.11 Ultimaker B.V.
- 6.4.12 Formlabs Inc.
- 6.4.13 Markforged Holding Corp.
- 6.4.14 Nano Dimension Ltd.
- 6.4.15 Prodways Group
- 6.4.16 Tritone Technologies
- 6.4.17 Carbon Inc.
- 6.4.18 HP Inc. (Personalization division)
- 6.4.19 UnionTech Inc.
- 6.4.20 Sisma S.p.A.
7 MARKET OPPORTUNITIES AND FUTURE OUTLOOK
- 7.1 White-space and Unmet-need Assessment
 欧洲3D列印市场:市场占有率分析、产业趋势与统计、成长预测(2026-2031年)
 3D列印市场-全球产业规模、份额、趋势、机会和预测,按组件、(软体)、印表机类型、技术、製程、垂直产业、地区和竞争格局划分,2021-2031年预测
 金属3D列印市场规模、份额和成长分析(按技术、列印类型、组件、垂直产业和地区划分)-产业预测(2026-2033年)
 陶瓷3D列印市场规模、份额和成长分析(按配方、类型、形状、技术、应用、最终用途和地区划分)-2026-2033年产业预测
 3D列印市场规模、份额和趋势分析报告:按组件、印表机类型、技术、软体、应用、产业、材料、地区和细分市场预测(2026-2033年)
 3D 列印:材料和设备机会、趋势和市场
 粉末层熔融3D列印技术市场-2025-2030年预测
 日本影音市场:影片洞察
 3D列印市场 (~2035年):提供类型·印表机类型·连接类型·自动化·印刷方向·技术·软体·材料·流程·用途、终端用户·各地区 - 产业趋势·全球市场的预测立体光刻技术3D列印技术市场-2025年至2030年预测