


 |
市场调查报告书
商品编码
1850082
视讯即服务 (VaaS):市场占有率分析、产业趋势、统计数据和成长预测 (2025-2030)VaaS - Market Share Analysis, Industry Trends & Statistics, Growth Forecasts (2025 - 2030) |
||||||
※ 本网页内容可能与最新版本有所差异。详细情况请与我们联繫。
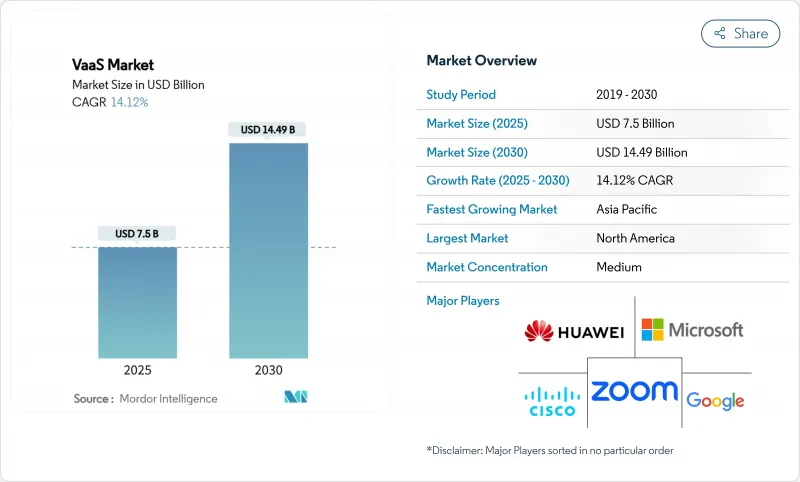
视讯即服务 (VaaS) 市场预计将在 2024 年达到 75 亿美元,并在 2025 年至 2030 年以 14.1% 的复合年增长率增长,到 2030 年达到 144.9 亿美元。
频宽定价、5G 渗透率的不断提高以及买家对订阅收费而非资本支出的偏好持续推动着云端视讯服务的普及。财务主管们越来越将云端视讯支出视为可预测的营运成本,即使在 IT 预算紧张的情况下也能平滑现金流。亚太地区受惠于新增资料中心容量和广泛的 5G 独立组网部署,正在加速发展。投资人正在评估那些能够将经常性收入与合规功能结合的供应商,这促使供应商制定了专注于加密、审核日誌记录和自主部署范本的蓝图。碳减排要求和混合办公模式维修计画正在推动资本支出需求,进一步巩固了视讯即服务 (VaaS) 市场的发展势头。
全球虚拟即服务 (VaaS) 市场趋势与洞察
从资本支出转向营运支出
到2024年,企业将把预算从专用桥接器转向计量收费的云端视讯服务。美国一家领先的通讯业者报告称,透过将四分之一的影片业务组合迁移到服务模式,实现了年度折旧免税额两位数的下降,并提高了营运自由现金流。节省下来的折旧免税额资金通常用于频宽升级,从而形成良性循环,提高利用率。财务部门重视每月的价格可见性,这有助于在宏观经济逆风时期缓衝视讯即服务 (VaaS) 的支出。供应商则透过简化按使用者许可等级来应对,从而降低采购复杂性。早期采用者发现,随着云端平台吸收版本控制,这种转变降低了生命週期支援成本。
将影片API 嵌入到您的应用程式中
一家欧洲保险公司利用API网关,将即时保单资料汇入模板场景,并在2025年交付了4万个个人化续保影片。随着行销部门的直接相关人员,过去由IT部门主导的购买週期正在加速。将客户关係管理资料整合到影片中,可加速客户留存宣传活动,并支援动态提升销售提示。随着API的成熟度不断提高,保险公司在影片播放的同时,也加入了用户同意和点击验证功能,从而加强了合规流程。此外,由于影片时长可以根据合约的复杂程度进行调整,这种方法还能降低託管成本。
主权资料居住要求
一家澳洲银行集团于2025年将所有会议录影迁移到本地託管实例,以符合更新后的审慎监管标准。地理围栏流量路由支援运营,但也增加了对跨区域监控工具的需求。供应商必须维护多个司法管辖区的合规模板,这增加了工程成本。在受监管行业,数据处理协议的谈判延长了销售週期。一些买家正在采用混合云端模式,以平衡本地控制和全球弹性,这使得部署架构更加复杂。
细分市场分析
到2024年,应用程式管理套件将占据影片即服务(VaaS)市场最大的份额,占全球收入的34%。企业对会议编配、日历整合和即时安全管理有基本需求。低程式码连接器使人力资源团队无需提交IT工单即可安排入职培训,从而扩大用户群并提高每个租户的容量。供应商透过会议生命週期可视性来脱颖而出,该可追踪参与者的参与度,甚至细緻到表情符号的使用频率。
然而,内容管理平台预计将超越其他类别,到 2030 年将以 16.5% 的复合年增长率成长。买家越来越将元资料、章节划分和合规性标籤视为核心功能。开发人员正透过软体开发套件(SDK) 将Widgets整合到员工入口网站中,从而实现这些功能。随着内容保留策略与 ESG 归檔要求的整合,以内容为中心的视讯即服务 (VaaS) 市场规模预计将会扩大。设备管理子模组现在可以显示能耗指标,使永续性团队能够追踪每个终端的能耗,并将平台更新讨论与企业应对气候变迁的目标联繫起来,从而增加价值。
到 2024 年,企业运算终端仍将占据视讯即服务 (VaaS) 市场规模的 55%。桌面和笔记型电脑用户端整合了单一登入和策略执行功能,以满足法规和政策要求。丰富的萤幕共用和键盘辅助功能可确保知识工作者保持高度参与。供应商正在改进开放式办公室的背景噪音抑制功能,在不增加位元率的情况下提高视讯清晰度。
行动装置的新用户成长速度将最快,2025年至2030年的复合年增长率将达到18%。旗舰设备将支援即时深度映射的电影模式,使行销团队能够完全透过行动工作流程製作内部更新影片。这一转变将把影片製作週期从数週缩短至数小时。随着5G网路覆盖范围扩展到农村地区,行动视讯即服务(VaaS)的市场份额预计将会成长,从而消除现场工作人员对网路可靠性的顾虑。在房间规模的场景下,配备智慧音讯分区功能的吸顶式360度全景摄影机将受到青睐,确保远端参与者都能获得相同的音讯拾取效果。
视讯即服务 (VaaS) 市场按平台(应用管理、设备管理及其他)、设备(行动装置、企业运算、会议室终端)、服务(託管服务、专业服务)、部署模式(公共云端、私有云端、混合云端)、终端用户产业(政府和国防、银行、金融服务和保险 (BFSI) 及其他)和地区进行细分。市场预测以美元计价。
区域分析
北美将继续保持主导地位,预计到2024年将占全球收入的38%,这主要得益于云端运算的成熟度、资本市场对经常性收入软体的强劲投资以及人工智慧内容管治的早期应用。美国企业正在将语音分析技术整合到高阶主管简报库中,而加拿大的双语法规也刺激了对机器翻译的需求。政府资助的宽频津贴正在保障农村地区的频宽,并将影片覆盖范围扩展到较小的城镇。该地区也是率先试验边缘运算卸载的地区之一,从而减少了物联网视讯分析所需的中央云端跳跃次数。
预计到2030年,亚太地区的复合年增长率将达到17%,成为所有地区中成长最快的地区。新加坡在2024年新增了150兆瓦的託管容量,首尔的5G独立组网覆盖范围翻了一番,从而推动了区域SaaS业务的扩张。许多东协企业完全跳过了传统的PBX阶段,因此它们的第一批视讯部署都是原生云端为基础的。语言多样性推动了应用程式内字幕本地化的发展,使拥有丰富语言套件的供应商获得了竞争优势。在印尼和菲律宾部署的边缘节点降低了首公里抖动,提高了群岛各地用户的体验一致性。
在欧洲,严格的资料保护法规和积极的脱碳目标仍然有效。一家德国汽车集团计划在2024年用影片取代8,000个城际航班,进而将范围3的排放强度降低4%。排放审核接受视讯即服务(VaaS)仪表板作为减少出行的替代证据,并将视讯预算纳入环境、社会和治理(ESG)框架。主权云端偏好导致供应商支援需求分散在多个子区域。欧元区的《数位市场法案》促进开放互通性,鼓励供应商采用基于标准的转码器和身分验证外挂程式。
其他福利:
- Excel格式的市场预测(ME)表
- 3个月的分析师支持
目录
第一章 引言
- 研究假设和市场定义
- 调查范围
第二章调查方法
第三章执行摘要
第四章 市场情势
- 市场概览
- 市场驱动因素
- 越来越多的企业正在从高资本支出(CAPEX)的视讯基础设施迁移到营运成本(OPEX)更低的云端订阅模式。
- 面向客户的应用程式(银行、零售、远端医疗)中嵌入式视讯 API 的使用量激增
- 北美和亚洲的低延迟 5G 网路将加速超高清视讯即服务 (UHD VaaS) 的普及。
- 混合办公模式的兴起推动全球1000强企业升级多摄影机会议室。
- 人工智慧驱动的视讯内容管理提升了受监管行业的合规性和搜寻。
- 欧洲的碳排放目标正促使人们更倾向于选择云端影片而非旅行。
- 市场限制
- 人们持续担忧政府机构和银行、金融服务和保险(BFSI)产业的自主资料储存问题。
- 高昂的频宽成本限制了新兴非洲和加勒比市场的高清视讯质量
- 大型通讯和製造公司复杂旧有系统的集成
- 跨境视讯分发中的智慧财产权和内容授权风险
- 监理展望
- 技术展望
- 波特五力分析
- 买方的议价能力
- 供应商的议价能力
- 新进入者的威胁
- 替代品的威胁
- 竞争对手之间的竞争
- 评估宏观经济趋势的影响
第五章 市场规模与成长预测
- 按平台
- 应用程式管理
- 设备管理
- 网管
- 影片内容管理
- 透过装置
- 行动装置
- 企业运算
- 基于房间的终端
- 透过服务
- 管理
- 专业的
- 按部署模式
- 公共云端
- 私有云端
- 混合云端
- 按最终用户行业划分
- 政府和国防部
- BFSI
- 医疗保健和生命科学
- 资讯科技和通讯
- 媒体与娱乐
- 製造业
- 教育
- 零售与电子商务
- 其他终端用户产业
- 按地区
- 北美洲
- 美国
- 加拿大
- 墨西哥
- 南美洲
- 巴西
- 阿根廷
- 其他南美洲
- 欧洲
- 德国
- 英国
- 法国
- 义大利
- 西班牙
- 其他欧洲地区
- 亚太地区
- 中国
- 日本
- 韩国
- 印度
- 澳洲
- 纽西兰
- 亚太其他地区
- 中东和非洲
- 阿拉伯聯合大公国
- 沙乌地阿拉伯
- 南非
- 其他中东和非洲地区
- 北美洲
第六章 竞争情势
- 策略发展
- 供应商定位分析
- 公司简介
- Cisco Systems Inc.
- Zoom Video Communications Inc.
- Microsoft Corporation
- Google LLC
- Huawei Technologies Co. Ltd.
- Adobe Inc.
- Poly(HP Inc.)
- Avaya LLC
- Brightcove Inc.
- Symphony Communication Services
- Pexip AS
- LogMeIn Inc.(GoTo)
- Agora.io
- RingCentral Inc.
- 8x8 Inc.
- Amazon Web Services(Amazon Chime)
- Orange Business Services
- Vonage
- Tata Communications Ltd.
- Kaltura Inc.
- Genesys Telecommunications Labs
第七章 市场机会与未来展望
The video as a service market stood at USD 7.5 billion in 2024 and is projected to reach USD 14.49 billion by 2030, advancing at a 14.1% CAGR between 2025 and 2030.
Stable cloud bandwidth pricing, deeper 5G penetration, and buyers' preference for subscription billing over capital investment continue to widen adoption. Finance chiefs increasingly tag cloud video spending as a predictable operating cost, which smooths cash flows even when IT budgets tighten. Asia-Pacific is accelerating on the back of new data-centre capacity and extensive 5G standalone roll-outs. Investors reward vendors that pair recurring revenue with compliance-ready features, prompting road maps that emphasise encryption, audit logging, and sovereign deployment templates. Heightened carbon-reduction mandates and hybrid-work retrofit programmes extend demand into facilities budgets, further reinforcing the video as a service market trajectory.
Global VaaS Market Trends and Insights
Shift from Capital Expenditure to Operating Expenditure
Enterprises redirected budgets from proprietary bridges to pay-per-use cloud video throughout 2024. A tier-one US telco reported that moving one-quarter of its video portfolio to a service model cut annual depreciation by double digits and lifted operating free cash flow. Depreciation relief often funds bandwidth upgrades, forming a self-reinforcing flywheel that multiplies usage. Finance units appreciate monthly fee visibility, which cushions VaaS spending during macro headwinds. Vendors respond by simplifying per-user licensing tiers, reducing procurement complexity. Early adopters confirm that the switch trims lifecycle support overhead because cloud platforms absorb version management.
Embedded Video APIs in Customer Applications
A European insurer distributed 40,000 personalised renewal videos in 2025 using an API gateway that pulls real-time policy data into templated scenes. Marketing departments, now direct stakeholders, accelerate purchase cycles that were previously IT-led. Integration of customer relationship management data inside video accelerates retention campaigns and supports dynamic upsell prompts. As API maturity grows, insurers embed consent capture and click-through next to playback, tightening compliance loops. This approach also shrinks hosting costs because content length can be tailored to policy complexity, reducing storage minutes per customer while boosting engagement.
Sovereign Data-Residency Requirements
An Australian banking group migrated all meeting recordings to a locally hosted instance in 2025 to align with updated prudential standards. Geo-fenced traffic routing fragments support operations and raise tooling needs for cross-region monitoring. Vendors must maintain compliance templates for multiple jurisdictions, increasing engineering overhead. Negotiating data-processing agreements lengthens sales cycles in regulated verticals. Some buyers adopt hybrid-cloud models to balance local control with global elasticity, complicating deployment architectures.
Other drivers and restraints analyzed in the detailed report include:
- Low-Latency 5G and Edge Acceleration
- Hybrid-Work Mandates Driving Room Upgrades
- Bandwidth Constraints in Emerging Economies
For complete list of drivers and restraints, kindly check the Table Of Contents.
Segment Analysis
Application-management suites accounted for the largest video as a service market share in 2024, accounting for 34% of global revenue. Enterprises rank meeting orchestration, calendar integration, and real-time security controls as baseline requirements. Low-code connectors allow human resources teams to schedule onboarding sessions without IT tickets, widening user bases and lifting per-tenant minute volumes. Vendors differentiate in meeting-lifecycle visualisations that trace attendee engagement down to reaction-emoji frequency.
Content-management platforms, however, are forecast to outpace other categories with a 16.5% CAGR to 2030. Buyers increasingly view metadata, chaptering, and compliance tagging as core. Providers expose these functions through software development kits that insert playback widgets in employee portals. The video as a service market size for content-centric modules is anticipated to expand as retention policies converge with ESG archiving mandates. Device-management submodules now surface energy metrics, letting sustainability teams track per-endpoint power draw, a value add that ties platform renewal conversations to corporate climate goals.
Enterprise computing endpoints still captured 55% of the video as a service market size in 2024. Desktop and laptop clients integrate single sign-on and policy enforcement, supporting regulated industries. Rich screen-share functions and keyboard accessibility features keep knowledge-worker engagement high. Vendors refine background-noise suppression tuned for open-plan offices, improving clarity without raising bitrate.
Mobile devices will add the most net new users at an 18% CAGR between 2025 and 2030. Flagship handsets now support cinematic mode with real-time depth mapping, encouraging marketing teams to produce internal updates entirely on mobile workflows. This shift compresses video production timelines from weeks to hours. The video as a service market share for mobile is expected to broaden once 5G coverage blankets suburban zones, removing reliability hesitation among field staff. At the room scale, demand coalesces around ceiling-mounted 360-degree cameras with intelligent audio zoning, equalising voice pickup for remote participants.
Video As A Service Market is Segmented by Platform (Application Management, Device Management, and More), Device (Mobility Devices, Enterprise Computing, Room-Based Endpoints), Service (Managed, Professional), Deployment Model (Public Cloud, Private Cloud, Hybrid Cloud), End-User Industry (Government and Defense, BFSI, and More), Geography. The Market Forecasts are Provided in Terms of Value (USD).
Geography Analysis
North America preserved leadership with 38% of global revenue in 2024, underpinned by high cloud maturity, robust capital-market appetite for recurring-revenue software, and early AI content-governance deployments. US enterprises integrate speech analytics with executive briefing libraries, while Canadian bilingual regulations spur automatic translation demand. Government-funded broadband grants sustain rural bandwidth, extending video reach into smaller municipalities. The region is also early to trial edge-compute offload, reducing central-cloud hops for IoT video analytics.
Asia-Pacific is projected to post a 17% CAGR to 2030, the fastest among all territories. Singapore added 150 MW of new colocation capacity in 2024, and Seoul doubled 5G standalone coverage, enabling regional SaaS expansion. Many ASEAN enterprises skipped legacy PBX stages altogether, so first-time video roll-outs are natively cloud-based. Linguistic diversity drives in-app caption localisation, creating competitive differentiation for providers with broad language packs. Edge nodes launched in Indonesia and the Philippines trim first-mile jitter, improving experience parity for archipelagic users.
Europe remains defined by stringent data-protection statutes and aggressive decarbonisation goals. A German automotive group replaced 8 000 inter-city flights with video in 2024, lowering Scope 3 emissions intensity by 4%. Emissions auditors accept VaaS dashboards as proxy evidence for avoided travel, anchoring video budgets inside ESG frameworks. Sovereign-cloud preferences fragment vendor support demands across multiple sub-regions. The bloc's Digital Markets Act pushes for open interoperability, nudging providers to adopt standards-based codecs and authentication plugins.
- Cisco Systems Inc.
- Zoom Video Communications Inc.
- Microsoft Corporation
- Google LLC
- Huawei Technologies Co. Ltd.
- Adobe Inc.
- Poly (HP Inc.)
- Avaya LLC
- Brightcove Inc.
- Symphony Communication Services
- Pexip AS
- LogMeIn Inc. (GoTo)
- Agora.io
- RingCentral Inc.
- 8x8 Inc.
- Amazon Web Services (Amazon Chime)
- Orange Business Services
- Vonage
- Tata Communications Ltd.
- Kaltura Inc.
- Genesys Telecommunications Labs
Additional Benefits:
- The market estimate (ME) sheet in Excel format
- 3 months of analyst support
TABLE OF CONTENTS
1 INTRODUCTION
- 1.1 Study Assumptions and Market Definition
- 1.2 Scope of the Study
2 RESEARCH METHODOLOGY
3 EXECUTIVE SUMMARY
4 MARKET LANDSCAPE
- 4.1 Market Overview
- 4.2 Market Drivers
- 4.2.1 Growing Corporate Shift from CAPEX-Heavy Video Infrastructure to OPEX-Friendly Cloud Subscriptions
- 4.2.2 Surging Consumption of Embedded Video APIs in Customer-Facing Apps (Banking, Retail, Tele-health)
- 4.2.3 Proliferation of Low-Latency 5G Networks in North America and Asia Accelerating UHD VaaS Adoption
- 4.2.4 Hybrid-Work Mandates Triggering Multi-Camera Room Upgrades Across Global 1000 Firms
- 4.2.5 AI-Powered Video Content Management Enhancing Compliance and Searchability for Regulated Industries
- 4.2.6 Rising Carbon-Reduction Targets Driving Preference for Cloud Video over Travel in Europe
- 4.3 Market Restraints
- 4.3.1 Persistent Concerns over Sovereign Data Residency in Government and BFSI Verticals
- 4.3.2 High Bandwidth Costs in Emerging African and Caribbean Markets Limiting HD Video Quality
- 4.3.3 Complex Legacy System Integration in Large Telecom and Manufacturing Enterprises
- 4.3.4 Intellectual-Property and Content-Licensing Risks in Cross-Border Video Distribution
- 4.4 Regulatory Outlook
- 4.5 Technological Outlook
- 4.6 Porter's Five Forces Analysis
- 4.6.1 Bargaining Power of Buyers
- 4.6.2 Bargaining Power of Suppliers
- 4.6.3 Threat of New Entrants
- 4.6.4 Threat of Substitutes
- 4.6.5 Intensity of Competitive Rivalry
- 4.7 Assessment of Impact of Macro-Economic Trends
5 MARKET SIZE AND GROWTH FORECASTS (VALUE)
- 5.1 By Platform
- 5.1.1 Application Management
- 5.1.2 Device Management
- 5.1.3 Network Management
- 5.1.4 Video Content Management
- 5.2 By Device
- 5.2.1 Mobility Devices
- 5.2.2 Enterprise Computing
- 5.2.3 Room-based Endpoints
- 5.3 By Service
- 5.3.1 Managed
- 5.3.2 Professional
- 5.4 By Deployment Model
- 5.4.1 Public Cloud
- 5.4.2 Private Cloud
- 5.4.3 Hybrid Cloud
- 5.5 By End-user Industry
- 5.5.1 Government and Defense
- 5.5.2 BFSI
- 5.5.3 Healthcare and Life Sciences
- 5.5.4 IT and Telecom
- 5.5.5 Media and Entertainment
- 5.5.6 Manufacturing
- 5.5.7 Education
- 5.5.8 Retail and E-Commerce
- 5.5.9 Other End-user Industries
- 5.6 By Geography
- 5.6.1 North America
- 5.6.1.1 United States
- 5.6.1.2 Canada
- 5.6.1.3 Mexico
- 5.6.2 South America
- 5.6.2.1 Brazil
- 5.6.2.2 Argentina
- 5.6.2.3 Rest of South America
- 5.6.3 Europe
- 5.6.3.1 Germany
- 5.6.3.2 United Kingdom
- 5.6.3.3 France
- 5.6.3.4 Italy
- 5.6.3.5 Spain
- 5.6.3.6 Rest of Europe
- 5.6.4 Asia-Pacific
- 5.6.4.1 China
- 5.6.4.2 Japan
- 5.6.4.3 South Korea
- 5.6.4.4 India
- 5.6.4.5 Australia
- 5.6.4.6 New Zealand
- 5.6.4.7 Rest of Asia-Pacific
- 5.6.5 Middle East and Africa
- 5.6.5.1 United Arab Emirates
- 5.6.5.2 Saudi Arabia
- 5.6.5.3 South Africa
- 5.6.5.4 Rest of Middle East and Africa
- 5.6.1 North America
6 COMPETITIVE LANDSCAPE
- 6.1 Strategic Developments
- 6.2 Vendor Positioning Analysis
- 6.3 Company Profiles (includes Global level Overview, Market level overview, Core Segments, Financials as available, Strategic Information, Products and Services, and Recent Developments)
- 6.3.1 Cisco Systems Inc.
- 6.3.2 Zoom Video Communications Inc.
- 6.3.3 Microsoft Corporation
- 6.3.4 Google LLC
- 6.3.5 Huawei Technologies Co. Ltd.
- 6.3.6 Adobe Inc.
- 6.3.7 Poly (HP Inc.)
- 6.3.8 Avaya LLC
- 6.3.9 Brightcove Inc.
- 6.3.10 Symphony Communication Services
- 6.3.11 Pexip AS
- 6.3.12 LogMeIn Inc. (GoTo)
- 6.3.13 Agora.io
- 6.3.14 RingCentral Inc.
- 6.3.15 8x8 Inc.
- 6.3.16 Amazon Web Services (Amazon Chime)
- 6.3.17 Orange Business Services
- 6.3.18 Vonage
- 6.3.19 Tata Communications Ltd.
- 6.3.20 Kaltura Inc.
- 6.3.21 Genesys Telecommunications Labs
7 MARKET OPPORTUNITIES AND FUTURE OUTLOOK
- 7.1 White-space and Unmet-Need Assessment
 视讯即服务市场分析及至2035年预测:按类型、产品类型、服务、技术、组件、应用、部署类型、最终用户、解决方案和模式划分
 全球影片发送服务市场规模、份额、趋势和成长分析报告(2026-2034)视讯即服务 (VaaS) 市场规模、占有率、成长及全球产业分析:依类型、应用和地区划分的洞察与预测 (2026–2034)
 视讯即服务市场规模、份额和成长分析(按应用程式、部署类型、垂直产业和地区划分)-2026-2033年产业预测
 视讯即服务市场按部署模式、组件、组织规模、服务类型和垂直行业划分 - 全球预测 2025-2032 年
 2025-2029 年全球视讯即服务市场
 视讯即服务市场-全球产业规模、份额、趋势、机会与预测(按应用程式、按云端部署模式、按垂直产业、按地区、按竞争细分,2020-2030 年)
 VaaS(视讯即服务)市场规模、份额、趋势分析报告:按应用程式、云端部署模式、产业、地区和细分市场预测,2025-2030 年
 亚太地区视讯即服务市场预测至 2030 年 - 区域分析 - 按部署模式和产业垂直
 北美视讯即服务市场预测至 2030 年 - 区域分析 - 按部署模式和产业垂直