


 |
市场调查报告书
商品编码
1850324
线上广告:市场份额分析、行业趋势、统计数据和成长预测(2025-2030 年)Online Advertising - Market Share Analysis, Industry Trends & Statistics, Growth Forecasts (2025 - 2030) |
||||||
※ 本网页内容可能与最新版本有所差异。详细情况请与我们联繫。
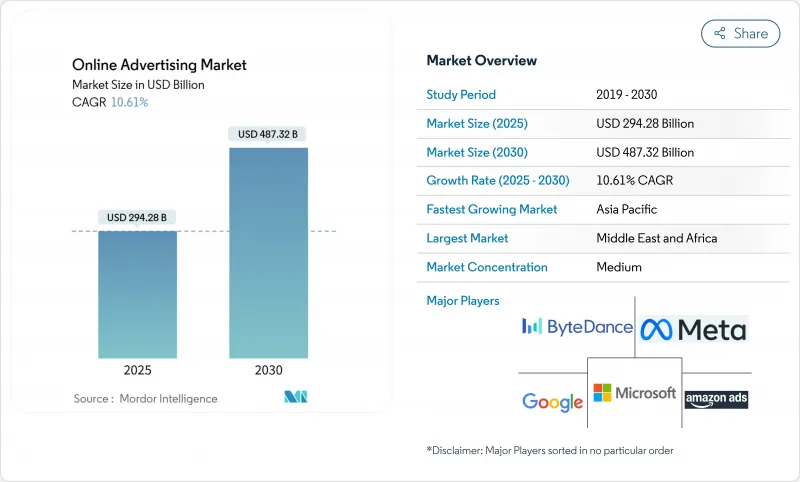
预计到 2025 年,线上广告市场规模将达到 2,942.8 亿美元,到 2030 年将达到 4,873.2 亿美元,2025 年至 2030 年的复合年增长率为 10.61%。
儘管隐私法规日益严格,宏观经济讯号也不稳定,但线上广告市场仍在不断拓展新的接点,收益。广告主维持数位广告预算,因为广告曝光率等级的彙报能够清楚反映营运资金的分配;而发布商则重新调整广告资源配置,转向收益较高的短影片和电商展示广告,即使广告曝光率趋于稳定,这些广告形式也能维持收益。此外,越来越多的中型品牌开始使用自助工具进行程式化购买,透过更均衡地分散支出,而非依赖少数几家跨国公司,从而受益于市场成长。同时,随着智慧型手机的普及,拉丁美洲和中东及非洲地区的广告支出不断增长,区域多元化正在巩固线上广告市场,并降低其对单一地区经济放缓的依赖。
全球线上广告市场趋势与洞察
零售媒体网路加速闭合迴路测量
利用经过认证的交易数据,零售商经营内部广告网络,使消费品品牌能够直接检验销售成长,从而提升了线上广告市场的信任度。最大的电商平台在2024年提交的证券文件中指出,平台广告支出成长速度超过了商品总价值,显示市场对资料丰富的广告位有着强烈的需求。一家美国中型连锁超市部署了一个媒体网络,其广告支出回报率比开放网路横幅广告高出两位数。由于归因分析在同一结帐环境中进行,负责人可以快速将预算重新分配给表现优异的SKU,一家专注于会员忠诚度的连锁药局计划在2025年透过类似的赞助搜寻货架广告位来扩展其模式。
动态的、人工智慧生成的创新优化缩短了生产週期。
2024年,领先的平台将推出即时渲染引擎,让广告主上传核心素材库,演算法会根据观众的属性重新混音。一家欧洲旗舰航空公司报告称,在投放个人创新后的四周内,预订意愿显着提升,随后该策略被应用于座位升级等提升销售。 2025年,一家消费性电子品牌表示,基于人工智慧的影片变体使创新产出提高了五倍,同时保持了品牌安全评分。当创新数量不再限制测试时,多余的响应信号会为平台建议提供信息,从而在无需收集新数据的情况下提高相关性。
欧洲因禁用cookie而造成的讯号损失迫使人们重新审视语境。
2024 年 Google Sandbox 的一项测试表明,在展示广告资源中停用第三方 Cookie 会导致收益损失。德国出版商将广告投放范围扩大到 15,000 个上下文细分,并在 2025 年第一季挽回了一半的 CPM 损失。广告商正转向语义对齐,重振优质内容环境,并部分扭转了先前转向用户生成内容的趋势。
细分市场分析
影片广告目前在网路广告市场中成长最快,年复合成长率高达10%左右,而其他广告形式则趋于成熟。短影片和直播中的购物迭加层缩短了用户在单次观看过程中从看到广告到购买的路径。体育赛事版权拥有者在2024年季后赛中加入了画中画投注提示,而数据面板显示核心粉丝的停留时间增加。当品牌发现影片广告的观看完成率高于可跳过广告形式时,广告支出就会转向那些能够支撑高价位的广告位。随着发布商以更低的广告曝光率量提供更高价值的广告曝光率,线上广告市场也从中受益。展示横幅广告正在演变为更静态但程式化的户外数位体验,这些体验会根据天气和通勤趋势做出反应,从而在桌面环境之外保持相关性。
搜寻广告将继续保持其主导地位,因为它将用户意图讯号转化为实际效果,但随着查询量下降,其成长曲线将趋于平缓。此外,2025年初的点击路径研究表明,用户会进行更深层的滚动浏览,从而有效地扩大付费广告的覆盖范围。这种调整确保了搜寻仍将是网路广告市场的重要收入来源,即便展示广告和社群广告形式不断创新。同时,情境展示广告和户外的整合也证明,横幅广告的演变能够带来新的预算,而不是蚕食现有预算。
线上广告市场按广告形式(社群媒体、搜寻引擎及其他)、平台(行动装置、桌上型电脑、笔记型电脑及其他)、终端用户产业(汽车、零售、电子商务及其他)和地区进行细分。市场预测以美元计价。
区域分析
亚太地区约占全球广告支出的34%,这得益于其行动优先的人口结构和超级应用生态系统。中国的直播电商节在同一影片剪辑中实现了数十亿次的微互动,进一步巩固了该地区在线上广告市场的主导地位。在印度,统一支付介面(UPI)扩展到功能手机,使得先前难以触及的农村地区也能投放定向广告。印尼和马来西亚的通讯业者正在推出分级5G套餐,打造低延迟的广告资源,在不降低价格分布的前提下维持成长,使该地区能够占据更大的市场份额。
北美地区凭藉着先进的竞标工具和成熟的混合型电视生态系统,持续维持最高的每用户收入。串流家庭用户如今已占35岁以下观众的大多数,而2025年初的收视率调查机构更新已将线性电视和数位电视的覆盖范围整合为单一货币单位,简化了跨屏购买流程。零售商正在扩展店内数位显示屏,使其兼具需求端平台(DSP)的终端功能,从而允许广告商将宣传活动地理围栏至特定门店群,并透过会员ID匹配销售数据。这种融合支撑了高额CPM,并将北美地区定位为线上广告市场的中心。
儘管起步基数较低,但中东和非洲地区仍保持着两位数的复合年增长率,这主要得益于人口结构的年轻化和海底光缆的快速扩张。政府支持的智慧城市计划正在整合程序化广告牌,这些广告牌可从中央广告交易平臺获取动态创新,从而为该地区打造独特的定向广告平台。内容创作者正在使用阿拉伯语、英语和法语进行内容变现,而平台也报告称,透过多语言定向,广告相关性得分有所提高。海湾地区的航空公司在2025年初实施了城市特定的重新导向广告,以填补淡季航线的客流,这充分展现了线上广告市场的跨境扩展能力。
其他福利:
- Excel格式的市场预测(ME)表
- 3个月的分析师支持
目录
第一章 引言
- 研究假设和市场定义
- 调查范围
第二章调查方法
第三章执行摘要
第四章 市场情势
- 市场概览
- 市场驱动因素
- 零售媒体网路收益消费品品牌实现闭合迴路广告支出报酬率
- 人工智慧驱动的动态创新优化降低了北美地区的每次转换成本 (CPA)。
- 5G赋能的身临其境型影片广告将推动东南亚地区的广告支出。
- 超级应用商务与搜寻整合推动中国与东南亚应用程式内广告的发展
- 市场限制
- 欧盟第三方 Cookie 禁令导致的讯号损失削弱了定向投放效果。
- 英国和法国的数位服务税对平台利润带来压力
- 监理展望
- 技术展望(人工智慧、隐私沙箱、无尘室)
- 波特五力分析
- 新进入者的威胁
- 供应商的议价能力
- 买方的议价能力
- 替代品的威胁
- 竞争的激烈程度
第五章 市场规模与成长预测
- 广告格式
- 社群媒体
- 搜寻引擎
- 影片
- 电子邮件
- 其他广告形式
- 按平台
- 移动的
- 桌上型电脑和笔记型电脑
- 其他平台
- 最终用户
- 车
- 零售与电子商务
- 医疗保健和製药
- BFSI
- 通讯
- 其他行业
- 按地区
- 北美洲
- 美国
- 加拿大
- 墨西哥
- 南美洲
- 巴西
- 阿根廷
- 其他南美
- 欧洲
- 德国
- 英国
- 法国
- 义大利
- 西班牙
- 其他欧洲地区
- 亚太地区
- 中国
- 日本
- 韩国
- 印度
- 澳洲
- 纽西兰
- 其他亚太地区
- 中东和非洲
- 阿拉伯聯合大公国
- 沙乌地阿拉伯
- 南非
- 其他中东和非洲地区
- 北美洲
第六章 竞争情势
- Strategic Developments
- Vendor Positioning Analysis
- 公司简介
- Google LLC
- Meta Platforms Inc.
- Amazon.com Inc.(Amazon Ads)
- ByteDance Ltd.(TikTok)
- Microsoft Corp.(LinkedIn, Bing Ads)
- Alibaba Group(Alimama)
- Tencent Holdings Ltd.(WeChat, Tencent Ads)
- Baidu Inc.
- Snap Inc.
- Pinterest Inc.
- X Corp.(Twitter)
- Spotify Technology SA
- Roku Inc.
- Comcast Corp.(FreeWheel)
- Samsung Ads
- Verizon Media(Yahoo)
- Adobe Inc.
- Oracle Advertising
- The Trade Desk Inc.
- Magnite Inc.
- Criteo SA
- Taboola Inc.
- PubMatic Inc.
第七章 市场机会与未来展望
The online advertising market size stands at USD 294.28 billion in 2025 and is projected to reach USD 487.32 billion by 2030, reflecting a 10.61% compound annual growth rate (CAGR) over 2025-2030.
The online advertising market continues to monetise emerging touchpoints despite stricter privacy rules and uneven macroeconomic signals. Advertisers keep digital budgets intact because impression-level reporting clarifies working-capital deployment, while publishers rebalance inventory toward higher-yield short-form video and commerce-linked display that sustain revenue even when raw impressions stabilise. Growth also benefits from a rising cohort of medium-sized brands that buy programmatically through self-serve tools, spreading spend more evenly rather than relying on a small group of multinationals. Simultaneously, regional diversification secures the online advertising market because incremental outlay is coming from Latin America, the Middle East, and Africa as smartphone adoption rises, reducing exposure to single-region slowdowns.
Global Online Advertising Market Trends and Insights
Retail media networks accelerate closed-loop measurement
Retailers wielding authenticated transaction data now operate in-house ad networks that let consumer-goods brands verify sales lift directly, raising confidence in the online advertising market. A 2024 securities filing by the largest e-commerce marketplace showed on-platform ad spend climbing faster than gross merchandise volume, signalling a strong appetite for data-rich placements . Mid-tier U.S. grocery chains followed with media networks that delivered double-digit return-on-ad-spend gains versus open-web banners. As attribution occurs inside the same checkout environment, marketers recycle budget rapidly toward top-performing SKUs, and loyalty-centric pharmacy chains plan similar sponsored search shelves in 2025, broadening the model.
AI-generated dynamic creative optimisation compresses production cycles
Major platforms deployed real-time rendering engines in 2024, enabling advertisers to upload a core asset library that algorithms remix according to viewer attributes. A European flag-carrier airline reported measurable booking-intent gains within four weeks of personalised creatives, then applied the tactic to upsell units such as seat upgrades. In 2025 a consumer-electronics brand stated that AI-based video variants multiplied creative output fivefold while matching brand-safety scores. As creative volume ceases to constrain testing, extra response signals feed platform recommendations, improving relevance without new data collection.
European signal loss from cookie deprecation forces contextual renaissance
Google Sandbox tests in 2024 indicated revenue loss when display inventory lacked third-party cookies . A German publisher expanded to 15,000 contextual segments and recovered half the lost CPM by Q1 2025. Advertisers pivot to semantic alignment, reviving premium editorial environments and partly reversing earlier movement toward user-generated content.
Other drivers and restraints analyzed in the detailed report include:
- 5G unlocks immersive video across South-East Asia
- Commerce-search convergence inside super-apps fuels in-app placements
- Digital-services taxes pressure platform and advertiser margins
For complete list of drivers and restraints, kindly check the Table Of Contents.
Segment Analysis
Video advertising currently logs the fastest growth within the online advertising market size, climbing at a mid-teen CAGR while other formats mature. Short-form vertical clips and live-stream shopping overlays shorten the path from impression to purchase in one viewing session. Streaming sports rights holders added picture-in-picture wagering prompts during the 2024 playoffs, and dashboards showed extended dwell times among core fans. As brands observe higher completion rates versus skippable formats, spend shifts toward inventory that justifies premium pricing. The online advertising market benefits because publishers can package fewer but more valuable impressions. Display banners, though steadier, evolve into programmatic digital-out-of-home screens that react to weather or commuter flows, maintaining relevance outside desktop environments.
Search advertising protects its commanding place by converting intent signals into performance, yet its growth curve flattens as query volume decelerates. Engines now embed generative overviews that mix organic answers with sponsored placements, and click-path studies in early 2025 showed deeper scrolling, effectively expanding paid real estate. This adjustment keeps search a cash generator within the online advertising market, even as display and social formats innovate. Meanwhile, contextual display and out-of-home linkages prove that banner evolution can secure new budgets rather than cannibalise existing ones.
Online Advertising Market is Segmented by Advertising Format (Social Media, Search Engine, and More), Platform (Mobile, Desktop and Laptop, and Other Platforms), End-User Vertical (Automotive, Retail and E-Commerce, and More), and Geography. The Market Forecasts are Provided in Terms of Value (USD).
Geography Analysis
Asia-Pacific commands roughly 34% of global spend, underpinned by mobile-first populations and super-app ecosystems. Live-commerce festivals in China register billions of micro-interactions that convert inside the same short-video clip, reinforcing the region's primacy in the online advertising market. India's extension of the Unified Payments Interface to feature phones promises addressable advertising in rural districts previously out of reach. Indonesian and Malaysian telcos are rolling out tiered 5G packages, creating low-latency inventory that sustains growth without lowering price floors, positioning the region for incremental share.
North America preserves the highest revenue per user, benefitting from sophisticated auction tooling and a mature hybrid-TV ecosystem. Streaming households now form the majority of under-35 viewers, and a ratings-agency update in early 2025 merged linear and digital reach on a single currency line, simplifying cross-screen buys. Retailers extend in-store digital displays that double as demand-side platform endpoints, letting advertisers geofence campaigns around specific store clusters and then reconcile sales via loyalty IDs. This fusion underpins premium CPMs and keeps North America central to the online advertising market.
The Middle East and Africa, while starting from a lower base, shows sustained double-digit CAGR as youthful demographics combine with expanding under-sea fibre. Government-backed smart-city projects integrate programmatic billboards that receive dynamic creative from central ad exchanges, creating an addressable surface unique to the region. Content creators monetise in Arabic, English, and French, and platforms report that multilingual targeting lifts relevance scores. Tourism recovery further boosts hospitality spend; Gulf airlines ran city-specific retargeting flights in early 2025 that filled shoulder-season routes, demonstrating cross-border scalability for the online advertising market.
- Google LLC
- Meta Platforms Inc.
- Amazon.com Inc. (Amazon Ads)
- ByteDance Ltd. (TikTok)
- Microsoft Corp. (LinkedIn, Bing Ads)
- Alibaba Group (Alimama)
- Tencent Holdings Ltd. (WeChat, Tencent Ads)
- Baidu Inc.
- Snap Inc.
- Pinterest Inc.
- X Corp. (Twitter)
- Spotify Technology S.A.
- Roku Inc.
- Comcast Corp. (FreeWheel)
- Samsung Ads
- Verizon Media (Yahoo)
- Adobe Inc.
- Oracle Advertising
- The Trade Desk Inc.
- Magnite Inc.
- Criteo S.A.
- Taboola Inc.
- PubMatic Inc.
Additional Benefits:
- The market estimate (ME) sheet in Excel format
- 3 months of analyst support
TABLE OF CONTENTS
1 INTRODUCTION
- 1.1 Study Assumptions and Market Definition
- 1.2 Scope of the Study
2 RESEARCH METHODOLOGY
3 EXECUTIVE SUMMARY
4 MARKET LANDSCAPE
- 4.1 Market Overview
- 4.2 Market Drivers
- 4.2.1 Retail Media Networks Monetization Driving Closed-Loop ROAS for CPG Brands
- 4.2.2 AI-Generated Dynamic Creative Optimisation Reducing CPA in North America
- 4.2.3 5G-Enabled Immersive Video Ads Accelerating Spend in South-East Asia
- 4.2.4 Commerce-Search Integration in Super-Apps Fueling In-App Ads Across China and SEA
- 4.3 Market Restraints
- 4.3.1 Signal-Loss from Third-Party-Cookie Deprecation in EU Undermining Targeting
- 4.3.2 Digital-Services Taxes in UK and France Squeezing Platform Margins
- 4.4 Regulatory Outlook
- 4.5 Technological Outlook (AI, Privacy Sandbox, Clean Rooms)
- 4.6 Porter's Five Forces Analysis
- 4.6.1 Threat of New Entrants
- 4.6.2 Bargaining Power of Suppliers
- 4.6.3 Bargaining Power of Buyers
- 4.6.4 Threat of Substitutes
- 4.6.5 Intensity of Rivalry
5 MARKET SIZE AND GROWTH FORECASTS (VALUE)
- 5.1 By Advertising Format
- 5.1.1 Social Media
- 5.1.2 Search Engine
- 5.1.3 Video
- 5.1.4 Email
- 5.1.5 Other Advertising Formats
- 5.2 By Platform
- 5.2.1 Mobile
- 5.2.2 Desktop and Laptop
- 5.2.3 Other Platforms
- 5.3 By End-user Vertical
- 5.3.1 Automotive
- 5.3.2 Retail and E-commerce
- 5.3.3 Healthcare and Pharma
- 5.3.4 BFSI
- 5.3.5 Telecom
- 5.3.6 Other Verticals
- 5.4 By Geography
- 5.4.1 North America
- 5.4.1.1 United States
- 5.4.1.2 Canada
- 5.4.1.3 Mexico
- 5.4.2 South America
- 5.4.2.1 Brazil
- 5.4.2.2 Argentina
- 5.4.2.3 Rest of South America
- 5.4.3 Europe
- 5.4.3.1 Germany
- 5.4.3.2 United Kingdom
- 5.4.3.3 France
- 5.4.3.4 Italy
- 5.4.3.5 Spain
- 5.4.3.6 Rest of Europe
- 5.4.4 Asia-Pacific
- 5.4.4.1 China
- 5.4.4.2 Japan
- 5.4.4.3 South Korea
- 5.4.4.4 India
- 5.4.4.5 Australia
- 5.4.4.6 New Zealand
- 5.4.4.7 Rest of Asia-Pacific
- 5.4.5 Middle East and Africa
- 5.4.5.1 United Arab Emirates
- 5.4.5.2 Saudi Arabia
- 5.4.5.3 South Africa
- 5.4.5.4 Rest of Middle East and Africa
- 5.4.1 North America
6 COMPETITIVE LANDSCAPE
- 6.1 Strategic Developments
- 6.2 Vendor Positioning Analysis
- 6.3 Company Profiles (includes Global level Overview, Market level overview, Core Segments, Financials as available, Strategic Information, Products and Services, and Recent Developments)
- 6.3.1 Google LLC
- 6.3.2 Meta Platforms Inc.
- 6.3.3 Amazon.com Inc. (Amazon Ads)
- 6.3.4 ByteDance Ltd. (TikTok)
- 6.3.5 Microsoft Corp. (LinkedIn, Bing Ads)
- 6.3.6 Alibaba Group (Alimama)
- 6.3.7 Tencent Holdings Ltd. (WeChat, Tencent Ads)
- 6.3.8 Baidu Inc.
- 6.3.9 Snap Inc.
- 6.3.10 Pinterest Inc.
- 6.3.11 X Corp. (Twitter)
- 6.3.12 Spotify Technology S.A.
- 6.3.13 Roku Inc.
- 6.3.14 Comcast Corp. (FreeWheel)
- 6.3.15 Samsung Ads
- 6.3.16 Verizon Media (Yahoo)
- 6.3.17 Adobe Inc.
- 6.3.18 Oracle Advertising
- 6.3.19 The Trade Desk Inc.
- 6.3.20 Magnite Inc.
- 6.3.21 Criteo S.A.
- 6.3.22 Taboola Inc.
- 6.3.23 PubMatic Inc.
7 MARKET OPPORTUNITIES AND FUTURE OUTLOOK
- 7.1 White-Space and Unmet-Need Assessment
 情境广告市场:2025-2032年全球预测(按类型、广告格式、装置类型、使用者活动、受众类型和最终使用者划分)
 2025年全球网路广告市场报告
 全球网路广告市场全球线上广告市场
 全球情境广告市场:市场规模、份额、趋势分析(按类型、方法、部署方式、行业和地区)、展望和未来预测(2025-2032 年)
 日本线上广告市场报告,按类型(搜寻、显示、分类、影片等)、平台(行动、桌上型电脑和笔记型电脑等)、最终用户(汽车、零售、医疗保健、BFSI、电信等)和地区划分,2025 年至 2033 年线上广告市场规模、份额、趋势分析报告:按类型、平台、定价模式、最终用途、地区、细分预测,2025-2030 年
 全球线上广告市场:产业分析、规模、份额、成长、趋势和预测(2025-2032)2025年情境广告全球市场报告
 线上广告市场 - 全球行业规模、份额、趋势、机会和预测,按广告形式(社交媒体、搜寻引擎、影片、电子邮件、其他)、按平台、按地区和竞争,2020-2030F