


 |
市场调查报告书
商品编码
1850969
光纤电缆:市场份额分析、行业趋势、统计数据和成长预测(2025-2030 年)Fiber Optic Cable - Market Share Analysis, Industry Trends & Statistics, Growth Forecasts (2025 - 2030) |
||||||
※ 本网页内容可能与最新版本有所差异。详细情况请与我们联繫。
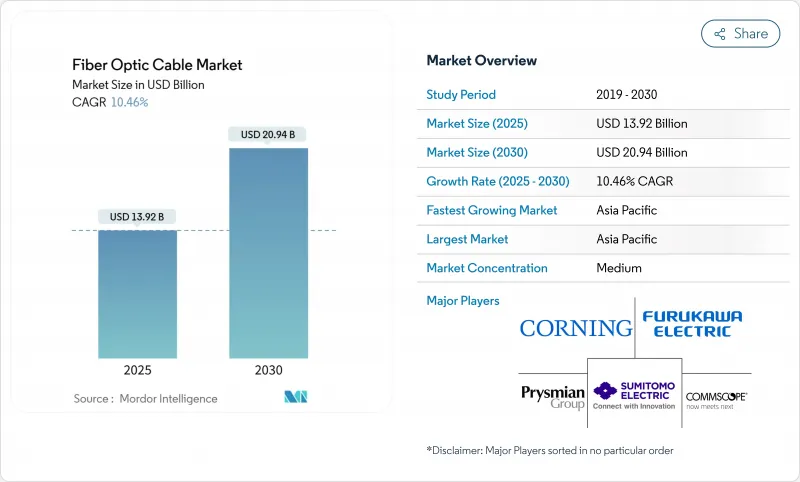
预计到 2025 年,光纤电缆市场规模将达到 139.2 亿美元,到 2030 年将达到 209.4 亿美元,在预测期(2025-2030 年)内,复合年增长率将达到 10.46%。
随着人工智慧工作负载对超低延迟的需求不断增长,5G网路密集化推动了光纤深度覆盖架构的发展,以及超大规模资料中心营运商获取前所未有的光缆容量以绕过传统营运商,光纤市场成长速度将加快。地缘政治紧张局势也促使科技巨头拓展海底线路,即使在成熟经济体中,光纤市场规模也不断扩大。在供应方面,垂直整合、区域製造指令以及对多芯和中空芯技术的投资正在重塑竞争动态,并将光纤定位为陆地和海底连接的关键骨干。日益严格的永续性目标进一步推动了从铜缆到低碳玻璃的转变,预示着光纤市场将持续扩张。
全球光纤电缆市场趋势与洞察
高速网路的普及和全球数据流量的快速成长
频宽需求正迅速成长,营运商如今将光纤视为唯一能够满足 8K 视讯、云端游戏和即时协作等余量的基础设施。全球 IP 流量正以每年 22% 的速度成长,其中串流媒体和云端服务占用了 82% 的流量。日本研究人员已证明,使用 1505 个波长,标准光纤即可实现 402 Tb/s 的传输速度,这证明如今的电缆投资足以支撑未来数十年的逐步升级,而无需进行大规模更换。此类突破使通讯业者更有信心将资金投入高密度光纤走廊建设,而不是用于零散的铜缆升级。因此,随着已开发地区和新兴地区都朝着Gigabit级接取目标迈进,光纤电缆市场正经历更快的订单週期、更长的合约期限和更广泛的地理部署。
加速5G部署和光纤到府(FTTx)部署
每个 5G小型基地台都需要专用光纤回程传输,所需的线缆数量是传统 4G 基地台的三到五倍。 AT&T 将其到 2030 年部署 6,000 万个光纤站点的目标规模扩大到 2,380 万个站点,这表明无线接入密度的增加正在重振光纤电缆市场。边缘云端架构透过要求基地台和微型资料中心之间建立低延迟链路,进一步推动了这一趋势,并将光纤延伸到更远的郊区网路。通讯业者报告称,当对称光纤为其服务提供支援时,5G 用户的每用户收入提高了 15% 至 25%,这促使营运商在未来几年内持续采购高密度带状光缆和铠装光缆。随着通讯业者竞相铺设新线路,竞争日益激烈,这也印证了光纤作为超低延迟行动服务关键基础的作用。
高昂的土木工程成本和复杂的土地权利
在主要城市,建筑劳动力短缺和监管瓶颈导致地下电缆安装成本飙升至每英尺24美元,令资本预算捉襟见肘,部署速度也随之放缓。场地核准可能需要6到18个月,这不仅会延迟服务开通,还会增加过渡期资金筹措成本。据估计,每年约有31,500名熟练技术人员短缺,推高了薪资水准;而环境评估则会使计划总成本增加5万至20万美元。这些摩擦迫使营运商优先考虑高密度走廊而非普遍建设,从而减缓了光纤电缆市场中对成本敏感区域的潜在成长。
细分市场分析
2024年,铠装光纤电缆产品占光纤电缆市场38.0%的份额,显示营运商在电缆穿越崎岖地形或公共道路时更倾向于机械强度高的设计。然而,带状光纤电缆预计将以11.4%的复合年增长率占据主导地位,这主要得益于大规模熔接技术的普及,该技术可将现场施工时间缩短高达80%。带状光纤电缆的无凝胶版本还能减少清理工作,进而加快超大规模资料中心的建置速度。预计到2030年,带状光纤电缆的市场规模将成长一倍以上。
供应商不断改进采用波纹钢板和防水胶带的铠装结构,主要针对海底导体和易受挖掘损坏的都市区导体。相反,在安全园区环境中,非铠装或分支光缆则更受欢迎,因为在这些环境中,灵活性和小弯曲半径比抗压性更为重要。由于安装人工成本占计划成本的一半以上,网路规划人员正转向高密度带状光缆或微导管解决方案,以减少熔接次数,从而进一步提升带状光缆在光纤电缆市场的份额。
到2024年,单模裸线将占据光纤电缆市场63.2%的份额,是城域网路、远距和海底光缆等数百公里链路的关键组成部分。然而,到2030年,多模光纤的复合年增长率将达到13.2%,这主要得益于机架顶部资料中心连接(传输距离以100-150公尺为主)以及高性价比的VCSEL收发器。中空光纤原型可望延迟降低30%,吸引演算法交易平台和需要飞秒同步的科学研究站点。
随着云端运营商园区拓朴结构的扁平化,OM5级光纤搭配400G-SR8收发器可实现机架间800Gbps的传输速度,进而兼顾成本与效能目标。同时,单模光纤的创新正朝着超低损耗和多芯格式发展,无需中继器即可跨越海洋盆地,扩大了高端海底光缆市场的份额。因此,模数选择取决于传输距离和频宽的经济性。单模光纤继续主导骨干网路路由,而多模光纤则在传输距离有限的超大规模机房中占据了一定的市场份额。
光纤电缆市场报告按电缆类型(铠装电缆、非铠装电缆、带状电缆、其他)、光纤模式(单模光纤、多模光纤、塑胶光纤)、安装类型(架空/架空、地下/埋设、其他)、最终用户产业(电信、电力光纤)、安装类型(架空/架空、地下/埋设、其他)、最终用户产业(通讯、电力公用事业和智慧电网、国防公用事业和航太、工业自动化和其他航空区域进行自动化。
区域分析
到2030年,亚太地区将占全球收入的58.7%,并维持12.6%的最高复合年增长率。这反映了中国「一带一路」倡议下政府支持的计划,以及印度有利于国内登陆站的新规。日本实验室不断刷新光传输量纪录,增强了研发实力,巩固了该地区的领先地位。韩国和日本的高密度5G网路将增加每平方公里的光纤数量,东南亚财团正在扩展海底丛集,使新加坡成为事实上的区域枢纽。然而,南海的政治紧张局势增加了光缆被切断的风险,并促使企业采取冗余路由策略,从而推动了光纤电缆市场资本支出的成长。
北美作为全球第二大区域,正从待开发区转型为现代化改造。耗资424.5亿美元的BEAD计画正在推动区域网路建设,而AT&T将消费者光纤资产出售给Lumen等併购案例正在再形成竞争格局。国内内容强制性要求将推动北卡罗来纳州和南卡罗来纳州的容量扩张,使网路供应与人工智慧驱动的频宽需求成长相匹配。欧洲将在波罗的海事件后加强海底网路韧性,并投资建造多登陆点架构以保护数位主权。
中东、非洲和南美洲正在崛起,成为下一波热点地区。海湾地区的通讯业者正利用其地理优势,建造跨洲光缆,其中「2Africa环线」将新增4.5万公里的容量,从而降低非洲各地的延迟和批发价格。地中海地区的企业,例如Medusa,正在将其业务拓展至北非,而巴西则在拉丁美洲引领光纤部署,并推出了其云端区域。儘管资金筹措、监管透明度和技术纯熟劳工供应仍然是挑战,但行动数据普及率的不断提高为光纤电缆市场带来了令人瞩目的长期发展前景。
其他福利:
- Excel格式的市场预测(ME)表
- 3个月的分析师支持
目录
第一章 引言
- 研究假设和市场定义
- 调查范围
第二章调查方法
第三章执行摘要
第四章 市场情势
- 市场概览
- 市场驱动因素
- 高速网路的普及和全球数据流量的快速成长
- 加速 5G 部署和光纤到府 (FTTx) 部署
- 对超大规模资料中心互连的需求日益增长
- 政府支持的农村宽频和数位包容计划
- 海底航线多元化助力地缘政治韧性
- 永续性措施以低碳玻璃纤维取代铜
- 市场限制
- 高昂的土木工程成本和复杂的道路用地
- 原物料价格波动和氦气供应限制
- 海底航线环境许可审核延误
- 在饱和的大都会市场,电信业者的资本支出停滞不前。
- 价值链/供应链分析
- 监管环境
- 技术展望
- 多芯和中空芯光纤蓝图
- 整合光电和硅光电收发器
- 定价分析
- 波特五力分析
- 新进入者的威胁
- 买方的议价能力
- 供应商的议价能力
- 替代品的威胁
- 竞争对手之间的竞争
- 投资分析
- 新冠疫情影响及恢復分析
第五章 市场规模与成长预测
- 按电缆类型
- 铠装电缆
- 非铠装电缆
- 扁平电缆
- 其他的
- 透过光纤模式
- 单模光纤
- 多模光纤
- 塑胶光纤
- 按安装类型
- 空中/头顶
- 地下/埋藏
- 潜水艇/水下
- 室内/入口电缆
- 按最终用户行业划分
- 通讯
- 资料中心和云端服务供应商
- 电力公司和智慧电网
- 国防/航太
- 工业自动化与控制
- 医疗保健和医学
- 石油、天然气和海上作业
- 其他的
- 按地区
- 北美洲
- 美国
- 加拿大
- 墨西哥
- 南美洲
- 巴西
- 阿根廷
- 其他南美洲
- 欧洲
- 德国
- 英国
- 法国
- 义大利
- 西班牙
- 其他欧洲地区
- 亚太地区
- 中国
- 日本
- 印度
- 韩国
- 亚太其他地区
- 中东
- 沙乌地阿拉伯
- 阿拉伯聯合大公国
- 土耳其
- 其他中东地区
- 非洲
- 南非
- 奈及利亚
- 埃及
- 其他非洲地区
- 北美洲
第六章 竞争情势
- 市场集中度
- 策略趋势
- 市占率分析
- 公司简介
- Prysmian Group
- Corning Inc.
- Sumitomo Electric Industries Ltd.
- Furukawa Electric Co., Ltd.
- CommScope Holding Company Inc.
- Fujikura Ltd.
- Nexans SA
- LS Cable and System Ltd.
- OFS Fitel LLC
- Sterlite Technologies Ltd.
- Hengtong Optic-Electric Co. Ltd.
- Yangtze Optical Fiber and Cable(JOFC)
- ZTT Group
- Proterial Ltd.
- Finolex Cables Ltd.
- Belden Inc.
- General Cable Corp.
- Hexatronic Group AB
- HMN Tech Co., Ltd.
- Taihan Fiberoptics Co., Ltd.
第七章 市场机会与未来展望
The Fiber Optic Cable Market size is estimated at USD 13.92 billion in 2025, and is expected to reach USD 20.94 billion by 2030, at a CAGR of 10.46% during the forecast period (2025-2030).
Growth accelerates as artificial-intelligence workloads demand ultra-low latency, 5G densification pushes fiber-deep architectures, and hyperscale data-center operators reserve unprecedented cable capacity to bypass legacy carriers. Government-funded digital-inclusion programs mandate future-proof infrastructure, while geopolitical tensions prompt tech giants to diversify submarine routes, therefore widening the addressable fiber optic cable market even in mature economies. On the supply side, vertical integration, regional manufacturing mandates, and investments in multi-core and hollow-core technologies reshape competitive dynamics, positioning fiber as the definitive backbone for both terrestrial and subsea connectivity. Intensifying sustainability goals further reinforce the shift from copper to low-carbon glass, signalling a durable expansion trajectory for the fiber optic cable market.
Global Fiber Optic Cable Market Trends and Insights
Increasing Penetration of High-Speed Internet and Global Data-Traffic Surge
Bandwidth demand is rising so quickly that operators now treat fiber as the only infrastructure with adequate headroom for 8K video, cloud gaming, and real-time collaboration. Global IP traffic is expanding at 22% per year, with streaming and cloud services absorbing 82% of the load, a scenario that underscores why the fiber optic cable market continues to accelerate. Researchers in Japan have demonstrated 402 Tb/s transmission across standard fiber using 1,505 wavelengths, proving that today's cable investments will sustain decades of incremental upgrades without wholesale replacement. Such breakthroughs give carriers confidence to allocate capital toward dense fiber corridors rather than incremental copper fixes. Consequently, the fiber optic cable market registers faster order cycles, longer contract horizons, and broader geographic rollout plans as both developed and emerging regions converge on gigabit-class access targets.
Accelerated 5G Roll-Outs and Fiber-Deep FTTx Deployments
Every 5G small-cell demands dedicated fiber backhaul, multiplying cable counts by three to five times relative to legacy 4G sites. AT&T's expansion to 23.8 million fiber locations, with an ambition of 60 million by 2030, illustrates how radio-access densification fuels the fiber optic cable market. Edge-cloud architectures amplify this pull by requiring low-latency links between towers and micro-data centers, thus extending fiber deeper into suburban grids. Operators report 15-25% higher 5G revenue per user when symmetrical fiber underpins the service, a financial lift that catalyzes multi-year procurement of high-density ribbon and armored cables. Competitive intensity escalates as carriers race to light new corridors, confirming fiber's role as the indispensable substrate for ultra-low-latency mobile services.
High Civil-Works Cost and Right-of-Way Complexities
Construction labor shortages and regulatory bottlenecks elevate underground installation expenses to USD 24 per foot in major cities, squeezing capital budgets and tempering rollout speeds. Right-of-way approvals can stretch 6-18 months, delaying service launches and raising interim financing costs. Skilled-technician gaps are estimated at 31,500 annually inflate wages, while environmental surveys add USD 50,000-200,000 to project totals. These frictions compel operators to prioritize high-density corridors over universal builds, thereby slowing addressable growth in cost-sensitive pockets of the fiber optic cable market.
Other drivers and restraints analyzed in the detailed report include:
- Expanding Hyperscale Data-Center Interconnect Demand
- Government-Backed Rural Broadband and Digital-Inclusion Programs
- Price Volatility in Raw Materials and Helium Supply Constraints
For complete list of drivers and restraints, kindly check the Table Of Contents.
Segment Analysis
Armored products represented 38.0% of the fiber optic cable market in 2024, evidencing operator preference for mechanically robust designs whenever cables traverse harsh terrain or public rights-of-way. Ribbon formats, however, are on course to outpace all others with an 11.4% CAGR, owing to mass-fusion splicing that trims field time by as much as 80%. Ribbon's gel-free variants also cut cleanup, enhancing velocity in hyperscale data-center builds. The fiber optic cable market size for ribbon architectures is projected to more than double by 2030 as labor savings outweigh higher per-meter costs.
Suppliers continue refining armored constructions with corrugated steel and water-blocking tapes, targeting submarine lead-ins and urban conduits vulnerable to excavation damage. Conversely, non-armored and breakout cables stay popular inside secured campuses where flexibility and tight bend radii matter more than crush resistance. Because installation labor can account for over half the project bill, network planners lean toward high-count ribbon or micro-duct solutions that slash splice events, further reinforcing ribbon's fast-rising share within the fiber optic cable market.
Single-mode strands held 63.2% of the fiber optic cable market share during 2024, remaining indispensable for metropolitan, long-haul, and submarine links that span hundreds of kilometers. Yet multi-mode is poised for a 13.2% CAGR through 2030, a resurgence propelled by data-center top-of-rack connections where 100-150 m reach and cost-efficient VCSEL transceivers prevail. Hollow-core prototypes promise latency reductions of 30%, attracting algorithmic trading platforms and scientific sites requiring femtosecond-level synchronization.
As cloud operators flatten their campus topologies, OM5-grade fiber coupled with 400G-SR8 transceivers delivers 800 Gbps rack-to-rack, aligning cost and performance targets. Meanwhile, single-mode innovation pivots toward ultra-low-loss and multi-core formats capable of crossing ocean basins without repeaters, expanding the premium subsea slice of the fiber optic cable market size. The modal mix, therefore, hinges on distance-bandwidth economics: single-mode continues its reign in backbone routes, while multi-mode secures a volume foothold inside hyperscale halls where reach envelopes remain modest.
The Fiber Optic Cable Market Report is Segmented by Cable Type (Armored Cable, Non-Armored Cable, Ribbon Cable, and Other), Fiber Mode (Single-Mode Fiber, Multi-Mode Fiber, and Plastic Optical Fiber), Installation Type (Aerial/Overhead, Underground/Buried, and More), End-User Industry (Telecommunication, Power Utilities and Smart Grid, Defense and Aerospace, Industrial Automation and Control, and More), and Geography.
Geography Analysis
Asia Pacific dominates with a 58.7% revenue chunk and the highest 12.6% CAGR through 2030, a reflection of state-backed megaprojects under China's Belt and Road umbrella and India's new rules favouring domestic landing stations. Japanese laboratories continue to set optical-throughput records, an R&D edge that cements regional leadership. South Korea and Japan's dense 5G grids escalate fiber counts per square kilometre, while Southeast Asian consortia enlarge submarine clusters that turn Singapore into a de facto regional hub. Political frictions in the South China Sea, however, raise cable-cut risks, prompting redundant routing strategies that sustain elevated capex in the fiber optic cable market.
North America, the second-largest territory, pivots from greenfield to modernization cycles. The USD 42.45 billion BEAD program keeps rural builds active, whereas mergers such as AT&T's sale of consumer fiber assets to Lumen reshape the competitive canvas. Domestic-content mandates foster capacity expansions in North Carolina and South Carolina, aligning supply with escalating AI-driven bandwidth demand. Europe reinforces subsea resilience following Baltic incidents, investing in multi-landing architectures that safeguard digital sovereignty; projects such as IOEMA illustrate the continent's resolve to diversify pathways.
The Middle East, Africa, and South America emerge as next-wave hotspots. Gulf carriers leverage geographic crossroads to host multi-continent cables, while the 2Africa ring brings 45,000 km of new capacity that slashes latency and wholesale prices across Africa. Mediterranean ventures like Medusa extend reach into North Africa, whereas Brazil leads Latin American fiber rollouts tied to cloud-region launches. Financing, regulatory clarity, and skilled-labor availability remain challenges, but higher mobile-data adoption rates anchor a compelling long-term narrative for the fiber optic cable market.
- Prysmian Group
- Corning Inc.
- Sumitomo Electric Industries Ltd.
- Furukawa Electric Co., Ltd.
- CommScope Holding Company Inc.
- Fujikura Ltd.
- Nexans S.A.
- LS Cable and System Ltd.
- OFS Fitel LLC
- Sterlite Technologies Ltd.
- Hengtong Optic-Electric Co. Ltd.
- Yangtze Optical Fiber and Cable (JOFC)
- ZTT Group
- Proterial Ltd.
- Finolex Cables Ltd.
- Belden Inc.
- General Cable Corp.
- Hexatronic Group AB
- HMN Tech Co., Ltd.
- Taihan Fiberoptics Co., Ltd.
Additional Benefits:
- The market estimate (ME) sheet in Excel format
- 3 months of analyst support
TABLE OF CONTENTS
1 INTRODUCTION
- 1.1 Study Assumptions and Market Definition
- 1.2 Scope of the Study
2 RESEARCH METHODOLOGY
3 EXECUTIVE SUMMARY
4 MARKET LANDSCAPE
- 4.1 Market Overview
- 4.2 Market Drivers
- 4.2.1 Increasing penetration of high-speed internet and global data-traffic surge
- 4.2.2 Accelerated 5G roll-outs and fiber-deep FTTx deployments
- 4.2.3 Expanding hyperscale data-center interconnect demand
- 4.2.4 Government-backed rural broadband and digital-inclusion programs
- 4.2.5 Sub-sea route diversification for geopolitical resiliency
- 4.2.6 Sustainability push replacing copper with low-carbon glass fiber
- 4.3 Market Restraints
- 4.3.1 High civil-works cost and right-of-way complexities
- 4.3.2 Price volatility in raw materials and helium supply constraints
- 4.3.3 Delays in environmental permitting for submarine routes
- 4.3.4 Plateauing telco CAPEX in saturated metro markets
- 4.4 Value/Supply-Chain Analysis
- 4.5 Regulatory Landscape
- 4.6 Technological Outlook
- 4.6.1 Multi-core and hollow-core fiber roadmap
- 4.6.2 Integrated photonics and silicon-photonics transceiver integration
- 4.7 Pricing Analysis
- 4.8 Porter's Five Forces Analysis
- 4.8.1 Threat of New Entrants
- 4.8.2 Bargaining Power of Buyers
- 4.8.3 Bargaining Power of Suppliers
- 4.8.4 Threat of Substitute Products
- 4.8.5 Intensity of Competitive Rivalry
- 4.9 Investment Analysis
- 4.10 COVID-19 Impact and Recovery Analysis
5 MARKET SIZE AND GROWTH FORECASTS (VALUE)
- 5.1 By Cable Type
- 5.1.1 Armored Cable
- 5.1.2 Non-Armored Cable
- 5.1.3 Ribbon Cable
- 5.1.4 Others
- 5.2 By Fiber Mode
- 5.2.1 Single-Mode Fiber
- 5.2.2 Multi-Mode Fiber
- 5.2.3 Plastic Optical Fiber
- 5.3 By Installation Type
- 5.3.1 Aerial/Overhead
- 5.3.2 Underground/Buried
- 5.3.3 Submarine/Under-water
- 5.3.4 Indoor/Drop Cables
- 5.4 By End-user Industry
- 5.4.1 Telecommunications
- 5.4.2 Data Centers and Cloud Providers
- 5.4.3 Power Utilities and Smart Grid
- 5.4.4 Defense and Aerospace
- 5.4.5 Industrial Automation and Control
- 5.4.6 Healthcare and Medical
- 5.4.7 Oil and Gas and Offshore
- 5.4.8 Others
- 5.5 By Geography
- 5.5.1 North America
- 5.5.1.1 United States
- 5.5.1.2 Canada
- 5.5.1.3 Mexico
- 5.5.2 South America
- 5.5.2.1 Brazil
- 5.5.2.2 Argentina
- 5.5.2.3 Rest of South America
- 5.5.3 Europe
- 5.5.3.1 Germany
- 5.5.3.2 United Kingdom
- 5.5.3.3 France
- 5.5.3.4 Italy
- 5.5.3.5 Spain
- 5.5.3.6 Rest of Europe
- 5.5.4 Asia-Pacific
- 5.5.4.1 China
- 5.5.4.2 Japan
- 5.5.4.3 India
- 5.5.4.4 South Korea
- 5.5.4.5 Rest of Asia-Pacific
- 5.5.5 Middle East
- 5.5.5.1 Saudi Arabia
- 5.5.5.2 United Arab Emirates
- 5.5.5.3 Turkey
- 5.5.5.4 Rest of Middle East
- 5.5.6 Africa
- 5.5.6.1 South Africa
- 5.5.6.2 Nigeria
- 5.5.6.3 Egypt
- 5.5.6.4 Rest of Africa
- 5.5.1 North America
6 COMPETITIVE LANDSCAPE
- 6.1 Market Concentration
- 6.2 Strategic Moves
- 6.3 Market Share Analysis
- 6.4 Company Profiles (includes Global level Overview, Market level overview, Core Segments, Financials as available, Strategic Information, Market Rank/Share for key companies, Products and Services, and Recent Developments)
- 6.4.1 Prysmian Group
- 6.4.2 Corning Inc.
- 6.4.3 Sumitomo Electric Industries Ltd.
- 6.4.4 Furukawa Electric Co., Ltd.
- 6.4.5 CommScope Holding Company Inc.
- 6.4.6 Fujikura Ltd.
- 6.4.7 Nexans S.A.
- 6.4.8 LS Cable and System Ltd.
- 6.4.9 OFS Fitel LLC
- 6.4.10 Sterlite Technologies Ltd.
- 6.4.11 Hengtong Optic-Electric Co. Ltd.
- 6.4.12 Yangtze Optical Fiber and Cable (JOFC)
- 6.4.13 ZTT Group
- 6.4.14 Proterial Ltd.
- 6.4.15 Finolex Cables Ltd.
- 6.4.16 Belden Inc.
- 6.4.17 General Cable Corp.
- 6.4.18 Hexatronic Group AB
- 6.4.19 HMN Tech Co., Ltd.
- 6.4.20 Taihan Fiberoptics Co., Ltd.
7 MARKET OPPORTUNITIES AND FUTURE OUTLOOK
- 7.1 White-space and Unmet-Need Assessment
 光纤电缆市场分析及预测(至2035年):类型、产品类型、技术、应用、材料类型、部署模式、最终用户、安装模式、传输模式
 光纤电缆市场:按光纤类型、电缆类型、组件、纤芯数量、应用和最终用户划分,全球预测,2026-2032年全球多模光纤扰码器市场(按光纤类型、通道数、速度、连接器类型和最终用户划分)预测(2026-2032年)
 光纤电缆组件市场规模、份额和成长分析(按产品类型、模式类型、电缆长度、最终用户和地区划分)—2026-2033年产业预测
 2026年全球多芯光纤推入式(MPO)或机械式传输推入式(MTP)光缆组件市场报告全球多芯室内配线光缆市场(以芯数、光纤类型、护套材料、结构类型和应用划分)预测(2026-2032)
 光纤电缆组件市场-全球产业规模、份额、趋势、机会及预测(按模式类型、产品类型、最终用户、地区和竞争格局划分,2020-2030 年预测)
 光纤电缆:全球市占率及排名、总收入及需求预测(2025-2031年)全球光纤电缆市场(按产品、产品类型、电缆安装、光纤类型、传输模式和买家划分)预测(2025 年至 2030 年)
 全球光纤电缆组件市场