


 |
市场调查报告书
商品编码
1851027
网路即服务:市场占有率分析、产业趋势、统计数据和成长预测(2025-2030 年)Network As A Service - Market Share Analysis, Industry Trends & Statistics, Growth Forecasts (2025 - 2030) |
||||||
※ 本网页内容可能与最新版本有所差异。详细情况请与我们联繫。
预计到 2025 年,网路即服务市场规模将达到 332.2 亿美元,到 2030 年将达到 1,153.6 亿美元,在此期间的复合年增长率将达到 28.3%。
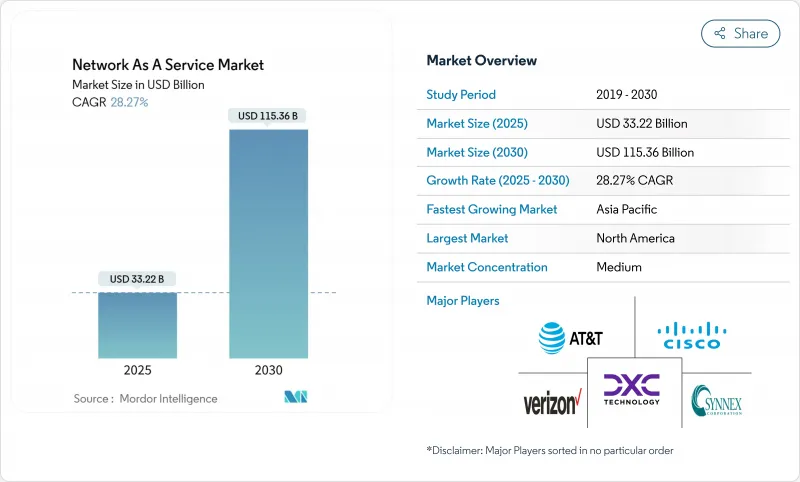
这一扩张反映了企业从资本密集型硬体所有权向基于消费的服务模式的果断转变,这种模式使营运预算与敏捷性需求相匹配。云端优先转型蓝图、SD-WAN 和 SASE 的快速部署,以及将平均修復时间缩短至五分钟以内的 AI主导网路保障引擎,共同推动了这一趋势的强劲发展。北美凭藉强大的企业数位化和成熟的託管服务生态系统保持着领先优势,而亚太地区则在大型现代化专案和严格的资料主权要求的支持下实现了快速成长。随着传统设备供应商重新调整其服务组合,以及通讯将私有 5G 切片商业化,竞争日益加剧。同时,资料驻留法规、供应商锁定问题以及 IFRS 16/ASC 842 复杂的会计处理影响,正在抑制短期内的普及前景。
全球网路即服务市场趋势与洞察
企业「云端优先」网路转型蓝图
随着企业淘汰传统硬体并采用云端原生、软体定义平台,实现基于意图的自动化和整合安全,现代化专案正在重新定义基础架构的消费模式。思科的数据显示,91% 的技术长正在增加网路预算以支援人工智慧和物联网工作负载,而整合式网路即服务 (NaaS) 框架正成为快速创新的首选途径。在单一营运模式下紧密结合连线性、安全性和可观测性,能够实现快速部署、减少停机时间,并在多重云端环境中执行一致的策略。由此带来的敏捷性将网路从不断折旧免税额的资产转变为一种弹性公用事业,从而增强了网路即服务市场。
从资本支出预算转向营运支出预算再转向订阅预算
IFRS 16 和 ASC 842 要求公司在资产负债表中确认租赁,这使得传统硬体采购的经济效益变得复杂。基于消费的网路模式有助于公司避免大量资本投入,平滑现金流,并缩短更新周期,从而促进财务长主导的转型计画的实施。可预测的月度支出还能降低技术生命週期加速时的财务风险,使得订阅模式对中阶市场用户尤其具有吸引力。
持久资料主权和居住合规性障碍
诸如欧洲资料法和中国网路安全法等区域性法规要求在本地进行资料处理,并限制跨境传输。这些框架使全球服务整合变得复杂,迫使服务供应商部署分散的部署模式,从而降低规模经济效益,延长采购週期,并减缓受监管地区网路即服务市场的成长。
细分市场分析
预计到2024年,广域网路即服务(WANaaS)市场规模将达到151亿美元,占总营收的45.5%,这主要得益于企业优先考虑弹性、应用感知型连接,以支援混合办公和云端采用。同时,受Wi-Fi 7部署的推动,校园交换机即服务(Campus-Switch-as-a-Service)市场预计将在2030年之前以29.8%的复合年增长率增长,而Wi-Fi 7部署需要先进的电源管理和射频优化技术。
供应商正透过将交换器、网路基地台和保障软体捆绑到订阅协议中,降低中型园区网路的采购门槛。展望未来,区域网路即服务 (LANaaS) 和资料中心互连服务预计将透过园区网路、广域网路 (WAN) 和云端架构的整合合约获得更大的市场份额。向单一平台营运的转型将使服务类型的多样化成为网路即服务 (NaaS) 市场扩张的核心。
到2024年,随着企业以託管在白盒设备上的软体镜像取代硬体路由器,虚拟CPE将占据42.8%的市场。整合网路安全即服务(Integrated Network Security as a Service)将呈现最强劲的成长势头,复合年增长率(CAGR)将达到29.3%,反映出企业越来越依赖融合连接性和威胁防御的SASE框架。
随选频宽和託管 VPN 仍然相辅相成,能够根据季节性工作负载动态扩展容量,并为低频宽网站提供安全连线。预计到 2030 年,整合安全将超越虚拟 CPE。这一趋势正在推动网路即服务 (NaaS) 市场的稳定扩张,并带动对多功能服务层级的支出,这些服务层级将合规性、DDoS 防护和可观测性整合到单一服务等级协定 (SLA) 中。
区域分析
到2024年,北美将占据35.4%的市场份额,这反映出该地区拥有成熟的云端生态系、早期采用SASE技术以及现有供应商内部能力的显着整合。 HPE计画以140亿美元收购Juniper Networks,旨在使其网路业务收入翻番,这标誌着HPE正采取平台策略,挑战思科的市场主导地位。联邦和州的资料隐私法规将进一步推动缺乏内部合规资源的公司采用託管服务。
预计到2030年,亚太地区将以28.9%的复合年增长率成长,主要得益于各国政府对数位基础建设的资金投入,以及通讯业者将私有5G切片技术商业化应用于工业园区。中国的数据在地化政策正在推动自主云端网路即服务(NaaS)模式的发展,而印度的生产挂钩奖励计画则刺激了工厂数位化,从而带动了该地区的需求。
在欧洲,儘管监管严格,但商业机会依然丰富。即将出台的《数位营运弹性法案》正推动银行和保险公司采用具备内建审核就绪报告功能的託管连线。服务供应商正在调整其产品以满足GDPR、资料可携性法案和新的网路弹性基准的要求,从而推动了相关技术的稳步普及。拉丁美洲和中东及非洲地区虽然仍处于起步阶段,但随着云端服务可用性的提高和能源价格波动对可预测营运支出模式的需求,这些地区的云端服务正在迅速发展。
其他福利:
- Excel格式的市场预测(ME)表
- 3个月的分析师支持
目录
第一章 引言
- 研究假设和市场定义
- 调查范围
第二章调查方法
第三章执行摘要
第四章 市场情势
- 市场概览
- 市场驱动因素
- 企业「云端优先」网路转型蓝图
- 订阅预算从资本支出转向营运支出
- SD-WAN 和 SASE 的整合加速了託管广域网路的转型。
- 校园区域网路即服务需求计数器 Wi-Fi 7 功率峰值
- 人工智慧驱动的网路保障将平均修復时间缩短至 5 分钟以内
- 通讯服务提供者以「服务」形式出售的私人 5G 网路切片
- 市场限制
- 持久资料主权和居住合规性障碍
- 因专有生命週期平台而导致的供应商锁定问题
- IFRS 16/ASC 842 复杂租赁会计准则
- 边缘站点电力成本的波动会影响网路即服务 (NaaS) 的总拥有成本 (TCO)。
- 价值链分析
- 监管环境
- 技术展望
- 波特五力分析
- 供应商的议价能力
- 买方的议价能力
- 新进入者的威胁
- 替代品的威胁
- 竞争对手之间的竞争
- 评估宏观经济趋势对市场的影响
第五章 市场规模与成长预测
- 按类型
- 区域网路即服务
- 广域网路服务
- 校园交换器即服务
- 资料中心互连即服务
- 透过使用
- 虚拟 CPE (vCPE)
- 按需频宽(BoD)
- 整合网路安全即服务
- 虚拟私人网路(VPN)
- 按公司规模
- 大公司
- 中小企业
- 按行业
- 资讯科技和电信
- BFSI
- 卫生保健
- 製造业
- 零售与电子商务
- 其他行业
- 按地区
- 北美洲
- 美国
- 加拿大
- 墨西哥
- 欧洲
- 德国
- 英国
- 法国
- 义大利
- 西班牙
- 其他欧洲地区
- 亚太地区
- 中国
- 日本
- 印度
- 韩国
- 澳洲
- 亚太其他地区
- 南美洲
- 巴西
- 阿根廷
- 其他南美洲
- 中东和非洲
- 中东
- 沙乌地阿拉伯
- 阿拉伯聯合大公国
- 土耳其
- 其他中东地区
- 非洲
- 南非
- 埃及
- 奈及利亚
- 其他非洲地区
- 北美洲
第六章 竞争情势
- 市场集中度
- 策略趋势
- 市占率分析
- 公司简介
- Cisco Systems Inc.
- Hewlett Packard Enterprise(Aruba/GreenLake)
- ATandT Inc.
- Verizon Communications Inc.
- IBM Corp.
- DXC Technology
- TD SYNNEX(Avnet)
- NEC Corp.
- Oracle Corp.
- GTT Communications
- VMware(Broadcom)
- Telstra Group
- Lumen Technologies
- Cato Networks
- Aryaka Networks
- Juniper Networks
- Nokia(Alcatel-Lucent Enterprise)
- Akamai Technologies
- Masergy(Comcast Business)
- Proofpoint/Meta Networks
- Extreme Networks
- Fortinet Inc.
第七章 市场机会与未来展望
The Network as a Service market size is valued at USD 33.22 billion in 2025 and is forecast to reach USD 115.36 billion in 2030, registering a 28.3% CAGR over the period.
This expansion reflects a decisive enterprise shift from capital-intensive hardware ownership toward consumption-based service models that align operating budgets with agility needs. Strong momentum comes from cloud-first transformation roadmaps, rapid SD-WAN and SASE rollouts, and AI-driven network-assurance engines that cut mean time to repair to under five minutes. North America retains primacy through robust enterprise digitalization and a mature managed-services ecosystem, while Asia-Pacific posts the fastest growth, supported by large-scale modernization programs and strict data-sovereignty mandates. Competitive intensity is rising as legacy equipment vendors reposition around service portfolios and telecom carriers monetize private-5G slicing. At the same time, data-residency rules, vendor-lock-in anxieties, and IFRS 16/ASC 842 accounting complexity temper near-term adoption prospects.
Global Network As A Service Market Trends and Insights
Enterprises' "cloud-first" network-transformation roadmaps
Modernization programs are redefining infrastructure consumption as organizations retire legacy hardware in favor of cloud-native, software-defined platforms that deliver intent-based automation and integrated security. Cisco notes that 91% of technology executives have boosted networking budgets to underpin AI and IoT workloads, with unified NaaS frameworks emerging as the preferred path to rapid innovation. Tight coupling of connectivity, security, and observability under a single operational model enables quicker provisioning, lower downtime, and consistent policy enforcement across multi-cloud estates. The resulting agility strengthens the Network as a Service market by turning networking into an elastic utility rather than a depreciating asset.
Shift from CapEx to OpEx subscription budgeting pressure
IFRS 16 and ASC 842 compel enterprises to recognize leases on balance sheets, complicating traditional hardware-procurement economics. Consumption-based networking helps firms sidestep large capital allocations, smooth cash-flow profiles, and shorten refresh cycles, driving uptake among CFO-led transformation initiatives. Predictable monthly spend also reduces financial risk when technology lifecycles accelerate, making subscription models especially attractive for mid-market adopters.
Persistent data-sovereignty and residency compliance barriers
Regional mandates such as the European Data Act and China's cybersecurity law require local processing and impose cross-border transfer restrictions. These frameworks complicate global service uniformity, forcing providers to deploy fragmented footprints that dilute economies of scale and extend procurement cycles, thereby slowing the Network as a Service market in regulated sectors.
Other drivers and restraints analyzed in the detailed report include:
- SD-WAN and SASE convergence accelerating managed WAN refresh
- Campus-LAN NaaS demand to counter Wi-Fi 7 power spikes
- Vendor lock-in fears around proprietary lifecycle platforms
For complete list of drivers and restraints, kindly check the Table Of Contents.
Segment Analysis
The Network as a Service market size for WAN-as-a-Service reached USD 15.10 billion in 2024 and accounted for 45.5% of revenue. Enterprises prioritize resilient, application-aware connectivity that supports hybrid work and cloud adoption. Campus-Switch-as-a-Service, however, is forecast to expand at 29.8% CAGR to 2030, propelled by Wi-Fi 7 rollouts that demand sophisticated power-management and RF optimization.
Vendors bundle switching, access points, and assurance software into subscription contracts, flattening the procurement barrier for mid-sized campuses. Over the forecast horizon, LAN-as-a-Service and data-center interconnect offerings are expected to gain share as organizations converge campus, WAN, and cloud fabrics under unified contracts. The push toward single-platform operations will keep service-type diversification at the forefront of Network as a Service market expansion.
Virtual CPE held 42.8% share in 2024 as enterprises replaced hardware routers with software images hosted on white-box devices. Integrated network-security-as-a-service exhibits the strongest trajectory with a 29.3% CAGR, reflecting growing reliance on SASE frameworks that blend connectivity and threat defense.
Bandwidth-on-Demand and managed VPN remain complementary, enabling dynamic capacity scaling for seasonal workloads and secure connectivity to low-bandwidth sites. By 2030, integrated security is expected to overtake virtual CPE as enterprises regard secure connectivity as baseline. The trend underpins steady increases in Network as a Service market size, channeling spend toward multi-function service tiers that bake compliance, DDoS protection, and observability into a single SLA.
The Network As A Service Market Report is Segmented by Type (LAN-As-A-Service, WAN-As-A-Service, and More), Application (Virtual CPE (vCPE), Bandwidth-On-Demand (BoD), and More), Organization Size (Large Enterprises and Small and Medium Enterprises (SMEs)), Industry Vertical (IT and Telecom, BFSI, Healthcare, and More), and Geography. The Market Forecasts are Provided in Terms of Value (USD).
Geography Analysis
North America held the lion's share at 35.4% in 2024, reflecting a sophisticated cloud ecosystem, early SASE adoption, and an active MandA landscape that consolidates capabilities within incumbent vendors. HPE's planned USD 14 billion acquisition of Juniper Networks intends to double networking revenue contribution, signaling a platform play to challenge Cisco's dominance. Federal and state data-privacy rules further spur managed-service uptake by enterprises that lack compliance resources in-house.
Asia-Pacific is poised for a 28.9% CAGR through 2030 as governments fund digital-infrastructure build-outs and telcos commercialize private-5G slicing for industrial campuses. China's data-localization mandates encourage sovereign-cloud NaaS models, while India's Production-Linked Incentive program stimulates factory digitization, together bolstering regional demand.
Europe remains opportunity-rich despite tight regulations; the upcoming Digital Operational Resilience Act drives banks and insurers toward managed connectivity that embeds audit-ready reporting. Service providers tailor offerings to satisfy GDPR, data-act portability, and emerging cyber-resilience benchmarks, promoting steady uptake. Latin America, the Middle East, and Africa are still nascent but gaining traction as cloud-service availability rises and energy-price volatility increases appetite for predictable OpEx consumption models.
- Cisco Systems Inc.
- Hewlett Packard Enterprise (Aruba/GreenLake)
- ATandT Inc.
- Verizon Communications Inc.
- IBM Corp.
- DXC Technology
- TD SYNNEX (Avnet)
- NEC Corp.
- Oracle Corp.
- GTT Communications
- VMware (Broadcom)
- Telstra Group
- Lumen Technologies
- Cato Networks
- Aryaka Networks
- Juniper Networks
- Nokia (Alcatel-Lucent Enterprise)
- Akamai Technologies
- Masergy (Comcast Business)
- Proofpoint / Meta Networks
- Extreme Networks
- Fortinet Inc.
Additional Benefits:
- The market estimate (ME) sheet in Excel format
- 3 months of analyst support
TABLE OF CONTENTS
1 INTRODUCTION
- 1.1 Study Assumptions and Market Definition
- 1.2 Scope of the Study
2 RESEARCH METHODOLOGY
3 EXECUTIVE SUMMARY
4 MARKET LANDSCAPE
- 4.1 Market Overview
- 4.2 Market Drivers
- 4.2.1 Enterprises' "cloud-first" network transformation roadmaps
- 4.2.2 Shift from CapEx to OpEx subscription budgeting pressure
- 4.2.3 SD-WAN and SASE convergence accelerating managed WAN refresh
- 4.2.4 Campus-LAN NaaS demand to counter Wi-Fi 7 power spikes
- 4.2.5 AI-driven network assurance reducing MTTR below 5 min
- 4.2.6 Private-5G network slicing sold "as-a-service" by CSPs
- 4.3 Market Restraints
- 4.3.1 Persistent data-sovereignty and residency compliance barriers
- 4.3.2 Vendor lock-in fears around proprietary lifecycle platforms
- 4.3.3 Complex lease-accounting rules under IFRS 16/ASC 842
- 4.3.4 Edge-site power cost volatility impacting NaaS TCO
- 4.4 Value Chain Analysis
- 4.5 Regulatory Landscape
- 4.6 Technological Outlook
- 4.7 Porter's Five Forces Analysis
- 4.7.1 Bargaining Power of Suppliers
- 4.7.2 Bargaining Power of Buyers
- 4.7.3 Threat of New Entrants
- 4.7.4 Threat of Substitutes
- 4.7.5 Intensity of Competitive Rivalry
- 4.8 Assessment of the Impact of Macroeconomic Trends on the Market
5 MARKET SIZE AND GROWTH FORECASTS (VALUE)
- 5.1 By Type
- 5.1.1 LAN-as-a-Service
- 5.1.2 WAN-as-a-Service
- 5.1.3 Campus-Switch-as-a-Service
- 5.1.4 Data-Centre-Interconnect-as-a-Service
- 5.2 By Application
- 5.2.1 Virtual CPE (vCPE)
- 5.2.2 Bandwidth-on-Demand (BoD)
- 5.2.3 Integrated Network-Security-as-a-Service
- 5.2.4 Virtual Private Network (VPN)
- 5.3 By Organisation Size
- 5.3.1 Large Enterprises
- 5.3.2 Small and Medium Enterprises (SMEs)
- 5.4 By Industry Vertical
- 5.4.1 IT and Telecom
- 5.4.2 BFSI
- 5.4.3 Healthcare
- 5.4.4 Manufacturing
- 5.4.5 Retail and E-commerce
- 5.4.6 Other Industry Verticals
- 5.5 By Geography
- 5.5.1 North America
- 5.5.1.1 United States
- 5.5.1.2 Canada
- 5.5.1.3 Mexico
- 5.5.2 Europe
- 5.5.2.1 Germany
- 5.5.2.2 United Kingdom
- 5.5.2.3 France
- 5.5.2.4 Italy
- 5.5.2.5 Spain
- 5.5.2.6 Rest of Europe
- 5.5.3 Asia-Pacific
- 5.5.3.1 China
- 5.5.3.2 Japan
- 5.5.3.3 India
- 5.5.3.4 South Korea
- 5.5.3.5 Australia
- 5.5.3.6 Rest of Asia-Pacific
- 5.5.4 South America
- 5.5.4.1 Brazil
- 5.5.4.2 Argentina
- 5.5.4.3 Rest of South America
- 5.5.5 Middle East and Africa
- 5.5.5.1 Middle East
- 5.5.5.1.1 Saudi Arabia
- 5.5.5.1.2 United Arab Emirates
- 5.5.5.1.3 Turkey
- 5.5.5.1.4 Rest of Middle East
- 5.5.5.2 Africa
- 5.5.5.2.1 South Africa
- 5.5.5.2.2 Egypt
- 5.5.5.2.3 Nigeria
- 5.5.5.2.4 Rest of Africa
- 5.5.1 North America
6 COMPETITIVE LANDSCAPE
- 6.1 Market Concentration
- 6.2 Strategic Moves
- 6.3 Market Share Analysis
- 6.4 Company Profiles (includes Global level Overview, Market level overview, Core Segments, Financials as available, Strategic Information, Market Rank/Share for key companies, Products and Services, and Recent Developments)
- 6.4.1 Cisco Systems Inc.
- 6.4.2 Hewlett Packard Enterprise (Aruba/GreenLake)
- 6.4.3 ATandT Inc.
- 6.4.4 Verizon Communications Inc.
- 6.4.5 IBM Corp.
- 6.4.6 DXC Technology
- 6.4.7 TD SYNNEX (Avnet)
- 6.4.8 NEC Corp.
- 6.4.9 Oracle Corp.
- 6.4.10 GTT Communications
- 6.4.11 VMware (Broadcom)
- 6.4.12 Telstra Group
- 6.4.13 Lumen Technologies
- 6.4.14 Cato Networks
- 6.4.15 Aryaka Networks
- 6.4.16 Juniper Networks
- 6.4.17 Nokia (Alcatel-Lucent Enterprise)
- 6.4.18 Akamai Technologies
- 6.4.19 Masergy (Comcast Business)
- 6.4.20 Proofpoint / Meta Networks
- 6.4.21 Extreme Networks
- 6.4.22 Fortinet Inc.
7 MARKET OPPORTUNITIES AND FUTURE OUTLOOK
- 7.1 White-space and Unmet-Need Assessment
 网路即服务市场分析及至 2035 年预测:按类型、产品类型、服务、技术、组件、应用、部署类型、最终用户和解决方案划分
 日本网路即服务市场报告(按类型、应用、最终用户产业和地区划分,2026-2034 年)网路即服务市场规模、份额、趋势及预测(按类型、应用、最终用途产业和地区),2025 年至 2033 年
 网路即服务 (NaaS) 市场按服务类型、组织规模和行业划分 - 全球预测 2025-2032 年
 作为服务的网路(NaaS):全球市场的预测(2025年~2029年)
 网路API的全球市场:预测(2024年~2030年)
 全球 NaaS(网路即服务)市场规模、份额、趋势分析报告:2024 年至 2031 年按类型、最终用户、应用、公司类型、行业垂直和地区分類的展望和预测
 网路即服务 (NaaS) 市场:2025-2029 年全球
 网路即服务 (NaaS) 解决方案:电信案例研究与分析
 网路即服务 (NaaS) 市场机会、成长动力、产业趋势分析与 2025 - 2034 年预测