


 |
市场调查报告书
商品编码
1939104
能源管理系统(EMS):市场占有率分析、产业趋势与统计数据、成长预测(2026-2031)Energy Management Systems - Market Share Analysis, Industry Trends & Statistics, Growth Forecasts (2026 - 2031) |
||||||
※ 本网页内容可能与最新版本有所差异。详细情况请与我们联繫。
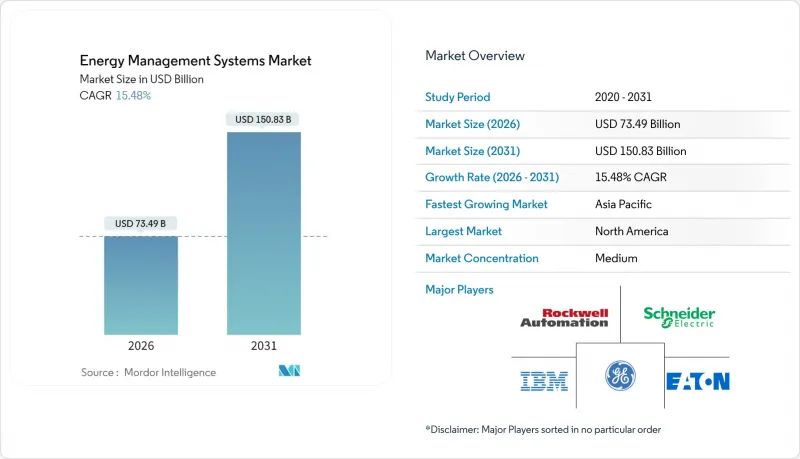
2025年能源管理系统(EMS)市值为636.4亿美元,预计到2031年将达到1,508.3亿美元,而2026年为734.9亿美元。
预计在预测期(2026-2031 年)内,复合年增长率将达到 15.48%。
这一快速成长反映了日益严格的脱碳法规、智慧电网的快速部署以及企业不断提高的净零排放目标,表明即时能源优化正从可选变为强制。公用事业公司正在大规模部署高级计量基础设施 (AMI),为营运商提供详细数据,这些数据与人工智慧驱动的分析相结合,能够实现电网的自愈能力并降低营运成本。商业房地产所有者将面临从 2026 年开始实施的强制性净零建筑标准,这将推动对互联的暖通空调 (HVAC)、照明和控制平台的快速需求。同时,签订大规模可再生能源购买协议的公司需要能够进行小时追踪、证书管理和碳核算的整合系统。气候政策,加上大宗商品价格波动和碳成本上升,进一步强化了能源管理系统 (EMS) 市场的经济合理性,因为企业正在寻求两位数的成本降低和应对供应面衝击的能力。
全球能源管理系统(EMS)市场趋势与洞察
快速部署先进计量基础设施推动电网智慧化
2024年,成熟经济体的公共产业加快了高级计量基础设施(AMI)计画的推进,安装了数百万个智慧电錶,这些电錶将间隔数据传输到云端分析引擎。 Eversource公司在麻萨诸塞州和康乃狄克州完成了一个价值130万美元的计划,而National Grid公司则在东北地区连接了340万个终端。这些资料馈送流为现代能源管理系统(EMS)市场平台的核心模组提供支持,包括自动需量反应、故障自癒和预测性负载预测。人工智慧演算法可在几秒钟内重新分配电力,从而缩短恢復时间并减少配电损耗。随着配电公司实现电网服务的商业化并积极采用可再生能源,AMI成为连接现场资产和云端优化系统的关键环节。
强制性净零排放建筑标准加速商业环境管理系统的采用
纽约市、华盛顿州和加州等地区已颁布法规,旨在促进大型建筑实现净零排放运营,最早的实施日期为2026年。纽约市第97号法令要求面积超过25,000平方公尺的设施到2030年将排放减少40%,违者将处以重罚。加州第24号修正案强制要求采用先进的控制和计量技术,使能源管理系统(EMS)的市场应用从可选升级转变为监管要求。加拿大和欧盟也正在推出类似的法规,这将扩大对整合式暖通空调、照明和可再生能源平台的潜在需求。
高昂的初始实施成本限制了其在中小企业市场的渗透。
全面部署仍需5万至50万美元,对资金紧张的企业构成了一道障碍。硬体、整合和培训费用将投资回收期延长至18至36个月,减缓了中小企业的采用速度。能源即服务 (EaaS) 订阅模式透过将资本支出 (CapEx) 转化为营运支出 (OpEx) 降低了进入门槛。 Iris Ohio 于2025年推出的 ENEverse 云端套件正是这种转变的典型代表,它将感测器、分析和远端操作整合到一个无需硬体的模式中。
细分市场分析
到2025年,楼宇能源管理系统(EMS)将占据整个EMS市场最大的份额,达到45.62%。在日益严格的法规、租户永续发展报告以及对健康室内环境日益增长的需求的推动下,商业房地产持续投资于先进的控制系统,以降低25%至40%的能源费用。住宅解决方案的成长速度最快,年复合成长率(CAGR)高达16.85%,这主要得益于电费上涨、智慧家电普及以及能源需量反应奖励,这些因素推动了语音控制恆温器和电动汽车自动充电计画管理等技术的采用。整合平台正在融合人体感应器、太阳能逆变器和电池控制系统,以建造自调节微电网。儘管供应商提供的架构各不相同(边缘中心架构与云端优先架构),但它们都将资料聚合到人工智慧引擎中进行即时优化,从而扩大了EMS的潜在市场。
近期的进展标誌着自动化模式从基于规则的自动化转向预测性编配。 C3.ai 的模型将基于物理的设备库与机器学习相结合,能够预测负载峰值并主动调节暖通空调系统,从而最大限度地降低能耗。开利的 BluEdge 控制中心将冷却器层级的资料传输给远端工程师,工程师只需几分钟即可调整设定点,无需现场人员即可实现两位数的节能效果。这形成了一个回馈循环:已实现的节能效益可用于资助额外的维修,并巩固构成供应商收入基础的长期服务协议。
製造业的能源成本通常占营运支出的20%,预计到2025年,製造业将占据能源管理系统(EMS)市场份额的31.05%。水泥、钢铁和化学等产业正致力于利用高速感测器和数数位双胞胎来调整熔炉、压缩机和生产线,从而提高生产效率。然而,医疗保健产业的复合年增长率高达16.02%。医院全天候运作,需要严格的湿度和温度控制,因此是利用人工智慧优化空调和锅炉控制的理想场所。据报道,阿波罗医院在实施了一套基于云端的EMS系统后,公用事业成本降低了30%,该系统整合了医疗设备运作计画和热电汽电共生控制功能。
第二大终端用户-电力公司,依赖能源管理系统(EMS)模组进行需求预测和可再生能源併网。 IT和通讯业者在其资料中心也应用了类似的逻辑,资料中心的冷却负荷接近总能耗的40%。随着人工智慧工作负载推动伺服器密度快速成长,先进的气流建模和液冷优化已成为设施发展的蓝图。住宅和商业综合体也在补充能源需求,这主要受净计量政策和屋顶太阳能货币化需求的驱动。
能源管理系统 (EMS) 市场报告按 EMS 类型(BEMS、IEMS、HEMS)、最终用户(製造业、电力和能源、IT 和电信、医疗保健、住宅和商业)、应用(能源产出、能源传输、能源监控)、组件(硬体、软体、服务)和地区进行细分。
区域分析
北美将继续保持领先地位,预计到2025年将占能源管理系统(EMS)市场收入的35.18%。联邦政府的资金和扣除额正在推动计量、电动车充电和建筑维修计划的发展。像Eversource和National Grid这样的公共产业正在2024年新增数百万个智慧终端,建构支援进阶分析的资料基础设施。Schneider Electric已做出积极响应,投资7亿美元用于其美国工厂的扩建计划,促进开关设备、微电网控制设备以及软体研发的本地化生产,这反映了其对政策稳定性和客户需求的信心。
欧洲紧随其后,欧洲绿色交易及其「Fit for 55」一揽子计画要求到2030年将排放排放量比1990年水准降低55%。成员国正在将数位化建筑要求纳入地方法规,从而推动了对整合建筑分析的强劲需求。德国推出点对点交易沙盒以及荷兰大力推行的热泵补贴计划,都反映了监管的扩张。 TPG斥资67亿欧元收购Techem,看中的是其来自分錶计量和能源效率服务的经常性收入,凸显了日益增长的投资意愿。公用事业公司正在加速电网边缘数位化,以适应可再生能源流量的波动,这进一步扩大了能源管理系统(EMS)市场。
亚太地区预计将成为成长引擎,年复合成长率将达到15.88%。中国正在投资建造超高压电网和人工智慧增强型指挥中心,以满足2030年计画新增的1200吉瓦风能和太阳能发电装置容量。日本对住宅和建筑能源管理系统(EMS)的补贴(2025累计年为40亿日圆)将增强供应商的订单来源。印度的智慧城市计画已将EMS要求纳入公共建筑和路灯网路的竞标。同时,东南亚国家正在寻求电网稳定解决方案,以支持屋顶太阳能发电的快速发展。建立区域製造地的跨国公司从早期阶段就开始指定使用EMS,加速了新的需求。
其他福利:
- Excel格式的市场预测(ME)表
- 3个月的分析师支持
目录
第一章 引言
- 研究假设和市场定义
- 调查范围
第二章调查方法
第三章执行摘要
第四章 市场情势
- 市场概览
- 市场驱动因素
- 快速部署进阶计量基础设施(AMI)
- 2026年起,主要经济体将强制实施净零能耗建筑标准
- 人工智慧驱动的预测性维护有助于公共产业降低营运成本
- 越来越多的企业间购电协议(PPA)需要详细的能源数据
- 基于区块链的P2P(P2P)能源交易试点项目
- 市场限制
- 初始系统整合成本高
- 现有设施中遗留的OT/IT互通性差距
- 在不断发展的关键基础设施法律下的网路安全责任
- 经合组织地区以外急救医疗服务技术人员短缺
- 价值链分析
- 监管环境
- 技术展望
- 波特五力分析
- 供应商的议价能力
- 买方的议价能力
- 新进入者的威胁
- 替代品的威胁
- 竞争对手之间的竞争
第五章 市场规模与成长预测
- 按EMS类型
- 楼宇管理系统(BEMS)
- 工业电子管理系统(IEMS)
- 家庭急救服务 (HEMS)
- 最终用户
- 製造业
- 电力和能源
- 资讯科技和电讯
- 卫生保健
- 住宅和商业
- 透过使用
- 能源生产
- 能量传输
- 能源监控与优化
- 按组件
- 硬体
- 软体
- 服务
- 按地区
- 北美洲
- 我们
- 加拿大
- 墨西哥
- 南美洲
- 巴西
- 阿根廷
- 智利
- 其他南美洲
- 欧洲
- 德国
- 英国
- 法国
- 义大利
- 西班牙
- 荷兰
- 俄罗斯
- 其他欧洲地区
- 亚太地区
- 中国
- 印度
- 日本
- 韩国
- ASEAN
- 亚太其他地区
- 中东和非洲
- 中东
- 海湾合作委员会(沙乌地阿拉伯、阿联酋、卡达等)
- 土耳其
- 其他中东地区
- 非洲
- 南非
- 奈及利亚
- 肯亚
- 其他非洲地区
- 中东
- 北美洲
第六章 竞争情势
- 市场集中度
- 策略趋势
- 市占率分析
- 公司简介
- Schneider Electric
- Siemens AG
- Honeywell International Inc.
- ABB Ltd.
- General Electric
- Eaton Corporation
- Rockwell Automation Inc.
- Johnson Controls
- IBM Corporation
- Oracle Corporation
- SAP SE
- Cisco Systems
- Enel X
- Autogrid Systems
- Itron Inc.
- Honeywell Smart Energy
- Mitsubishi Electric
- Yokogawa Electric
- Tendril(Uplight)
- WAGO Kontakttechnik
第七章 市场机会与未来展望
The Energy Management Systems market was valued at USD 63.64 billion in 2025 and estimated to grow from USD 73.49 billion in 2026 to reach USD 150.83 billion by 2031, at a CAGR of 15.48% during the forecast period (2026-2031).
The surge reflects stricter decarbonization rules, rapid smart-grid deployment, and mounting corporate net-zero targets that elevate real-time energy optimization from optional to indispensable. Utilities are rolling out advanced metering infrastructure (AMI) at scale, giving operators the granular data they need to pair with AI-driven analytics for self-healing grid functions and lower operating costs. Commercial real-estate owners face mandatory net-zero building codes starting in 2026, driving a jump in demand for connected HVAC, lighting, and controls platforms. Meanwhile, firms signing large renewable power-purchase agreements require integrated systems capable of hourly tracking, certificate management, and carbon accounting. Beyond climate policy, volatile commodity prices and growing carbon costs sharpen the economic case for the Energy Management Systems market, as enterprises chase double-digit savings and resilience against supply-side shocks.
Global Energy Management Systems Market Trends and Insights
Rapid Roll-out of Advanced Metering Infrastructure Transforms Grid Intelligence
Utilities across mature economies accelerated AMI programs in 2024, installing millions of smart meters that stream interval data to cloud analytics engines. Eversource finished a 1.3 million-meter project spanning Massachusetts and Connecticut, while National Grid connected 3.4 million endpoints in the Northeast. The data feed underpins automated demand response, outage self-healing, and predictive load forecasting, all core modules in modern Energy Management Systems market platforms. AI algorithms re-route power within seconds, cutting restoration times and trimming distribution losses. As distribution operators monetize grid services and accommodate renewables, AMI forms the essential layer linking field assets with cloud-based optimization.
Mandatory Net-Zero Building Codes Accelerate Commercial EMS Adoption
Jurisdictions such as New York City, Washington State, and California enacted rules that push large buildings toward net-zero operations, starting as early as 2026. Local Law 97 requires facilities over 25,000 ft2 to cut emissions 40% by 2030, with steep fines for non-compliance. California's Title 24 updates stipulate advanced controls and measurement, turning Energy Management Systems market deployments from voluntary upgrades into compliance necessities. Similar mandates ripple across Canada and the EU, expanding addressable demand for integrated HVAC, lighting, and renewable-ready platforms.
High Up-Front System Integration Costs Constrain SME Market Penetration
Comprehensive deployments still command USD 50,000-500,000, a hurdle for cash-constrained facilities. Hardware, integration, and training extend payback to 18-36 months, delaying adoption in small enterprises. Energy-as-a-Service subscriptions now re-cast capex as opex, lowering entry barriers; Iris Ohyama's 2025 launch of the ENEverse cloud suite typifies that pivot, bundling sensors, analytics, and remote operations into a no-hardware model.
Other drivers and restraints analyzed in the detailed report include:
- AI-Powered Predictive Maintenance Revolutionizes Utility Operations
- Corporate Power Purchase Agreements Drive Granular Energy Data Requirements
- Legacy OT/IT Interoperability Gaps Complicate Brownfield Deployments
For complete list of drivers and restraints, kindly check the Table Of Contents.
Segment Analysis
Building Energy Management Systems capture the largest slice of the Energy Management Systems market at 45.62% in 2025. Tighter codes, tenant sustainability reporting, and the premium on healthy indoor environments keep commercial campuses investing in advanced controls that trim 25-40% of utility spend. Home solutions post the fastest trajectory, rising at a 16.85% CAGR as rising electricity tariffs, smart-appliance penetration, and utility demand-response incentives nudge households toward voice-controlled thermostats and automated EV-charger scheduling. Integrated platforms now fuse occupancy sensors, PV inverters, and battery dispatch to create self-balancing nanogrids. Suppliers differ on architecture-edge hubs versus cloud-first-but all route data into AI engines for real-time optimization, broadening the Energy Management Systems market addressable base.
Recent advancements illustrate the shift from rule-based automation to predictive orchestration. C3.ai models combine physics-based equipment libraries with machine learning to anticipate load peaks and pre-condition HVAC for minimal energy intensity. Carrier's BluEdge Command Center streams chiller-level data to remote engineers who tweak set points in minutes, achieving double-digit savings without on-site staff. The result is a feedback loop: verified savings fund further retrofits, cementing long-term service contracts that anchor vendor revenue.
Manufacturing facilities accounted for 31.05% of Energy Management Systems market share in 2025 owing to energy bills that routinely reach 20% of operating costs. Sectors such as cement, steel, and chemicals leverage high-speed sensors and digital twins to orchestrate furnaces, compressors, and process lines, seeking every kilowatt of productivity. Nevertheless, the healthcare vertical is expanding at a 16.02% CAGR. Hospitals run 24/7, with stringent humidity and temperature thresholds, making them ideal candidates for AI-guided HVAC and boiler sequencing. Apollo Hospitals reports 30% utility savings after deploying a cloud EMS that integrates medical equipment scheduling and cogeneration controls.
Power utilities, the second-largest end-user, rely on EMS modules for demand forecasting and renewables integration. IT and telecom operators apply similar logic inside data centers where cooling loads approach 40% of total consumption. As server densities jump with AI workloads, advanced airflow modeling and liquid-cooling optimization enter mainstream facility roadmaps. Residential and commercial mixed-use complexes round out demand, driven by net-metering policies and the urge to monetize rooftop solar.
The Energy Management System Market Report is Segmented by Type of EMS (BEMS, IEMS, and HEMS), End-User (Manufacturing, Power and Energy, IT and Telecommunication, Healthcare, and Residential and Commercial), Application (Energy Generation, Energy Transmission, and Energy Monitoring), Component (Hardware, Software, and Services), and Geography.
Geography Analysis
North America retains its pole position with 35.18% of Energy Management Systems market revenue in 2025. Federal funding through the Inflation Reduction Act and state tax credits catalyze metering, EV-charging, and building-retrofit projects. Utilities such as Eversource and National Grid added millions of smart endpoints in 2024, laying the data fabric that underpins advanced analytics. Schneider Electric responded with a USD 700 million expansion across U.S. plants to localize production of switchgear, microgrid controllers, and software R&D, signalling confidence in policy stability and customer demand.
Europe follows closely, propelled by the European Green Deal and Fit-for-55 package that stipulate 55% emission cuts versus 1990 by 2030. Member states embed digital-building requirements in local codes, fostering robust demand for integrated building analytics. Germany's roll-out of P2P trading sandboxes and the Netherlands' aggressive heat-pump incentives showcase regulatory breadth. Investment appetite surfaced when TPG paid EUR 6.7 billion for Techem, attracted by recurring revenues from sub-metering and efficiency services. Utilities accelerate grid-edge digitization to handle variable renewable flows, further enlarging the Energy Management Systems market.
Asia-Pacific is the growth engine with a projected 15.88% CAGR. China invests in ultra-high-voltage transmission and AI-enhanced dispatch centers to balance its 1,200 GW of wind-solar capacity planned by 2030. Japan's subsidies for Home EMS and Building EMS, backed by JPY 4 billion earmarked in 2025, bolster vendor pipelines. India's Smart Cities Mission embeds EMS requirements in tenders for public buildings and street-lighting networks, while Southeast Asian economies seek grid-stability solutions to cope with rapid rooftop-solar adoption. Multinationals setting up regional manufacturing hubs specify EMS from day one, accelerating greenfield demand.
- Schneider Electric
- Siemens AG
- Honeywell International Inc.
- ABB Ltd.
- General Electric
- Eaton Corporation
- Rockwell Automation Inc.
- Johnson Controls
- IBM Corporation
- Oracle Corporation
- SAP SE
- Cisco Systems
- Enel X
- Autogrid Systems
- Itron Inc.
- Honeywell Smart Energy
- Mitsubishi Electric
- Yokogawa Electric
- Tendril (Uplight)
- WAGO Kontakttechnik
Additional Benefits:
- The market estimate (ME) sheet in Excel format
- 3 months of analyst support
TABLE OF CONTENTS
1 INTRODUCTION
- 1.1 Study Assumptions and Market Definition
- 1.2 Scope of the Study
2 RESEARCH METHODOLOGY
3 EXECUTIVE SUMMARY
4 MARKET LANDSCAPE
- 4.1 Market Overview
- 4.2 Market Drivers
- 4.2.1 Rapid roll-out of advanced metering infrastructure (AMI)
- 4.2.2 Mandatory net-zero building codes in major economies from 2026
- 4.2.3 AI-powered predictive maintenance lowering OPEX for utilities
- 4.2.4 Growing corporate PPAs demanding granular energy data
- 4.2.5 Blockchain-enabled peer-to-peer (P2P) energy trading pilots
- 4.3 Market Restraints
- 4.3.1 High up-front system integration costs
- 4.3.2 Legacy OT/IT interoperability gaps in brownfield sites
- 4.3.3 Cyber-security liability under evolving critical-infrastructure laws
- 4.3.4 Shortage of EMS-skilled technicians outside OECD
- 4.4 Value Chain Analysis
- 4.5 Regulatory Landscape
- 4.6 Technological Outlook
- 4.7 Porter's Five Forces Analysis
- 4.7.1 Bargaining Power of Suppliers
- 4.7.2 Bargaining Power of Buyers
- 4.7.3 Threat of New Entrants
- 4.7.4 Threat of Substitutes
- 4.7.5 Intensity of Competitive Rivalry
5 MARKET SIZE AND GROWTH FORECASTS (VALUE)
- 5.1 By Type of EMS
- 5.1.1 Building EMS (BEMS)
- 5.1.2 Industrial EMS (IEMS)
- 5.1.3 Home EMS (HEMS)
- 5.2 By End-User
- 5.2.1 Manufacturing
- 5.2.2 Power and Energy
- 5.2.3 IT and Telecommunication
- 5.2.4 Healthcare
- 5.2.5 Residential and Commercial
- 5.3 By Application
- 5.3.1 Energy Generation
- 5.3.2 Energy Transmission
- 5.3.3 Energy Monitoring and Optimization
- 5.4 By Component
- 5.4.1 Hardware
- 5.4.2 Software
- 5.4.3 Services
- 5.5 By Geography
- 5.5.1 North America
- 5.5.1.1 United States
- 5.5.1.2 Canada
- 5.5.1.3 Mexico
- 5.5.2 South America
- 5.5.2.1 Brazil
- 5.5.2.2 Argentina
- 5.5.2.3 Chile
- 5.5.2.4 Rest of South America
- 5.5.3 Europe
- 5.5.3.1 Germany
- 5.5.3.2 United Kingdom
- 5.5.3.3 France
- 5.5.3.4 Italy
- 5.5.3.5 Spain
- 5.5.3.6 Netherlands
- 5.5.3.7 Russia
- 5.5.3.8 Rest of Europe
- 5.5.4 Asia Pacific
- 5.5.4.1 China
- 5.5.4.2 India
- 5.5.4.3 Japan
- 5.5.4.4 South Korea
- 5.5.4.5 ASEAN
- 5.5.4.6 Rest of Asia Pacific
- 5.5.5 Middle East and Africa
- 5.5.5.1 Middle East
- 5.5.5.1.1 GCC (Saudi Arabia, UAE, Qatar, etc.)
- 5.5.5.1.2 Turkey
- 5.5.5.1.3 Rest of Middle East
- 5.5.5.2 Africa
- 5.5.5.2.1 South Africa
- 5.5.5.2.2 Nigeria
- 5.5.5.2.3 Kenya
- 5.5.5.2.4 Rest of Africa
- 5.5.5.1 Middle East
- 5.5.1 North America
6 COMPETITIVE LANDSCAPE
- 6.1 Market Concentration
- 6.2 Strategic Moves
- 6.3 Market Share Analysis
- 6.4 Company Profiles (includes Global level Overview, Market level overview, Core Segments, Financials as available, Strategic Information, Market Rank/Share for key companies, Products and Services, and Recent Developments)
- 6.4.1 Schneider Electric
- 6.4.2 Siemens AG
- 6.4.3 Honeywell International Inc.
- 6.4.4 ABB Ltd.
- 6.4.5 General Electric
- 6.4.6 Eaton Corporation
- 6.4.7 Rockwell Automation Inc.
- 6.4.8 Johnson Controls
- 6.4.9 IBM Corporation
- 6.4.10 Oracle Corporation
- 6.4.11 SAP SE
- 6.4.12 Cisco Systems
- 6.4.13 Enel X
- 6.4.14 Autogrid Systems
- 6.4.15 Itron Inc.
- 6.4.16 Honeywell Smart Energy
- 6.4.17 Mitsubishi Electric
- 6.4.18 Yokogawa Electric
- 6.4.19 Tendril (Uplight)
- 6.4.20 WAGO Kontakttechnik
7 MARKET OPPORTUNITIES AND FUTURE OUTLOOK
- 7.1 White-space and Unmet-need Assessment
 2026年全球充电站能源管理系统市场报告2026年全球能源管理系统市场报告
 能源管理系统市场分析及预测(至2035年):依类型、产品类型、服务、技术、组件、应用、部署类型、最终用户、模组及功能划分
 能源管理系统市场-全球产业规模、份额、趋势、机会与预测:按类型、组件、部署类型、最终用户、地区和竞争格局划分,2021-2031年
 充电站能量计量系统市场(按充电站类型、连接器类型、计量技术、应用和最终用户划分),全球预测,2026-2032年先进能源管理系统市场(按组件、部署类型、技术、最终用户和应用划分),全球预测(2026-2032)
 能源管理系统(EMS)市场规模、份额和趋势分析报告:按系统、组件、部署、产业、地区和细分市场预测,2026-2033年
 能源管理系统 (EMS) 市场规模、占有率、成长及全球产业分析:按类型、应用和地区划分的洞察与预测 (2026-2034)
 能源管理系统市场规模、份额和成长分析(按系统类型、部署类型、产业垂直领域、组件和地区划分)-2026-2033年产业预测
 能源管理系统 (EMS) 市场预测(至 2032 年):按组件、解决方案、部署、应用、最终用户和地区进行的全球分析