


 |
市场调查报告书
商品编码
1851423
废弃物(WTE):市场份额分析、行业趋势、统计数据和成长预测(2025-2030 年)Waste To Energy (WTE) - Market Share Analysis, Industry Trends & Statistics, Growth Forecasts (2025 - 2030) |
||||||
※ 本网页内容可能与最新版本有所差异。详细情况请与我们联繫。
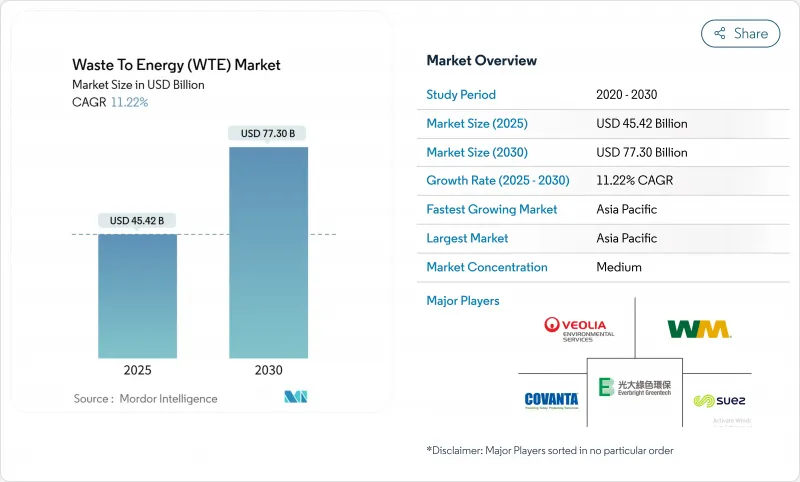
预计到 2025 年,废弃物发电 (WTE) 市场价值将达到 454.2 亿美元,到 2030 年将达到 773 亿美元,复合年增长率为 11.22%。
城市废弃物增多和全球对低碳电力的需求双重压力推动了成长。儘管火力发电仍然是产能扩张的支柱,但投资正转向等离子弧和先进厌氧消化等先进的低排放气体解决方案。韩国和欧盟积极的碳定价机制正在重塑计划经济格局,而印度二线城市的掩埋禁令则加速了原料供应。公用事业公司、环境服务公司和技术专家之间的策略整合仍在继续,而数位化优化工具正在提高新建和维修工厂的营运利润率和合规绩效。这些因素共同作用,维持了可融资计划的充足储备,并将垃圾焚化发电市场定位为循环经济的关键组成部分。
全球废弃物发电 (WTE) 市场趋势与洞察
中国大沿岸地区垃圾焚化发电官民合作关係计画快速发展
超过350亿元的投资正用于资助80多个计划,这些项目实施了先进的排放监控和材料回收设计。新建工厂将形成一个高产能丛集,每日处理能力超过40万吨,为该地区可扩展的城市废弃物解决方案树立了典范。预计到2024年,包括垃圾焚化发电在内的绿能能源发电量将年增16.4%,凸显了政策的积极性和投资者的信心。
欧盟绿色税收优惠政策加速老旧焚化炉的改装
绿色税收体系将融资与严格的能源指标挂钩,并提供约3亿欧元的资金,用于将废气系统升级与提高材料再利用率相结合的维修。符合资格的业者将享有更低的资金筹措成本和优先併网待遇,从而增强西欧和北欧的垃圾焚化发电市场。
由于戴奥辛排放法规更加严格,德国炉窑维修许可证的批准被推迟。
2024 年《工业排放指令》将收紧监管,并要求在 2035 年实施电子许可证制度,这将迫使老旧工厂的营运商重新设计其空气污染控制系统。合规成本和漫长的核准时间延缓了产能升级,削弱了欧洲最大经济体—波兰的垃圾焚化发电市场。
细分市场分析
到2024年,焚烧仍将占据废弃物发电市场65%的份额,这得益于其在欧洲和东亚地区成熟的营运经验以及与区域供热基础设施的整合。年产能超过20万吨的工厂仍继续采用炉排炉设计,因为其运作时间可预测且供应商网路成熟。然而,由于废弃物合成气的转化效率高达99%,且戴奥辛排放量显着降低,预计到2030年,等离子弧炉的产能将以16%的复合年增长率成长。低排放和高金属回收率带来的补贴进一步推动了等离子弧炉计划,尤其是在亚洲人口稠密的都市区。因此,垃圾焚化发电结合先进热能平台的市场规模正以高于平均的速度成长。
杂合反应趋势正在重塑资产规格。一些新建工厂将前端机械和生物处理与气化或等离子弧结合,以提高热转化前的回收率。同时,厌氧消化在农业地区再次受到关注,这些地区高水分有机废弃物能够以适中的资本成本提供优异的沼气产量。机械、热力和化学预处理目前可将甲烷产量提高25%至190%,从而扩大分散式消化器的经济效益范围。在预测期间内,数位孪生和人工智慧辅助燃烧控制可望在生命週期中将热岛效应效率提高4%至6%,进一步凸显下一代设施的差异化优势。
到2024年,都市固态废弃物将占废弃物焚化发电(WTE)市场规模的70%,这主要得益于稳定的垃圾收集量以及监管机构推动减少垃圾掩埋的压力。主要城市的高温工业废弃物和源头分类项目维持了原料的高品质,并为基本负载能源生产提供了支持。同时,随着各国政府致力于减少农村供应链中的甲烷排放,预计2030年,农业和农工废弃物将以14%的复合年增长率成长。鼓励农民供应作物秸秆和粪便的财务奖励,释放了先前未开发的能源潜力,而且透过沼气池的利用,也符合土壤健康目标。
塑胶、溶剂和高Bt污泥等工业废弃物推动了对专用迴转窑和流体化床系统的稳定需求。随着排放法规的日益严格,污水污泥的排放量也越来越大,需要额外的处理。热干燥结合简单的焚烧工艺,可以生产出富含磷的灰烬,这种灰烬可以回收製成肥料。这一趋势有助于提高废弃物发电厂的运转率,并延长其维护週期。
废弃物(WTE) 市场报告按技术(物理、热力、生物)、废弃物类型(城市固态废弃物、工业废弃物、其他)、能源输出(电力、热能、其他)、最终用户(公共产业和独立发电商、工业专属式电厂、区域供热运营商、运输燃料经销商)和地区(北美、欧洲、亚太地区、南美、中东和非洲)进行细分。
区域分析
亚太地区预计到2024年将占全球销售额的45%,并保持领先地位,到2030年该地区复合年增长率将达到13%。光是中国就有超过400座日处理量达40万吨的工厂在运作,预计到2025年将增加至70万吨/日。在「清洁印度运动2.0」(Swachh Bharat Mission 2.0)的指导下,印度的二线城市正在签署建设-运营-移交(BOT)协议,优先建设日处理量300-500吨的模组化生产线。日本在排放控制技术领域保持领先地位,韩国的排放权交易体系使其内部报酬率(IRR)模型提高了2.5个百分点,从而扩大了东北亚的垃圾焚化发电市场。
欧洲区域供热整合程度高,且环境法规严格,其销售额位居第二。丹麦和瑞典的地方政府供热网路中可再生能源占比已超过75%,欧盟的绿色税收政策正引导优惠资金用于工厂维修。德国由于戴奥辛法规更为严格,维修有所延迟;而英国的热值限制则促使低等级的垃圾衍生燃料(RDF)被送往国内焚烧炉,从而创造了新的本地需求。
北美地区正稳步扩张,主要得益于美国的大型公用事业计划和加拿大的生物甲烷投资。 Covanta、Waste Management 和 FCC Environmental Services 等公司正在竞相争取大型市政合同,而近期的收购也预示着该行业将进一步整合。在拉丁美洲,巴西中南部糖带的沼气应用日益普及,但原料价格波动导致计划储备不稳定。在中东和非洲,埃及耗资 1.2 亿美元的固态垃圾焚化发电发电厂引起了越来越多的关注,但整体推广仍处于早期阶段。
其他福利:
- Excel格式的市场预测(ME)表
- 3个月的分析师支持
目录
第一章 引言
- 研究假设和市场定义
- 调查范围
第二章调查方法
第三章执行摘要
第四章 市场情势
- 市场概览
- 市场驱动因素
- 中国大湾区垃圾焚化发电官民合作关係计画快速发展
- 欧盟绿色税收优惠政策加速老旧焚化炉的改装
- 印度二线城市全国禁止随意掩埋,以促进都市固体废弃物分流
- 更高的碳信用价格提高了韩国垃圾焚化发电计划的内部收益率
- 斯堪的纳维亚循环经济主导的沼气CPPA
- 英国脱欧后,英国对RDF出口实施强制性热基准值
- 市场限制
- 由于戴奥辛排放法规更加严格,德国炉篦维修许可证申请被延后。
- 有限的废弃物处理费增长阻碍了印尼计划的融资可行性。
- 巴西厌氧消化原料价格波动损害利润率
- 澳洲近郊地区社区反对等离子弧设施
- 供应链分析
- 技术展望
- 监理展望
- 波特五力模型
- 供应商的议价能力
- 消费者议价能力
- 新进入者的威胁
- 替代品的威胁
- 竞争对手之间的竞争
- 投资分析
第五章 市场规模与成长预测
- 透过技术
- 物理处理(废弃物衍生燃料、机械和生物处理)
- 热能(焚烧/燃烧、气化、热解、等离子弧)
- 生物法(厌氧消化、发酵)
- 废弃物类型
- 固态废弃物
- 工业废弃物
- 农业及农业残余物
- 污水污泥
- 其他(商业、建筑、危险物质)
- 按能量输出
- 电
- 热
- 热电联产(CHP)
- 运输燃料(生物天然气、生物液化天然气、乙醇)
- 最终用户
- 公共产业和独立发电商(IPP)
- 工业专属式工厂
- 区域供热运营商
- 运输燃料分销商
- 按地区
- 北美洲
- 美国
- 加拿大
- 墨西哥
- 欧洲
- 英国
- 德国
- 法国
- 西班牙
- 北欧国家
- 俄罗斯
- 其他欧洲地区
- 亚太地区
- 中国
- 印度
- 日本
- 韩国
- 东南亚国协
- 亚太其他地区
- 南美洲
- 巴西
- 阿根廷
- 哥伦比亚
- 其他南美洲
- 中东和非洲
- 阿拉伯聯合大公国
- 沙乌地阿拉伯
- 南非
- 埃及
- 其他中东和非洲地区
- 北美洲
第六章 竞争情势
- 市场集中度
- 策略性倡议(併购、伙伴关係、购电协议)
- 市场占有率分析(主要企业的市场排名/份额)
- 公司简介
- Veolia Environnement SA
- Suez SA
- Waste Management Inc.
- Covanta Holding Corp.
- Wheelabrator Technologies Inc.
- Mitsubishi Heavy Industries Ltd
- Hitachi Zosen Corp.
- Babcock & Wilcox Enterprises Inc.
- A2A SpA
- MVV Energie AG
- Martin GmbH fur Umwelt-und Energietechnik
- China Everbright Environment Group Ltd
- China Jinjiang Environment Holding Co.
- Xcel Energy Inc.
- Shenzhen Energy Group Co.
- Keppel Seghers
- Remondis SE & Co. KG
- FCC Servicios Medio Ambiente
- Enerkem Inc.
- Sembcorp Industries Ltd
- Green Conversion Systems LLC
- Fortum Oyj
第七章 市场机会与未来展望
The Waste To Energy Market size is estimated at USD 45.42 billion in 2025, and is expected to reach USD 77.30 billion by 2030, at a CAGR of 11.22% during the forecast period (2025-2030).
Growth rests on two converging pressures: swelling urban waste streams and the worldwide push for low-carbon power. Thermal technologies remain the backbone of capacity additions, yet investments are shifting toward advanced, lower-emission solutions such as plasma-arc and upgraded anaerobic digestion. Active carbon-price regimes in South Korea and the European Union are reshaping project economics, while landfill bans in India's Tier-2 cities accelerate feedstock availability. Strategic consolidation among utilities, environmental services firms, and technology specialists continues, and digital optimization tools are lifting operating margins and compliance performance across new and retrofit plants. Together, these forces sustain a robust pipeline of bankable projects and position the waste-to-energy market as a pivotal element of the circular economy.
Global Waste To Energy (WTE) Market Trends and Insights
Rapid Roll-out of EfW Public-Private Partnership Pipelines in China's Greater Bay Area
Investments topping CNY 35 billion are funding more than 80 projects that deploy advanced emissions monitoring and material-recovery designs. New plants form a high-capacity cluster processing over 400,000 tons daily, cementing the region's template for scalable urban waste solutions. Electricity output from clean sources, including WTE, rose 16.4% year-on-year in 2024, confirming policy momentum and investor confidence.
EU Green Taxonomy Incentives Accelerating Retrofit of Legacy Incineration Fleets
The Green Taxonomy links financing to strict energy-efficiency metrics, unlocking roughly EUR 300 million for retrofit work that couples upgraded flue-gas systems with expanded material reclamation. Operators that comply gain lower funding costs and priority grid access, reinforcing the waste-to-energy market across Western and Northern Europe.
Stricter Dioxin Emission Caps Postponing Permits for Grate-Furnace Refurbishments in Germany
The 2024 Industrial Emissions Directive tightens limits and mandates e-permits by 2035, forcing operators of older plants to redesign air-pollution-control systems. Compliance costs and protracted approvals delay capacity upgrades and dampen the waste-to-energy market in Europe's largest economy.
Other drivers and restraints analyzed in the detailed report include:
- National Bans on Unsegregated Landfill Triggering MSW Diversion in India's Tier-2 Cities
- Soaring Carbon Credit Prices Improving WTE Project IRRs in South Korea
- Limited Tipping-Fee Escalation Clauses Hurting Project Bankability in Indonesia
For complete list of drivers and restraints, kindly check the Table Of Contents.
Segment Analysis
Incineration retained 65% of the waste to energy market share in 2024, anchored by proven operational history and integration with district-heat infrastructure across Europe and East Asia. Plants above 200,000 tpa continue to deploy grate-furnace designs due to predictable runtime and established supplier networks. Nevertheless, plasma-arc capacity is forecast to log a 16% CAGR to 2030, thanks to 99% waste-to-syngas conversion efficiency and sharply lower dioxin formation. Subsidy schemes that reward lower emissions and higher metals recovery further tilt project pipelines toward plasma-arc, especially in densely populated Asian conurbations. The waste to energy market size tied to advanced thermal platforms therefore accelerates faster than the headline rate.
Hybridization trends are reshaping asset specifications: several new builds bundle front-end mechanical biological treatment with either gasification or plasma-arc to boost recycling yields before thermal conversion. Meanwhile, anaerobic digestion enjoys renewed focus in agrarian regions where high-moisture organic waste offers superior biogas yields at modest capital cost. Mechanical, thermal, and chemical pretreatments now lift methane production by 25%-190%, widening the economic sweet spot for distributed digesters. Over the forecast period, digital twins and AI-assisted combustion controls are expected to enhance thermal-island efficiency by 4%-6% on a lifecycle basis, further differentiating next-generation facilities.
Municipal solid waste accounted for 70% of the waste to energy market size in 2024, buoyed by steady collection volumes and regulatory pressure to move away from landfilling. High calorific industrial fractions and source-segregation programs in major cities sustain robust feedstock quality, supporting baseload energy output. Agricultural and agro-industrial residues, however, will post a 14% CAGR through 2030 as governments target methane mitigation in rural supply chains. Financial incentives for farmers to supply crop stover and manure unlock previously untapped energy potential and align with soil-health goals via digestate use.
Industrial waste streams featuring plastics, solvents, and high-Btu sludges present stable demand for specialized rotary-kiln and fluidized-bed systems. Sewage sludge gains visibility where stricter discharge norms require additional treatment: thermal drying coupled with mono-incineration now yields phosphorus-rich ash that can be recycled into fertilizer. Across categories, pre-processing and optical sorting technologies are raising net calorific value and reducing contaminants, a trend that supports higher plant availability and longer maintenance cycles within the waste to energy market.
The Waste To Energy (WTE) Market Report is Segmented by Technology (Physical, Thermal, and Biological), Waste Type (Municipal Solid Waste, Industrial Waste, and Others), Energy Output (Electricity, Heat, and Others), End-Users (Utilities and IPPs, Industrial Captive Plants, District Heating Operators, and Transport Fuel Distributors), and Geography (North America, Europe, Asia-Pacific, South America, and Middle East and Africa).
Geography Analysis
Asia-Pacific posted 45% of 2024 revenue and will hold the pole position with a 13% regional CAGR to 2030. China alone operates over 400 plants processing 400,000 tons daily, with the capacity to climb to 700,000 tons per day by 2025. India's Tier-2 cities, guided by Swachh Bharat Mission 2.0, are issuing build-operate-transfer contracts that favor modular lines sized at 300-500 tpd. Japan sustains leadership in emissions control technologies, and South Korea's emissions-trading scheme raises modeled IRRs by up to 2.5 percentage points, broadening the waste-to-energy market in Northeast Asia.
Europe ranks second by revenue, characterized by dense district-heat integration and rigorous environmental regulation. Denmark and Sweden already surpass 75% renewable share in municipal heat networks, and the EU Green Taxonomy channels concessional capital into plant retrofits. Germany faces retrofit delays from stricter dioxin caps, while the United Kingdom's calorific-value rules redirect lower-grade RDF to domestic incinerators, creating new local capacity demand.
North America registers steady expansion anchored by utility-scale projects in the United States and biomethane investments in Canada. Covanta, Waste Management, and FCC Environmental Services vie for large municipal contracts, with recent acquisitions signaling further consolidation. South America sees biogas rollouts in Brazil's south-central sugar belt, yet feedstock-price volatility tempers project pipelines. In the Middle East and Africa, Egypt's USD 120 million solid waste-to-electricity plant illustrates rising interest, though overall deployment remains early-stage.
- Veolia Environnement SA
- Suez SA
- Waste Management Inc.
- Covanta Holding Corp.
- Wheelabrator Technologies Inc.
- Mitsubishi Heavy Industries Ltd
- Hitachi Zosen Corp.
- Babcock & Wilcox Enterprises Inc.
- A2A SpA
- MVV Energie AG
- Martin GmbH fur Umwelt- und Energietechnik
- China Everbright Environment Group Ltd
- China Jinjiang Environment Holding Co.
- Xcel Energy Inc.
- Shenzhen Energy Group Co.
- Keppel Seghers
- Remondis SE & Co. KG
- FCC Servicios Medio Ambiente
- Enerkem Inc.
- Sembcorp Industries Ltd
- Green Conversion Systems LLC
- Fortum Oyj
Additional Benefits:
- The market estimate (ME) sheet in Excel format
- 3 months of analyst support
TABLE OF CONTENTS
1 Introduction
- 1.1 Study Assumptions & Market Definition
- 1.2 Scope of the Study
2 Research Methodology
3 Executive Summary
4 Market Landscape
- 4.1 Market Overview
- 4.2 Market Drivers
- 4.2.1 Rapid roll-out of EfW public-private partnership pipelines in China's Greater Bay Area
- 4.2.2 EU Green Taxonomy incentives accelerating retrofit of legacy incineration fleets
- 4.2.3 National bans on unsegregated landfill triggering MSW diversion in India's Tier-2 cities
- 4.2.4 Soaring carbon credit prices improving WTE project IRRs in South Korea
- 4.2.5 Circular-economy led corporate power-purchase agreements (CPPAs) for biogas in Nordics
- 4.2.6 Mandatory calorific value thresholds for RDF exports in the UK post-Brexit
- 4.3 Market Restraints
- 4.3.1 Stricter dioxin emission caps postponing permits for grate-furnace refurbishments in Germany
- 4.3.2 Limited tipping-fee escalation clauses hurting project bankability in Indonesia
- 4.3.3 Anaerobic-digestion feedstock price volatility undermining margins in Brazil
- 4.3.4 Community push-back against plasma-arc facilities in Australia's peri-urban regions
- 4.4 Supply-Chain Analysis
- 4.5 Technological Outlook
- 4.6 Regulatory Outlook
- 4.7 Porter's Five Forces
- 4.7.1 Bargaining Power of Suppliers
- 4.7.2 Bargaining Power of Consumers
- 4.7.3 Threat of New Entrants
- 4.7.4 Threat of Substitutes
- 4.7.5 Intensity of Competitive Rivalry
- 4.8 Investment Analysis
5 Market Size & Growth Forecasts
- 5.1 By Technology
- 5.1.1 Physical (Refuse-Derived Fuel, Mechanical Biological Treatment)
- 5.1.2 Thermal (Incineration/Combustion, Gasification, Pyrolysis and Plasma-Arc)
- 5.1.3 Biological (Anaerobic Digestion, Fermentation)
- 5.2 By Waste Type
- 5.2.1 Municipal Solid Waste
- 5.2.2 Industrial Waste
- 5.2.3 Agricultural and Agro-industrial Residues
- 5.2.4 Sewage Sludge
- 5.2.5 Others (Commercial, Construction, Hazardous)
- 5.3 By Energy Output
- 5.3.1 Electricity
- 5.3.2 Heat
- 5.3.3 Combined Heat and Power (CHP)
- 5.3.4 Transportation Fuels (Bio-SNG, Bio-LNG, Ethanol)
- 5.4 By End-user
- 5.4.1 Utilities and Independent Power Producers (IPPs)
- 5.4.2 Industrial Captive Plants
- 5.4.3 District Heating Operators
- 5.4.4 Transport Fuel Distributors
- 5.5 By Geography
- 5.5.1 North America
- 5.5.1.1 United States
- 5.5.1.2 Canada
- 5.5.1.3 Mexico
- 5.5.2 Europe
- 5.5.2.1 United Kingdom
- 5.5.2.2 Germany
- 5.5.2.3 France
- 5.5.2.4 Spain
- 5.5.2.5 Nordic Countries
- 5.5.2.6 Russia
- 5.5.2.7 Rest of Europe
- 5.5.3 Asia-Pacific
- 5.5.3.1 China
- 5.5.3.2 India
- 5.5.3.3 Japan
- 5.5.3.4 South Korea
- 5.5.3.5 ASEAN Countries
- 5.5.3.6 Rest of Asia-Pacific
- 5.5.4 South America
- 5.5.4.1 Brazil
- 5.5.4.2 Argentina
- 5.5.4.3 Colombia
- 5.5.4.4 Rest of South America
- 5.5.5 Middle East and Africa
- 5.5.5.1 United Arab Emirates
- 5.5.5.2 Saudi Arabia
- 5.5.5.3 South Africa
- 5.5.5.4 Egypt
- 5.5.5.5 Rest of Middle East and Africa
- 5.5.1 North America
6 Competitive Landscape
- 6.1 Market Concentration
- 6.2 Strategic Moves (M&A, Partnerships, PPAs)
- 6.3 Market Share Analysis (Market Rank/Share for key companies)
- 6.4 Company Profiles (includes Global level Overview, Market level overview, Core Segments, Financials as available, Strategic Information, Products & Services, and Recent Developments)
- 6.4.1 Veolia Environnement SA
- 6.4.2 Suez SA
- 6.4.3 Waste Management Inc.
- 6.4.4 Covanta Holding Corp.
- 6.4.5 Wheelabrator Technologies Inc.
- 6.4.6 Mitsubishi Heavy Industries Ltd
- 6.4.7 Hitachi Zosen Corp.
- 6.4.8 Babcock & Wilcox Enterprises Inc.
- 6.4.9 A2A SpA
- 6.4.10 MVV Energie AG
- 6.4.11 Martin GmbH fur Umwelt- und Energietechnik
- 6.4.12 China Everbright Environment Group Ltd
- 6.4.13 China Jinjiang Environment Holding Co.
- 6.4.14 Xcel Energy Inc.
- 6.4.15 Shenzhen Energy Group Co.
- 6.4.16 Keppel Seghers
- 6.4.17 Remondis SE & Co. KG
- 6.4.18 FCC Servicios Medio Ambiente
- 6.4.19 Enerkem Inc.
- 6.4.20 Sembcorp Industries Ltd
- 6.4.21 Green Conversion Systems LLC
- 6.4.22 Fortum Oyj
7 Market Opportunities & Future Outlook
- 7.1 White-space & unmet-need assessment
 亚太地区废弃物製氢(WtH)市场:按应用、技术、废弃物类型和国家分類的分析和预测(2025-2035 年)
 欧洲废弃物氢气市场按应用、技术、垃圾类型和国家划分-分析与预测(2025-2035 年)
 先进废弃物能源化技术市场分析及预测(至2035年):按类型、产品类型、技术、组件、应用、最终用户、製程、安装类型、设备和解决方案划分
 2026-2030年全球废弃物发电市场
 垃圾焚化发电市场-全球产业规模、份额、趋势、机会及预测(依技术、废弃物类型、应用、地区及竞争格局划分,2021-2031年)
 全球废弃物发电用炉排锅炉市场(按燃料类型、技术类型、容量、安装类型、运作模式、应用和最终用户划分)预测(2026-2032年)
 废弃物技术及应用趋势:2032 年市场预测-按废弃物类型、技术、最终用户和地区划分:全球分析
 日本垃圾发电市场报告(按技术(物理、热力、生物)和地区划分,2026-2034年)
 垃圾焚化发电(WtE) 市场规模、份额和成长分析(按技术、废弃物类型、应用和地区划分)—产业预测 (2026-2033)
 全球废弃物氢气市场:按应用、技术、废弃物类型和国家分類的分析和预测(2025-2035 年)