


 |
市场调查报告书
商品编码
1844615
欧洲垃圾焚化发电:市场份额分析、产业趋势、统计数据和成长预测(2025-2030 年)Europe Waste-to-Energy - Market Share Analysis, Industry Trends & Statistics, Growth Forecasts (2025 - 2030) |
||||||
※ 本网页内容可能与最新版本有所差异。详细情况请与我们联繫。
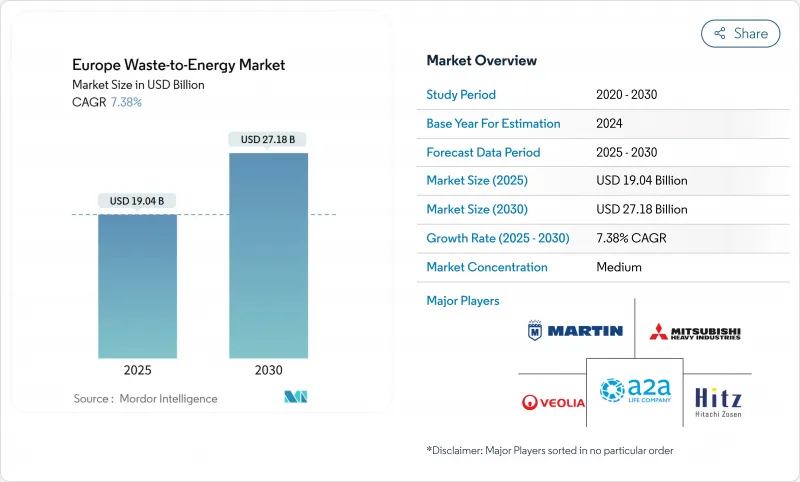
预计 2025 年欧洲垃圾焚化发电市场规模为 190.4 亿美元,到 2030 年将达到 271.8 亿美元,预测期内(2025-2030 年)的复合年增长率为 7.38%。
与欧盟废弃物和气候指令的政策协调、煤炭产能的缩减以及掩埋收费的增加将推动设施利用率的提高。欧盟碳边境调整机制 (CBAM) 等与碳相关的奖励将创造新的收益来源,而北欧和中欧及东欧的区域供热建设将提高计划的融资能力。超过 750 吨/天的大型工厂正在获得发展势头,因为大型工厂降低了单独捕集的维修成本,并更容易从欧盟创新基金获得资金。德国、义大利、波兰、北欧和英国的新建项目数量依然强劲,而这些国家的社会对都市区排放的敏感性以及批发电价的疲软正在抑製成长。因此,欧洲垃圾焚化发电市场正在巩固其作为推动掩埋转移的稳定产能提供者的角色。
欧洲垃圾焚化发电市场趋势与洞察
欧盟废弃物框架指令2018/851旨在促进掩埋转移
该指令规定,到2035年,地方政府掩埋处理量不得超过10%,并鼓励成员国增加剩余废弃物的供热供给能力。儘管2010年至2020年间掩埋量下降了27.5%,但仍有14个国家面临不合规风险,这促使它们加速采购新的焚化和厌氧消化厂。波兰和罗马尼亚优先考虑欧盟凝聚基金的资金,为承包设施提供资金,并压缩核准窗口以满足最后期限。能源回收的优先顺序高于废弃物处理,这使得市政当局有理由提高门票费,从而增加计划收益。东欧当局将垃圾焚化发电视为解决掩埋转移和冬季尖峰时段电力短缺的双重解决方案,以支持整个欧洲垃圾焚化发电市场的需求。
欧盟碳边境调整机制的出现将推动废弃物衍生能源信用的需求
CBAM 将于 2026 年全面启动,将垃圾焚化发电取代化石能源发电所减少的排放收益。碳强度较低的设施将获得优质证书,而工业买家则必须放弃这些证书,从而有效地补贴工厂收益。随着欧盟排放交易体系 (EU ETS) 价格趋于每吨二氧化碳 80 欧元以上,这些证书将提高新建设的内部收益率。开发商已开始采用先进的废气处理技术来检验其碳排放係数。由于碳排放电力的进口商需缴纳同等课税,该计划间接保护了国内运营商,并进一步增强了欧洲垃圾焚化发电市场。
都市区反对派运动和诉讼愈演愈烈
环保组织利用2024年欧洲人权法院关于气候变迁的裁决,对许可证提出质疑,并延长核准流程。阿姆斯特丹一座拟建的发电厂因居民请愿而被叫停,马德里也面临类似的强烈反对。法律的不确定性提高了贷款机构的风险溢价,并要求开发商在焚烧前证明其已采取了彻底的回收措施。虽然像哥本哈根这样的公共部门业主享有更高的社会认可度,但私人特许特许经营通常包括公民监督委员会。这些动态正在减缓人口密集城市的计划部署,并限制了欧洲垃圾焚化发电市场近期的产能成长。
細項分析
到2024年,火力发电路线将贡献该领域60%的收益。气化和热解试验工厂目前由欧盟创新基金支持,这表明政策倾向于支持碳捕集的设计。随着厌氧消化达到再生能源欧盟(REPowerEU)到2030年350亿立方公尺生物甲烷的目标,生物产业丛集将以12.2%的复合年增长率成长。结合预分选、固态消化和垃圾衍生燃料燃烧的一体化设施可减少剩余掩埋量,并提高循环经济指标。与生物解决方案相关的欧洲垃圾焚化发电市场预计将从2025年的54亿美元扩大到2030年的82亿美元,证实了投资者对低碳气体的兴趣。
日立造船Innova、马丁有限公司和巴布科克威尔科克斯等火电供应商正透过模组化炉排管线和整合富氧燃烧捕集口来应对这项挑战。计划发起方目前正在设计超越工业排放指令限值的烟气处理方案,从而缩短后续捕集整合的前置作业时间。生物技术供应商正专注于开发适用于小型城市的货柜式消化池,以扩大其容量。可调节空气流量、炉渣处理和消化池停留时间的数位控制器可将运转率提高近92%,从而增强整个欧洲垃圾焚化发电市场的收益韧性。
到2024年,都市固态废弃物(MSW)将占处理量的62%,这得益于成熟的收集物流和强制性的最低处置量。然而,随着农民将粪肥和作物残茬收益以遵守《硝酸盐指令》,农业和农工废弃物每年将以11.4%的速度成长。受义大利和丹麦天然气管网注入溢价的支撑,到2030年,欧洲垃圾焚化发电市场规模可能达到67亿美元。
肉类加工内臟和乳酪乳清是高产沼气来源,投资回收期不到12个月,吸引了合作社拥有的沼气池。随着都市区增长和污水处理法规的日益严格,污水污泥量不断增加,促使营业单位安装污泥焚烧炉以实现能源独立。商业和工业回收材料(例如包装和纺织品)具有高热值,需要预先分类机器人去除聚氯乙烯和金属。混合进料策略透过平衡热值波动并确保全年供应链,提高了整个欧洲垃圾焚化发电市场的工厂利用率。
欧洲垃圾焚化发电市场报告按技术(物理、热、生物)、废弃物类型(都市固态废弃物、工业废弃物、农业和农业工业残留物、污水污泥等)、能源输出(电力、热能等)、最终用户(工业专属式电厂、运输燃料分销商等)和国家(德国、英国、义大利、法国、北欧国家等)进行细分。
其他福利:
- Excel 格式的市场预测 (ME) 表
- 3个月的分析师支持
目录
第一章 引言
- 研究假设和市场定义
- 调查范围
第二章调查方法
第三章执行摘要
第四章 市场状况
- 市场概况
- 市场驱动因素
- 欧盟废弃物框架指令2018/851旨在推动掩埋转移
- 引入欧盟碳边境调整机制,以增加对废弃物衍生能源信用的需求
- 德国燃煤发电厂快速退役,对废弃物发电产生基本负载需求
- 北欧和中东欧区域供热扩张推动热电联产废弃物发电厂发展
- 英国和法国提高掩埋场收费,改善废弃物发电经济
- 欧盟创新基金为碳捕集型废弃物发电设施津贴
- 市场限制
- 公众对城市中心焚烧的反对和诉讼日益增加(阿姆斯特丹、马德里)
- 风能和太阳能发电量激增导致批发电价下跌,损害了 WtE 的收益
- 由于欧盟工业排放指令许可延迟,计划前置作业时间延长
- 先进(化学)回收的竞争夺走了塑胶原料的流动
- 供应链分析
- 监理展望
- 技术展望
- 波特五力分析
- 供应商的议价能力
- 买方的议价能力
- 新进入者的威胁
- 替代品的威胁
- 竞争对手之间的竞争
第五章市场规模及成长预测
- 依技术
- 物理处理(固态燃料、机械和生物处理)
- 热(焚烧/燃烧、气化、热解、等离子/电弧)
- 生物处理(厌氧消化、发酵)
- 依废弃物类型
- 都市固态废弃物(MSW)
- 工业废弃物
- 农业和农业残留物
- 污水污泥
- 其他(商业废弃物、建筑废弃物、危险废弃物)
- 按能量输出
- 电
- 热
- 热电联产(CHP)
- 运输燃料(生物天然气、生物液化天然气、乙醇)
- 按最终用户
- 公共产业和独立电力生产商(IPP)
- 工业专属式电厂
- 区域供热运营商
- 运输燃料分销商
- 按国家
- 德国
- 英国
- 法国
- 义大利
- 西班牙
- 北欧国家(丹麦、瑞典、芬兰、挪威)
- 波兰
- 土耳其
- 俄罗斯
- 其他欧洲国家
第六章 竞争态势
- 市场集中度
- 策略性倡议(併购、伙伴关係、购电协议)
- 市场占有率分析(主要企业的市场排名/份额)
- 公司简介
- Veolia Environnement SA
- SUEZ SA
- Hitachi Zosen Inova AG
- Mitsubishi Heavy Industries Environmental & Chemical Engineering Co.
- Martin GmbH
- A2A SpA
- STEAG Energy Services GmbH
- Wheelabrator Technologies
- EEW Energy from Waste GmbH
- Indaver NV
- AVR Afvalverwerking BV
- Viridor Ltd.
- FCC Environment Ltd.
- Zabalgarbi SA
- Tiru SA(Paprec Group)
- Cory Group
- Geminor AS
- Remondis SE & Co. KG
- Babcock & Wilcox Volund A/S
- Keppel Seghers Belgium NV
第七章 市场机会与未来展望
The Europe Waste-to-Energy Market size is estimated at USD 19.04 billion in 2025, and is expected to reach USD 27.18 billion by 2030, at a CAGR of 7.38% during the forecast period (2025-2030).
Policy alignment across EU waste and climate directives, shrinking coal capacity, and rising landfill gate fees lift facility utilization rates. Carbon-linked incentives such as the EU Carbon Border Adjustment Mechanism (CBAM) create new revenue streams while district-heating build-outs in Nordic and Central-Eastern Europe improve project bankability. Large-scale plants above 750 tpd gain momentum because scale lowers capture-ready retrofit costs and eases EU Innovation Fund capital access. Public sensitivity toward urban emissions and wholesale power-price softness temper growth have not derailed newbuild pipelines in Germany, Italy, Poland, the Nordics, and the United Kingdom. As a result, the European waste-to-energy market is consolidating its role as a firm capacity provider that drives landfill diversion.
Europe Waste-to-Energy Market Trends and Insights
EU Waste Framework Directive 2018/851 Targets Driving Diversion from Landfill
The Directive caps municipal landfills at 10% by 2035, pushing member states to add thermal capacity for residual waste streams. Landfilled volumes fell 27.5% between 2010-2020, yet 14 nations risk infringement, accelerating procurement for new incineration and anaerobic digestion plants . Poland and Romania prioritize EU cohesion funds to finance turnkey facilities, compressing approval windows to meet the deadline. Because energy recovery sits above disposal in the hierarchy, municipalities justify higher gate fees that improve project returns. Eastern European authorities see waste-to-energy as a twin answer to landfill diversion and winter-peak electricity deficits, underpinning demand across the European waste-to-energy market.
Upcoming EU Carbon Border Adjustment Mechanism Boosting Demand for Waste-Derived Energy Credits
CBAM's full launch in 2026 monetizes avoided emissions when waste-to-energy electricity displaces fossil generation. Facilities demonstrating lower carbon intensity earn premium certificates that industrial buyers must surrender, effectively subsidizing plant revenues. With EU ETS prices trending above EUR 80/tCO2, certificates enhance internal rates of return for new builds. Developers have started embedding advanced flue-gas treatment to verify carbon factors. The mechanism indirectly shields domestic operators because importers of carbon-heavy electricity face equivalent levies, further strengthening the European waste-to-energy market.
Escalating Public Opposition and Litigation in Urban Hubs
Environmental groups leverage the 2024 European Court of Human Rights ruling on climate action to contest permits, lengthening approval processes. Amsterdam halted a planned plant after resident petitions, while Madrid faces similar pushback. Legal uncertainties raise lender risk premiums and oblige developers to prove exhaustive recycling efforts before incineration. Although public-sector owners such as Copenhagen record higher social acceptance, private concessions increasingly include citizen oversight boards. These dynamics slow project roll-outs in dense cities and curb near-term capacity additions within the European waste-to-energy market.
Other drivers and restraints analyzed in the detailed report include:
- Rapid Decommissioning of Coal Power Plants in Germany Creating Baseload Demand
- District-Heating Expansion in Nordics & CEE Favouring CHP Plants
- Declining Wholesale Power Prices from Wind & Solar Surge
For complete list of drivers and restraints, kindly check the Table Of Contents.
Segment Analysis
Thermal routes generated 60% of segment revenue in 2024, driven by established grate combustion fleets spread across 19 EU members. Gasification and pyrolysis pilots now secure EU Innovation Fund support, indicating policy preference for capture-ready designs. The biological cluster grows at a 12.2% CAGR as anaerobic digestion aligns with the REPowerEU biomethane goal of 35 bcm by 2030. Integrated sites that marry front-end sorting with digestion for organics and combustion for refuse-derived fuel cut residual landfill volumes, boosting circularity metrics. The Europe waste-to-energy market size linked to biological solutions is projected to climb from USD 5.4 billion in 2025 to USD 8.2 billion in 2030, underscoring investor appetite for low-carbon gases.
Thermal suppliers such as Hitachi Zosen Inova, Martin GmbH, and Babcock & Wilcox respond by modularising grate lines and embedding oxy-fuel capture ports. Project sponsors now design flue-gas treatment to exceed Industrial Emissions Directive ceilings, shortening later capture integration lead times. Biological technology providers focus on containerized digesters suitable for small municipalities, broadening addressable volumes. Digital controls that adjust air flow, slag handling, and digester retention times raise availability by close to 92%, enhancing revenue resilience across the European waste-to-energy market.
Municipal solid waste (MSW) represented 62% throughput in 2024, thanks to mature collection logistics and minimum disposal mandates. However, agricultural and agro-industrial residues grow 11.4% annually as farmers monetise manure and crop residues to meet the nitrates directives. The European waste-to-energy market size attributable to agricultural feedstock could reach USD 6.7 billion by 2030, supported by gas-grid injection premiums in Italy and Denmark.
Meat-processing offal and cheese whey supply high-yield biogas streams that cut payback to under 12 months, attracting co-operative-owned digesters. Sewage sludge volumes climb with urban population growth and tighter wastewater rules, prompting water utilities to install sludge incinerators for energy self-sufficiency. Commercial and industrial recyclables such as packaging and textiles offer higher calorific value but demand pre-sort robotics to remove PVC and metals. Blended-feed strategies even out calorific swings and secure year-round supply chains, enhancing plant utilization across the European waste-to-energy market.
The Europe Waste-To-Energy Market Report is Segmented by Technology (Physical, Thermal, and Biological), Waste Type (Municipal Solid Waste, Industrial Waste, Agricultural and Agro-Industrial Residues, Sewage Sludge, and Others), Energy Output (Electricity, Heat, and More), End-User (Industrial Captive Plants, Transport Fuel Distributors, and More), and Country (Germany, United Kingdom, Italy, France, Nordic Countries, and More).
List of Companies Covered in this Report:
- Veolia Environnement SA
- SUEZ SA
- Hitachi Zosen Inova AG
- Mitsubishi Heavy Industries Environmental & Chemical Engineering Co.
- Martin GmbH
- A2A SpA
- STEAG Energy Services GmbH
- Wheelabrator Technologies
- EEW Energy from Waste GmbH
- Indaver NV
- AVR Afvalverwerking BV
- Viridor Ltd.
- FCC Environment Ltd.
- Zabalgarbi S.A.
- Tiru S.A. (Paprec Group)
- Cory Group
- Geminor AS
- Remondis SE & Co. KG
- Babcock & Wilcox Volund A/S
- Keppel Seghers Belgium NV
Additional Benefits:
- The market estimate (ME) sheet in Excel format
- 3 months of analyst support
TABLE OF CONTENTS
1 Introduction
- 1.1 Study Assumptions & Market Definition
- 1.2 Scope of the Study
2 Research Methodology
3 Executive Summary
4 Market Landscape
- 4.1 Market Overview
- 4.2 Market Drivers
- 4.2.1 EU Waste Framework Directive 2018/851 Targets Driving Diversion from Landfill
- 4.2.2 Upcoming EU Carbon Border Adjustment Mechanism Boosting Demand for Waste-Derived Energy Credits
- 4.2.3 Rapid Decommissioning of Coal Power Plants in Germany Creating Baseload Demand for WtE Electricity
- 4.2.4 District-Heating Expansion in Nordics & CEE Favouring CHP WtE Plants
- 4.2.5 Rising Gate Fees for Landfill Operations in the UK & France Enhancing WtE Economics
- 4.2.6 EU Innovation-Fund Grants for Carbon-Capture-Ready WtE Facilities
- 4.3 Market Restraints
- 4.3.1 Escalating Public Opposition & Litigation Against Incineration in Urban Hubs (Amsterdam, Madrid)
- 4.3.2 Declining Wholesale Power Prices from Surging Wind & Solar Undermining WtE Revenue
- 4.3.3 Permitting Delays Under the EU Industrial Emissions Directive Increasing Project Lead-Times
- 4.3.4 Competition from Advanced (Chemical) Recycling Stealing Plastic Feedstock Streams
- 4.4 Supply-Chain Analysis
- 4.5 Regulatory Outlook
- 4.6 Technological Outlook
- 4.7 Porters Five Forces Analysis
- 4.7.1 Bargaining Power of Suppliers
- 4.7.2 Bargaining Power of Buyers
- 4.7.3 Threat of New Entrants
- 4.7.4 Threat of Substitutes
- 4.7.5 Competitive Rivalry
5 Market Size & Growth Forecasts
- 5.1 By Technology
- 5.1.1 Physical (Refuse-Derived Fuel, Mechanical Biological Treatment)
- 5.1.2 Thermal (Incineration/Combustion, Gasification, Pyrolysis and Plasma-Arc)
- 5.1.3 Biological (Anaerobic Digestion, Fermentation)
- 5.2 By Waste Type
- 5.2.1 Municipal Solid Waste (MSW)
- 5.2.2 Industrial Waste
- 5.2.3 Agricultural and Agro-industrial Residues
- 5.2.4 Sewage Sludge
- 5.2.5 Others (Commercial, Construction, Hazardous)
- 5.3 By Energy Output
- 5.3.1 Electricity
- 5.3.2 Heat
- 5.3.3 Combined Heat and Power (CHP)
- 5.3.4 Transportation Fuels (Bio-SNG, Bio-LNG, Ethanol)
- 5.4 By End-user
- 5.4.1 Utilities and Independent Power Producers (IPPs)
- 5.4.2 Industrial Captive Plants
- 5.4.3 District Heating Operators
- 5.4.4 Transport Fuel Distributors
- 5.5 By Country
- 5.5.1 Germany
- 5.5.2 United Kingdom
- 5.5.3 France
- 5.5.4 Italy
- 5.5.5 Spain
- 5.5.6 Nordic Countries (Denmark, Sweden, Finland, Norway)
- 5.5.7 Poland
- 5.5.8 Turkey
- 5.5.9 Russia
- 5.5.10 Rest of Europe
6 Competitive Landscape
- 6.1 Market Concentration
- 6.2 Strategic Moves (M&A, Partnerships, PPAs)
- 6.3 Market Share Analysis (Market Rank/Share for key companies)
- 6.4 Company Profiles (includes Global level Overview, Market level overview, Core Segments, Financials as available, Strategic Information, Products & Services, and Recent Developments)
- 6.4.1 Veolia Environnement SA
- 6.4.2 SUEZ SA
- 6.4.3 Hitachi Zosen Inova AG
- 6.4.4 Mitsubishi Heavy Industries Environmental & Chemical Engineering Co.
- 6.4.5 Martin GmbH
- 6.4.6 A2A SpA
- 6.4.7 STEAG Energy Services GmbH
- 6.4.8 Wheelabrator Technologies
- 6.4.9 EEW Energy from Waste GmbH
- 6.4.10 Indaver NV
- 6.4.11 AVR Afvalverwerking BV
- 6.4.12 Viridor Ltd.
- 6.4.13 FCC Environment Ltd.
- 6.4.14 Zabalgarbi S.A.
- 6.4.15 Tiru S.A. (Paprec Group)
- 6.4.16 Cory Group
- 6.4.17 Geminor AS
- 6.4.18 Remondis SE & Co. KG
- 6.4.19 Babcock & Wilcox Volund A/S
- 6.4.20 Keppel Seghers Belgium NV
7 Market Opportunities & Future Outlook
- 7.1 White-Space & Unmet-Need Assessment
 亚太地区废弃物製氢(WtH)市场:按应用、技术、废弃物类型和国家分類的分析和预测(2025-2035 年)
 欧洲废弃物氢气市场按应用、技术、垃圾类型和国家划分-分析与预测(2025-2035 年)
 先进废弃物能源化技术市场分析及预测(至2035年):按类型、产品类型、技术、组件、应用、最终用户、製程、安装类型、设备和解决方案划分
 2026-2030年全球废弃物发电市场
 垃圾焚化发电市场-全球产业规模、份额、趋势、机会及预测(依技术、废弃物类型、应用、地区及竞争格局划分,2021-2031年)
 全球废弃物发电用炉排锅炉市场(按燃料类型、技术类型、容量、安装类型、运作模式、应用和最终用户划分)预测(2026-2032年)
 废弃物技术及应用趋势:2032 年市场预测-按废弃物类型、技术、最终用户和地区划分:全球分析
 日本垃圾发电市场报告(按技术(物理、热力、生物)和地区划分,2026-2034年)
 垃圾焚化发电(WtE) 市场规模、份额和成长分析(按技术、废弃物类型、应用和地区划分)—产业预测 (2026-2033)
 全球废弃物氢气市场:按应用、技术、废弃物类型和国家分類的分析和预测(2025-2035 年)