


 |
市场调查报告书
商品编码
1851521
能源领域的物联网:市场占有率分析、产业趋势、统计数据和成长预测(2025-2030 年)Internet Of Things In Energy - Market Share Analysis, Industry Trends & Statistics, Growth Forecasts (2025 - 2030) |
||||||
※ 本网页内容可能与最新版本有所差异。详细情况请与我们联繫。
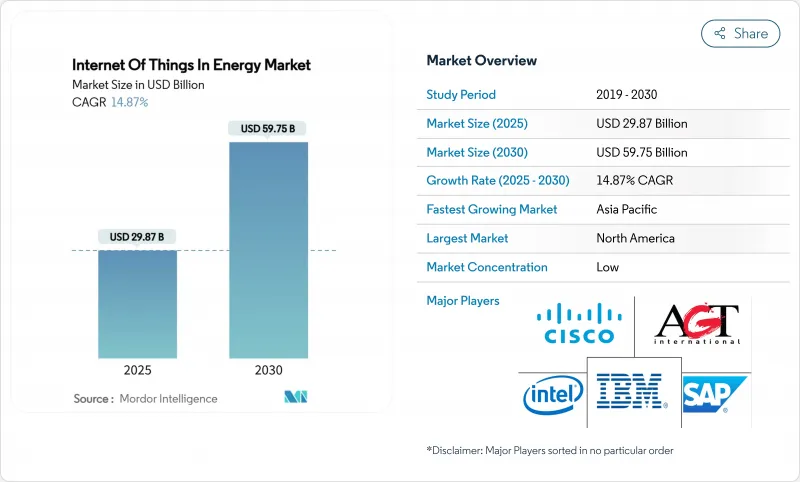
预计到 2025 年,能源物联网市场规模将达到 298.7 亿美元,到 2030 年将达到 597.5 亿美元,复合年增长率为 14.87%。
为了实现即时电网优化、预测性资产管理和自主能源交易的共存,主要经济体的公共产业正从集中式指挥控制转向分散式智慧。由于智慧电錶、智慧变电站维修和边缘分析技术堆迭的投资能够减少停电时间和维护预算,因此这些领域的资本投入正在增加。半导体价格的稳定使得低功耗广域模组的价格降至3美元以下,从而为二级馈线、农村太阳能电站和用户侧设备提供了连接。行动电话营运商、通讯群和私有5G供应商正致力于建构混合网络,以确保保护继电器讯息的确定性延迟,同时降低简单感测器流量的频宽成本。软体供应商正在将人工智慧套件包整合到资产性能平台中,以帮助能源公司及早预测组件故障,并在批发市场中实现灵活性服务的商业化。
全球能源物联网市场趋势与洞察
电力公司强制推行智慧电錶和电网现代化改造
强制性高级计量基础设施已超越试点阶段,监管机构要求提高低压电网和需求需量反应结果的透明度。Honeywell和威瑞森目前正在将原生5G无线电模组整合到电錶中,从而实现远端韧体更新、自愈式网状通讯和自主断电。挪威已完成全国范围内的部署,但只有29.5%的家庭拥有即时用电量数据,凸显了消费者参与度和直观易用的应用程式将决定难以实现的节能效果能否真正落实。因此,公共产业正在将技术部署与客户教育、游戏化仪錶板和电价奖励相结合。高级电錶将精细的时间间隔数据传输到配电管理系统,使其能够预测屋顶太阳能回馈和电动车(EV)丛集,并在不增加额外容量的情况下实现负载平衡。
降低 5G/LPWAN 模组的成本
随着晶片供应趋于正常化,窄频物联网模组的价格预计将在2023年至2025年间下降28%,从而消除大规模部署感测器的关键成本障碍。实验室测试表明,LTE-M相比许多其他低功耗通讯协定,能够实现更高的吞吐量和更低的能耗,这在电池更换成本高昂的情况下尤其重要。半导体製造商正在重新设计微控制器,以整合人工智慧加速功能,从而实现边缘异常检测。调查团队证明,将LoRa网关转变为轻量级运算节点,可以在不破坏传统有效载荷格式的前提下,将回程传输流量减少70%。能源公司目前正在为偏远风电场、区域变电站和阀组配备这些模组,在卡车鲜少涉足的地区部署资产智慧。
网路安全与OT/IT整合风险
随着运行设备接入公共网络,攻击面不断扩大。欧盟《网路弹性法案》将于2025年8月生效,该法案将要求设备製造商记录软体元件并及时发布修补程式。许多变电站仍然使用未经身份验证的传统通讯协定,入侵研究表明,薄弱的网路分段机制使得恶意软体能够在几分钟内从收费伺服器转移到断路器控制系统。空中升级管道、硬体信任根和零信任网路分段正成为新采购框架的强制性要求。有效的管治依赖于资讯技术团队和操作技术团队之间的密切合作。
细分市场分析
到2024年,智慧电錶、智慧感测器、网关和边缘控制器将占据能源物联网市场41%的份额。大量硬体正在支援公用事业公司的数位双胞胎,将细粒度的现场数据推送至分析云端。随着监管机构要求供应商对从晶片到云端的设备完整性进行认证,安全硬体模组和可信任执行环境正日益受到关注。预计2030年,物联网安全平台将成长17.89%,是系统平均成长速度的两倍。基于坚固耐用的ARM或x86主机板建构的边缘伺服器配备了人工智慧加速器,可在毫秒内侦测故障。东芝最近发布了一款金钥管理晶片组,可在韧体对其进行签名,从而缩短合规负责人的审核时间。
软体和服务的发展速度仅次于硬体。公用事业公司正在为全端式解决方案付费,供应商会将设备、连接和订阅仪錶板捆绑在一起。在资料科学人才短缺的地区,託管服务合约极具吸引力,因为它们将整合风险转移给了供应商。因此,服务收入在能源市场物联网扩张中所占的份额越来越大。同时,零件供应商正在将製造地转移到更靠近需求中心的地方,以缓衝地缘政治衝击对半导体流通的影响。
即时电网监控在2024年占总收入的38.5%,这得益于变压器、馈线和电压调节器进行计量的程序。人工智慧技术能够动态调整设定点,帮助电网在屋顶太阳能发电高峰期避免过电压。互联电动车基础设施将以15.35%的复合年增长率实现最快成长,因为充电桩既是负载又是储能设备。公共产业将充电桩视为灵活的节点,可提供无功功率并在白天吸收多余的能量。政府正在补贴双向充电桩,并要求采用开放通讯协定的远端检测。
随着可再生能源业主追求更高的发电容量,预测性维护也紧跟着。离岸风力发电目前正在整合软体定义网路环,即使在恶劣的海洋环境中也能与机舱感测器保持确定性的连接。商业建筑的需量反应计画可在关键时段将峰值功率降低高达 86%。工业用户正在部署边缘分析技术,以降低单位输出的能耗,这项指标可直接用于 ESG 评分卡和投资者筛检。
区域分析
到2024年,北美将占能源领域物联网收入的38%。联邦政府对电网韧性的投资、各州清洁能源标准的製定以及成熟的行动电话网路覆盖,正在推动物联网的快速普及。Schneider Electric警告称,资料中心负载的成长速度超过了变电站的扩容速度,迫使电力公司部署物联网感测器,以最大限度地利用现有输电线路的电力。由于在永冻土带铺设光纤成本高昂,加拿大的偏远微电网率先采用了卫星物联网技术。墨西哥的能源改革吸引了许多分散式太阳能投资者,他们希望从一开始就能运用预测分析技术。
亚太地区将成为成长最快的地区,到2030年复合年增长率将达到17%。日本的超级太阳能计划采用钙钛矿电池,理论效率超过30%,目标是2030年达到20吉瓦的装置容量。中国的「十四五」智慧电网部署计画包括多能源微电网和嵌入输电塔的5G基地台。印度大力发展再生能源,将物联网感测器与政府补贴的云端託管服务结合;韩国的工业则为工厂配备人工智慧边缘运算设备,以节省用电高峰时段的电力。
在严格的碳排放法规和跨境平衡市场的推动下,欧洲正经历稳定成长。欧盟的网路安全法将安全支出硬性纳入所有物联网预算。德国的工业4.0倡议意味着工厂正在将电能品质计量表整合到生产计画中,使单位能耗(瓦时/单位)与节拍时间一样成为重要的关键绩效指标。英国一项公共部门节能计划在楼宇管理人员获得精确到分钟的能源数据后,已实现了两位数的节能效果。法国正在为核能发电厂冷却泵加装振动感测器,以延长其运作许可证的有效期;北欧电网营运商正在测试一个用于实现即时灵活性的市场平台。中东和非洲虽然起步较早,但大规模太阳能发电厂和储能计划以及绿氢能工厂正在为未来的需求提供保障。
其他福利:
- Excel格式的市场预测(ME)表
- 3个月的分析师支持
目录
第一章 引言
- 研究假设和市场定义
- 调查范围
第二章调查方法
第三章执行摘要
第四章 市场情势
- 市场概览
- 市场驱动因素
- 电力公司强制推行智慧电錶和电网现代化改造
- 5G/LPWAN模组成本下降
- 对分散式可再生编配的需求
- 基于人工智慧的预测性维护的投资报酬率案例研究
- 将弹性货币化(V2G、P2P能源)
- 碳计量资料法规
- 市场限制
- 网路安全与OT/IT整合风险
- 传统系统与SCADA系统互通性差距
- 边缘运算人才短缺
- 半导体供应波动
- 价值链分析
- 监管环境
- 技术展望
- 波特五力分析
- 新进入者的威胁
- 买方的议价能力
- 供应商的议价能力
- 替代品的威胁
- 竞争的激烈程度
第五章 市场规模与成长预测
- 按组件
- 硬体
- 智慧型恆温器
- 智慧电錶
- 电动车充电站
- 其他硬体
- 软体与分析
- 物联网平台
- 物联网安全
- 物联网服务
- 硬体
- 透过使用
- 智慧电网监测
- 能源管理系统
- 预测性维护
- 互联电动车基础设施
- 分散式可再生能源併网
- 需量反应和灵活性
- 透过连接技术
- 蜂窝网路(2G-5G)
- LPWAN(NB-IoT、LoRaWAN、Sigfox)
- 卫星物联网
- Wi-Fi/BLE
- PLC 和其他
- 按部署模式
- 云
- 边缘
- 本地部署
- 最终用户
- 电力和天然气业务
- 石油和天然气上游/中游/下游
- 商业和工业设施
- 住宅和专业用户用途
- 可再生能源发电发电厂
- 按地区
- 北美洲
- 美国
- 加拿大
- 墨西哥
- 南美洲
- 巴西
- 阿根廷
- 欧洲
- 德国
- 英国
- 法国
- 俄罗斯
- 亚太地区
- 中国
- 印度
- 日本
- 韩国
- ASEAN
- 亚太其他地区
- 中东和非洲
- 中东
- 沙乌地阿拉伯
- 土耳其
- 非洲
- 南非
- 北美洲
第六章 竞争情势
- 市场集中度
- 策略趋势
- 市占率分析
- 公司简介
- Cisco Systems
- IBM Corporation
- Siemens AG
- Schneider Electric
- Huawei Technologies
- Intel Corporation
- SAP SE
- Oracle Corporation
- AGT International
- Davra Networks
- Flutura Business Solutions
- Wind River Systems
- Silver Spring Networks
- Verizon Business
- Vodafone IoT
- GE Digital
- Emerson Electric
- Siemens Gamesa(renewable IoT)
- Landis+Gyr
- Kamstrup
第七章 市场机会与未来展望
The Internet of Things in the energy market stood at USD 29.87 billion in 2025 and is on course to reach USD 59.75 billion by 2030, reflecting a 14.87% CAGR.
Utilities across major economies are moving from centralized command-and-control to distributed intelligence so that real-time grid optimization, predictive asset care, and autonomous energy trading can co-exist. Capital spending on smart meters, intelligent substation retrofits, and edge analytics stacks has risen because these investments cut outage minutes and lower maintenance budgets. Semiconductor pricing has stabilized, allowing low-power wide-area modules to fall below the USD 3 threshold, which brings connectivity to secondary feeders, rural solar farms, and behind-the-meter devices. Cellular operators, satellite fleets, and private 5G providers are converging on hybrid network offers that guarantee deterministic latency for protection relay messages while squeezing bandwidth costs for simple sensor traffic. Software vendors have responded by embedding AI toolkits inside asset performance platforms so that energy firms can predict component failures early and monetize flexibility services in wholesale markets.
Global Internet Of Things In Energy Market Trends and Insights
Utility Smart-Meter Roll-Outs and Grid-Modernization Mandates
Mandated advanced metering infrastructure has moved beyond the pilot stage as regulators demand visibility of low-voltage networks and demand response outcomes. Honeywell and Verizon now embed native 5G radios into meters, enabling remote firmware updates, self-healing mesh communication, and autonomous service disconnects. Norway completed nationwide roll-outs yet only 29.5% of households checked live consumption data, underscoring that consumer engagement and intuitive apps decide whether hard savings materialize. Utilities therefore pair technical deployment with customer education, gamified dashboards, and tariff incentives. Advanced meters feed granular interval data to distribution management systems so that rooftop solar back-feed and electric vehicle (EV) clustering can be forecast and balanced without over-building capacity.
Falling 5G/LPWAN Module Cost
Chip supply normalization pushed narrow-band IoT module prices down by 28% between 2023 and 2025, removing a key cost barrier for high-volume sensor roll-outs. Laboratory tests show LTE-M offers higher throughput and lower energy consumption than many alternative low-power protocols, which is important where battery swaps are costly. Semiconductor makers are redesigning micro-controllers with integrated AI acceleration so that anomaly detection can occur at the edge. Research teams have proved that turning LoRa gateways into lightweight compute nodes trims backhaul traffic by 70% without breaking legacy payload formats. Energy firms now equip remote wind farms, rural substations, and valve arrays with these modules, placing asset intelligence where trucks rarely visit.
Cyber-Security and OT/IT Convergence Risk
As operational equipment becomes routable on public networks, attack surfaces multiply. The EU Cyber Resilience Act will come into force in August 2025, obliging device makers to document software components and issue timely patches. Many substations still run legacy protocols that lack authentication, and intrusion studies show malware can pivot from billing servers to breaker controls in minutes if segmentation is weak. Over-the-air update pipelines, hardware root-of-trust, and zero-trust segmentation are becoming mandatory across new procurement frameworks. Effective governance hinges on closer collaboration between information-technology and operational-technology teams.
Other drivers and restraints analyzed in the detailed report include:
- Distributed-Renewable Orchestration Needs
- AI-Driven Predictive-Maintenance ROI Cases
- Legacy-SCADA Interoperability Gap
For complete list of drivers and restraints, kindly check the Table Of Contents.
Segment Analysis
Smart meters, intelligent sensors, gateways, and edge controllers collectively secured 41% of the Internet of Things in the energy market share in 2024. The hardware wave anchors utility digital twins and pushes granular field data into analytics clouds. Security hardware modules and trusted execution environments gain notice because regulators now ask vendors to prove device integrity from chip to cloud. IoT security platforms are forecast to compound at 17.89% through 2030, twice the system average, as the cost of a single operational breach can erase multi-year efficiency savings. Edge servers built on ruggedised ARM or x86 boards are shipping with AI accelerators that handle fault detection in milliseconds. Toshiba recently unveiled a key-management chipset that signs firmware blobs before they touch the field device, trimming audit times for compliance reviewers.
Software and services follow hardware's beachhead. Utilities are paying for full-stack offerings where the vendor bundles devices, connectivity, and a subscription dashboard. Managed service contracts appeal in regions short of data-science talent because they shift integration risk to the supplier. As a result, services revenue is taking a larger slice of the expanding Internet of Things in the energy market. Meanwhile, component suppliers are moving manufacturing closer to demand centres to buffer any geopolitical shock to semiconductor flows.
Real-time distribution grid monitoring accounted for 38.5% of 2024 revenue thanks to programs that instrument transformers, feeders, and voltage regulators. AI overlays adapt set-points on the fly so that networks avoid over-voltage when rooftop solar spikes midday. Connected EV infrastructure shows the fastest 15.35% CAGR because chargers double as both load and storage assets. Utilities view them as flexible nodes that can supply reactive power and soak up midday excess. Governments are subsidising bidirectional chargers and demanding open-protocol telemetry, which funnels more devices into the Internet of Things in the energy market.
Predictive maintenance sits close behind as renewable owners chase higher capacity factors. Offshore wind farms now integrate software-defined networking rings that maintain deterministic links to nacelle sensors despite harsh marine environments. Demand-response programs inside commercial buildings have trimmed peak kW draw by up to 86% during critical intervals. Industrial users deploy edge analytics to lower electricity per unit of output, a metric that directly feeds ESG scorecards and investor screens.
The Internet of Things in the Energy Market Report is Segmented by Component (Hardware, Software and Analytics, Iot Platforms, and More), Application (Smart Grid Monitoring, Energy Management Systems, Predictive Maintenance, and More), Connectivity Technology (Cellular (2G-5G), Satellite IoT, and More), Deployment Model (Cloud, Edge, and More), End-User (Electric and Gas Utilities, Residential and Prosumer, and More), and Geography
Geography Analysis
North America commanded 38% of 2024 revenue for the Internet of Things in the energy market. Federal investment in grid resilience, state-level clean-energy standards, and a mature cellular footprint enable rapid adoption. Schneider Electric warns that data-centre load is climbing faster than substation build-outs, forcing utilities to deploy IoT sensors to squeeze every amp from existing lines. Canada's remote microgrids are early satellite IoT adopters because fibre drops are expensive in permafrost. Mexico's energy reform is attracting distributed solar investors who demand predictive analytics from day one.
Asia Pacific is the fastest-growing region at a 17% CAGR through 2030. Japan's super-solar project targets 20 GW by 2030 using perovskite cells with a theoretical efficiency beyond 30%. China's smart-grid rollout under the 14th Five-Year Plan includes multi-energy microgrids and 5G base stations embedded in transmission pylons. India's renewables push blends IoT sensors with government-subsidised cloud hosting, while South Korean industrial parks equip factories with AI edge boxes to shave power peaks.
Europe shows steady expansion on the back of stringent carbon laws and cross-border balancing markets. The EU Cyber Resilience Act hard-codes security spending into every IoT budget. Germany's Industry 4.0 initiatives mean factories integrate power-quality meters with production scheduling so that watt-hours per unit become a KPI as important as takt time. The United Kingdom's public-sector energy efficiency program has already logged double-digit savings after building managers gained minute-level insights. France upgrades nuclear station cooling pumps with vibration sensors to extend operating licenses, and Nordic grid operators test market platforms for real-time flexibility. The Middle East and Africa are earlier in the curve but mega solar-and-storage projects linked to green-hydrogen plants guarantee future demand.
- Cisco Systems
- IBM Corporation
- Siemens AG
- Schneider Electric
- Huawei Technologies
- Intel Corporation
- SAP SE
- Oracle Corporation
- AGT International
- Davra Networks
- Flutura Business Solutions
- Wind River Systems
- Silver Spring Networks
- Verizon Business
- Vodafone IoT
- GE Digital
- Emerson Electric
- Siemens Gamesa (renewable IoT)
- Landis+Gyr
- Kamstrup
Additional Benefits:
- The market estimate (ME) sheet in Excel format
- 3 months of analyst support
TABLE OF CONTENTS
1 INTRODUCTION
- 1.1 Study Assumptions and Market Definition
- 1.2 Scope of the Study
2 RESEARCH METHODOLOGY
3 EXECUTIVE SUMMARY
4 MARKET LANDSCAPE
- 4.1 Market Overview
- 4.2 Market Drivers
- 4.2.1 Utility smart-meter roll-outs and grid-modernization mandates
- 4.2.2 Falling 5G/LPWAN module costs
- 4.2.3 Distributed-renewable orchestration needs
- 4.2.4 AI-driven predictive-maintenance ROI cases
- 4.2.5 Flexibility monetisation (V2G, P2P energy)
- 4.2.6 Carbon-accounting data regulations
- 4.3 Market Restraints
- 4.3.1 Cyber-security and OT/IT convergence risk
- 4.3.2 Legacy-SCADA interoperability gaps
- 4.3.3 Edge-compute talent scarcity
- 4.3.4 Semiconductor-supply volatility
- 4.4 Value Chain Analysis
- 4.5 Regulatory Landscape
- 4.6 Technological Outlook
- 4.7 Porter's Five Forces Analysis
- 4.7.1 Threat of New Entrants
- 4.7.2 Bargaining Power of Buyers
- 4.7.3 Bargaining Power of Suppliers
- 4.7.4 Threat of Substitutes
- 4.7.5 Intensity of Rivalry
5 MARKET SIZE AND GROWTH FORECASTS (VALUE)
- 5.1 By Component
- 5.1.1 Hardware
- 5.1.1.1 Smart Thermostats
- 5.1.1.2 Smart Meters
- 5.1.1.3 EV Charging Stations
- 5.1.1.4 Other Hardware
- 5.1.2 Software and Analytics
- 5.1.3 IoT Platforms
- 5.1.4 IoT Security
- 5.1.5 IoT Services
- 5.1.1 Hardware
- 5.2 By Application
- 5.2.1 Smart Grid Monitoring
- 5.2.2 Energy Management Systems
- 5.2.3 Predictive Maintenance
- 5.2.4 Connected EV Infrastructure
- 5.2.5 Distributed-Renewable Integration
- 5.2.6 Demand Response and Flexibility
- 5.3 By Connectivity Technology
- 5.3.1 Cellular (2G-5G)
- 5.3.2 LPWAN (NB-IoT, LoRaWAN, Sigfox)
- 5.3.3 Satellite IoT
- 5.3.4 Wi-Fi/BLE
- 5.3.5 PLC and Other
- 5.4 By Deployment Model
- 5.4.1 Cloud
- 5.4.2 Edge
- 5.4.3 On-premise
- 5.5 By End-user
- 5.5.1 Electric and Gas Utilities
- 5.5.2 Oil and Gas Up/Mid/Down-stream
- 5.5.3 Commercial and Industrial Facilities
- 5.5.4 Residential and Prosumer
- 5.5.5 Renewable Power Plants
- 5.6 By Geography
- 5.6.1 North America
- 5.6.1.1 United States
- 5.6.1.2 Canada
- 5.6.1.3 Mexico
- 5.6.2 South America
- 5.6.2.1 Brazil
- 5.6.2.2 Argentina
- 5.6.3 Europe
- 5.6.3.1 Germany
- 5.6.3.2 United Kingdom
- 5.6.3.3 France
- 5.6.3.4 Russia
- 5.6.4 Asia Pacific
- 5.6.4.1 China
- 5.6.4.2 India
- 5.6.4.3 Japan
- 5.6.4.4 South Korea
- 5.6.4.5 ASEAN
- 5.6.4.6 Rest of Asia Pacific
- 5.6.5 Middle East and Africa
- 5.6.5.1 Middle East
- 5.6.5.1.1 Saudi Arabia
- 5.6.5.1.2 Turkey
- 5.6.5.2 Africa
- 5.6.5.2.1 South Africa
- 5.6.1 North America
6 COMPETITIVE LANDSCAPE
- 6.1 Market Concentration
- 6.2 Strategic Moves
- 6.3 Market Share Analysis
- 6.4 Company Profiles (includes Global level Overview, Market level overview, Core Segments, Financials as available, Strategic Information, Market Rank/Share for key companies, Products and Services, and Recent Developments)
- 6.4.1 Cisco Systems
- 6.4.2 IBM Corporation
- 6.4.3 Siemens AG
- 6.4.4 Schneider Electric
- 6.4.5 Huawei Technologies
- 6.4.6 Intel Corporation
- 6.4.7 SAP SE
- 6.4.8 Oracle Corporation
- 6.4.9 AGT International
- 6.4.10 Davra Networks
- 6.4.11 Flutura Business Solutions
- 6.4.12 Wind River Systems
- 6.4.13 Silver Spring Networks
- 6.4.14 Verizon Business
- 6.4.15 Vodafone IoT
- 6.4.16 GE Digital
- 6.4.17 Emerson Electric
- 6.4.18 Siemens Gamesa (renewable IoT)
- 6.4.19 Landis+Gyr
- 6.4.20 Kamstrup
7 MARKET OPPORTUNITIES AND FUTURE OUTLOOK
- 7.1 White-space and Unmet-need Assessment
 2026年全球能源网管理物联网(IoT)市场报告
 物联网能源市场:2026-2032年全球市场预测(按服务类型、连接技术、部署模式、应用程式和最终用户划分)2026年全球能源物联网市场报告
 能源市场中的物联网 (IoT):按连接方式、行业、技术、部署模式、应用、国家和地区划分 - 全球行业分析、市场规模、市场份额和预测 (2026–2033)
 能源领域物联网 (IoT) 市场规模、份额和成长分析(按组件、解决方案、服务、网路技术、应用和地区划分)—产业预测 (2026-2033)全球油气数位孪生市场:依类型、应用、部署模式和公司规模划分 - 市场规模、行业趋势、机会分析和预测(2025-2033 年)
 全球物联网 (IoT) 能源市场规模研究与预测,按组件(解决方案和服务)、按应用(石油天然气和煤矿)、按部署、按连接性和区域预测 2025-2035
 能源电网管理中的物联网-2025-2029 年全球市场
 石油和天然气领域的全球物联网市场
 石油和天然气市场中的数位孪生机会、成长动力、产业趋势分析和 2025 - 2034 年预测