


 |
市场调查报告书
商品编码
1851699
浮体式海上风电:市场份额分析、行业趋势、统计数据和成长预测(2025-2030 年)Floating Offshore Wind Power - Market Share Analysis, Industry Trends & Statistics, Growth Forecasts (2025 - 2030) |
||||||
※ 本网页内容可能与最新版本有所差异。详细情况请与我们联繫。
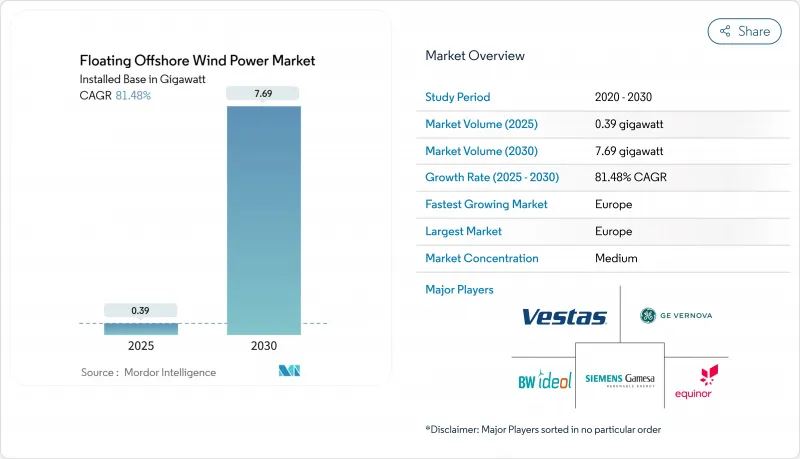
预计浮体式海上风电市场规模将从 2025 年的 0.39 吉瓦成长到 2030 年的 7.69 吉瓦,在预测期(2025-2030 年)内实现 81.48% 的复合年增长率。
这项扩张反映了深水区域的可用性,深水区域拥有全球80%的海上风能资源。同时,成本的快速下降预计在2030年将平准化能源成本降至50-100欧元/兆瓦时。随着浮体式海上风电市场进入商业化阶段,围绕传统固定式计划建构的供应链正在重组,以适应半潜式和立柱式平台。这些平台可在码头组装,并拖曳至1000公尺以上的深海。区域政策也在加速推进:欧洲差价合约(CfD)改革正在稳定收入;美国的「浮体式海上风电」项目以及日本和韩国的租赁竞标正在释放资本;而墨西哥湾的油气平台改造则凸显了跨行业的协同效应。这些因素,加上新兴的氢能共址方案以吸收剩余电力,将推动浮体式海上风电市场进入蓬勃发展的新十年。
全球浮体式海上风电市场趋势与洞察
美国和亚太地区深水区租赁活动增加
美国海洋能源管理局正准备在2025年前进行多项海上漂浮式风电专案销售,目标是在2035年实现15吉瓦的浮体式海上风电装置容量。联邦政府的「浮体式海上风电计画」将这些租赁计画与旨在降低70%成本的研发活动结合。在亚太地区,韩国1.8兆瓦的竞标以及日本参与美国成本削减倡议,凸显了透过双边伙伴关係在全球范围内构建的2.44兆瓦项目储备。电力生产商将这些订单视为从示范电站到多吉瓦级阵列的垫脚石,鼓励他们儘早投资港口维修、电缆工厂和安装船。因此,随着浮体式海上风电市场接近每年吉瓦级新增装置容量,环太平洋地区持续推行相关政策将确保稳定的收入来源。
透过将涡轮机尺寸快速提升至 15-20MW 等级来降低平准化度电成本
将风力涡轮机的功率从6-10兆瓦提升至15-20兆瓦,可使每兆瓦的基座数量减少高达40%,从而直接降低钢材和锚碇的使用量。西班牙大西洋海域的一项研究发现,在有利条件下,15兆瓦的风力涡轮机可以将平准化度电成本(LCOE)降低至100欧元/兆瓦时。西门子歌美飒和维斯塔斯等製造商正在加快原型机的研发进度,以确保先发优势;同时,港口业主也在延长码头并加固支架结构,以应对120米长的叶片。目前只有少数新一代风力涡轮机运输船(WTIV)能够容纳超过1200吨的机舱,而不断上涨的租赁成本迫使开发商提前数年确定产能。总而言之,风力涡轮机的规模化对于实现国家成本降低目标和维持浮体式海上风电市场的快速成长至关重要。
WTIV 和 FIV 船隻短缺导致日租金超过 45 万美元
全球仅有10艘船舶能够处理14兆瓦以上的风力涡轮机,而能够吊起三排半潜式船体段的船舶则更少。每日费用已超过45万美元,几乎是2022年水准的两倍,订单情况表明,建造缺口将持续到2028年。由于载员法规限制外国船舶,亚太地区面临额外的障碍。这意味着日本和韩国的计划必须在国内建造风力涡轮机吊装船(WTIV),否则将承担高昂的调动航次费用。开发人员目前已将船舶可用性条款纳入购电协议,推迟最终投资决策,直到产能得到保障。除非流入专业造船厂的资金加快,否则这一瓶颈可能会阻碍浮体式海上风电市场与实际安装的紧密联繫。
细分市场分析
水深30公尺至60公尺之间的过渡区域,预计2024年将占离岸风电装置总量的55%,浮体式海上风电市场规模约131兆瓦。这些区域可以重复利用固定式离岸风电的部分供应链,使开发商能够以适中的成本检验锚碇、SCADA系统和运维策略。苏格兰金卡丁和法国地中海沿岸的示范计画充分体现了这一区域的受欢迎程度,这两个计画在2024年的运转率均超过92%。然而,水深60公尺以上的深水风电正在迅速发展,这得益于强劲的风力条件,与过渡区域相比,深水风电的年发电量可提高高达25%。此外,随着风力涡轮机额定功率超过15兆瓦,更深的水域还能减少视觉干扰。
预计深水计划将以88%的复合年增长率成长,到2030年,其在浮体式海上风电市场的份额将超过40%。挪威的乌特西拉-诺德区和加州的莫罗湾区展示瞭如何透过连续的1吉瓦区块来简化阵列布局并实现共用出口通道。石油和天然气巨头正在提供海底技术以降低海洋风险,而船级社正在将超过25年的设计疲劳係数纳入规范。浅水(<30公尺)专案仅限于研发原型,因为海底条件或生态学限制导致固定单桩结构不可行。随着时间的推移,人们对动态电缆性能和浮体结构冗余性的信心不断增强,预计将促使投资转向水深超过100公尺的区域,从而加强浮体式海上风电行业的深水发展管道。
2024年,采用模组化设计的半潜式船体(例如WindFloat和VolturnUS)可从现有码头下水,预计将占据浮体式海上风电市场57%的份额。其吃水浅,无需大规模疏浚即可拖曳,这对造船厂资源有限的国家而言是一项关键优势。锚碇系统采用标准链条和聚酯绳索,最大限度地减少了客製化硬体的使用。这种方法确保了稳定性,俯仰运动小于5°,并确保传动系统的负载保持在6-10兆瓦风力发电机组的保证范围内。开发商对该平台的适应性讚赏有加,使其能够部署在从挪威峡湾到加那利群岛的各种海域。
预计到2024年,立柱式浮式风电将占总发电量的31%,其复合年增长率可望达到84%,这主要得益于其每兆瓦材料用量比半潜式平台减少约15%。 Hywind Tampen平台的107公尺长立柱在北海暴风雨期间展现了97%的运转率。未来计画进行升级,采用滑模成型技术以缩短製造时间,而混凝土-钢混合立柱平台可望进一步降低资本支出。张力腿平台在风力发电机机舱高度接近180公尺时具有优异的垂荡抑制性能,但锚桩的精度要求会增加成本。虽然驳船和混合式平台仍处于小众市场,但日本3兆瓦的响滩发电厂展示如何在平静水域中建造低干舷船体。目前,半潜式平台是金融机构评估浮体式海上风电市场风险的参考设计,但在大规模生产明确最具融资价值的方案之前,不同船体类型之间的竞争可能会持续下去。
浮体式海上风电市场报告按水深(浅水、过渡水、深水)、浮体式平台类型(半潜式、立柱式浮标、其他)、涡轮机容量(小于 5MW、5-10MW、其他)、应用阶段(商业试点前、商业公用事业规模、混合风能转换)和地区(北美、欧洲、亚太、南美、中东和非洲)进行细分。
区域分析
欧洲持续保持在浮体式海上风电市场的主导地位,占全球部署量的92%,预计2024年将接近220兆瓦。挪威、苏格兰和葡萄牙成熟的工程丛集支撑着这一领先地位,而英国50吉瓦海离岸风力发电的宏伟目标(其中5吉瓦必须在2030年前建成浮体式电)也为进一步发展提供了支持。诸如1.6亿英镑的浮体式海上风电製造投资计画等国家补贴正在引导对叶片、塔筒和锚碇设施的资本投资,并加快交付速度。挪威的Hywind Tampen计画已透过石油平台的电气化展示了实际减少二氧化碳排放的效果,巩固了政府和公众的支持。法国也正在效仿,其地中海竞标倾向于位于福斯滨海和新港的本地製造厂,以扩大其区域工业版图。
亚太地区是成长最快的地区,年复合成长率高达156%,岛国纷纷寻求大陆棚最窄处的深水区域。日本的目标是到2030财年实现5.7吉瓦的装置容量,到2040财年实现45吉瓦,而这些目标很大程度上依赖浮体式基础。海底勘测证实,在风速达10公尺/秒或以上时,理论资源量可达4.24吉瓦。韩国在蔚山附近进行的1.8吉瓦采购可望催生一个专业化的供应基地,包括链条、吸力锚和重型装运船隻。台湾正利用台中港自贸区的税收优惠政策,将自身定位为叶片和机舱的非中国替代供应商。虽然中国在固定式风电领域占据主导地位,但从广东到浙江的地方政府正在规划水深超过80公尺的浮动式风力发电走廊,以实现沿海负载中心的多元化。
在北美,拜登-哈里斯政府设定了30吉瓦离岸风电和15吉瓦浮体式风电的目标。加州的莫罗湾和洪堡两个租赁区拥有可供550万户家庭使用的电力容量,但北大西洋露脊鲸的《濒危物种法》延长了太平洋沿岸大片区域的审批週期。墨西哥湾平静的海况和密集的棕地基础设施使其成为一个极具吸引力的早期进入点,因为大型石油公司正在将自升式钻井改造为临时焊接站。加拿大正在密切关注该行业的扩张,同时等待涡轮机结冰研究的结果,然后再确定其国家配额。同时,墨西哥正在探索政策奖励,以将浮动式风力发电与下加利福尼亚半岛现有的燃气码头用地结合。浮体式海上风电市场预计在2027年后大幅扩张。
其他福利:
- Excel格式的市场预测(ME)表
- 3个月的分析师支持
目录
第一章 引言
- 研究假设和市场定义
- 调查范围
第二章调查方法
第三章执行摘要
第四章 市场情势
- 市场概览
- 市场驱动因素
- 美国和亚太地区深水租赁交易增加
- 快速将风力涡轮机功率提升至15-20兆瓦等级可降低平准化电成本。
- 石油和天然气平台改革释放墨西哥湾供应链潜力
- 欧盟和英国的差价合约改革将提升银行融资能力
- 国家氢能发展蓝图催生了对共址装卸的需求
- 亚洲电缆船建造公司缩短安装週期
- 市场限制
- WTIV 和 FIV 船舶短缺导致日薪超过 45 万美元
- 50-100公尺深度高压动态缆线故障试点研究
- 加州濒危物种法案对鲸鱼的限制导致BOEM许可证发放延迟
- 现货钢材价格波动(低于每吨950美元)扰乱了浮式堆场的运作。
- 供应链分析
- 监理与技术展望
- 主要计划资讯
- 主要现有计划
- 即将进行的计划
- 最新进展
- 波特五力模型
- 供应商的议价能力
- 买方的议价能力
- 新进入者的威胁
- 替代品的威胁
- 竞争对手之间的竞争
- 投资分析
第五章 市场规模与成长预测
- 按深度
- 浅海(30公尺或更浅)
- 过渡段(30-60公尺)
- 深海(超过60公尺)
- 浮体式平台类型
- 半潜式
- 浮标
- 张力腿平台(TLP)
- 驳船和混合动力概念
- 按涡轮机容量额定值
- 小于5兆瓦
- 5~10 MW
- 11~15 MW
- 15兆瓦或以上
- 按应用阶段
- 商业化前试飞
- 商业公用事业规模
- 混合风力发电(氢气生产、海水淡化)
- 按地区
- 北美洲
- 美国
- 北美其他地区
- 欧洲
- 法国
- 英国
- 西班牙
- 北欧国家
- 义大利
- 其他欧洲地区
- 亚太地区
- 中国
- 日本
- 韩国
- 亚太其他地区
- 南美洲
- 巴西
- 阿根廷
- 其他南美洲
- 中东和非洲
- 阿拉伯聯合大公国
- 沙乌地阿拉伯
- 南非
- 其他中东和非洲地区
- 北美洲
第六章 竞争情势
- 市场集中度
- 策略性倡议(併购、伙伴关係、购电协议)
- 市场占有率分析(主要企业的市场排名/份额)
- 公司简介
- Siemens Gamesa Renewable Energy SA
- Vestas Wind Systems A/S
- GE Vernova(GE Renewable Energy)
- BW Ideol AS
- Equinor ASA
- Orsted A/S
- Principle Power Inc.
- Aker Solutions ASA
- Hexicon AB
- TotalEnergies SE
- Shell plc
- Ocean Winds(EDPR/ENGIE)
- Copenhagen Infrastructure Partners
- RWE AG
- Marubeni Corporation
- MingYang Smart Energy
- Goldwind Science & Technology
- Gazelle Wind Power Ltd.
第七章 市场机会与未来展望
The Floating Offshore Wind Power Market size in terms of installed base is expected to grow from 0.39 gigawatt in 2025 to 7.69 gigawatt by 2030, at a CAGR of 81.48% during the forecast period (2025-2030).
This expansion reflects the sector's ability to tap deeper-water sites that hold 80% of global offshore wind resources, while rapid cost compression is pushing the Levelized Cost of Energy toward €50-100/MWh by 2030 . As the floating offshore wind market enters a commercial phase, supply chains built around conventional fixed-bottom projects are being re-tooled to handle Semi-Submersible and Spar-Buoy platforms that can be assembled quayside and towed to depths exceeding 1,000 m. Developers are also pivoting to turbines above 15 MW to spread foundation and installation costs over larger generation envelopes. Regional policy adds momentum: Europe's revenue-stabilizing Contracts for Difference (CfD) reforms, the United States' "Floating Offshore Wind Shot," and Japan-Korea lease auctions are unlocking capital, while oil-and-gas platform conversions in the Gulf of Mexico highlight cross-sector synergies. These forces, combined with emerging hydrogen co-location schemes that soak up surplus power, position the floating offshore wind market for steep scale-up this decade.
Global Floating Offshore Wind Power Market Trends and Insights
Growing Lease Awards in U.S. & APAC Deep-Water Zones
A surge of deep-water lease auctions is reshaping the floating offshore wind market, with the U.S. Bureau of Ocean Energy Management preparing multiple sales through 2025 and targeting 15 GW of floating capacity by 2035. The federal "Floating Offshore Wind Shot" couples these leases with R&D aimed at 70% cost cuts. In Asia-Pacific, South Korea's 1.8 GW tender and Japan's entry into the U.S. cost-reduction initiative underscore how bilateral partnerships are building a 244 GW global pipeline. Developers see these awards as stepping-stones from demonstration to multi-GW arrays, prompting early investments in port upgrades, cable factories, and installation vessels. Therefore, policy continuity across the Pacific Rim is locking in bankable revenue streams while pushing the floating offshore wind market closer to gigawatt-scale annual additions.
Rapid Turbine Upsizing to 15-20 MW Class Reducing LCOE
Moving from a 6-10 MW baseline to 15-20 MW turbines cuts per-megawatt foundation counts by up to 40%, directly lowering steel and mooring use. Research on Spanish Atlantic sites finds that 15 MW machines can drive LCOE to 100 €/MWh in favorable conditions. Manufacturers such as Siemens Gamesa and Vestas have accelerated prototyping schedules to secure early-mover advantage, while port owners lengthen quays and reinforce cradle structures to handle 120-m blades. The upsizing wave also reshuffles vessel demand: only a handful of next-generation WTIVs can install nacelles weighing over 1,200 t, creating new charter-rate spikes that force developers to lock in capacity years ahead. Overall, turbine scale-up is pivotal to meeting national cost-reduction targets and sustaining the blistering growth of the floating offshore wind market.
WTIV & FIV Vessel Shortage Driving Day Rates Above USD 450k
Only 10 vessels worldwide can handle turbines above 14 MW, and fewer still can lift 3-column Semi-Submersible hull sections. Day rates have already breached USD 450,000, about double 2022 levels, and order books show a construction gap extending into 2028. Asia-Pacific faces extra hurdles from cabotage rules restricting foreign hulls, meaning Japanese and Korean projects must either build domestic WTIVs or absorb costly mobilization voyages. Developers now embed vessel-availability clauses into Power Purchase Agreements, delaying Final Investment Decisions until tonnage slots are secured. This bottleneck risks trimming close-in floating offshore wind market installations unless capital flows into specialized shipyards accelerate.
Other drivers and restraints analyzed in the detailed report include:
- Oil & Gas Platform Conversions Unlocking Gulf of Mexico Supply Chain
- EU & UK CfD Reform Boosting Bankability
- High-Voltage Dynamic Cable Failures in 50-100 m Depth Pilots
For complete list of drivers and restraints, kindly check the Table Of Contents.
Segment Analysis
Transitional zones between 30 m and 60 m accounted for 55% of 2024 installations, equating to a floating offshore wind market size of roughly 131 MW. These locations reuse portions of fixed-bottom supply chains, allowing developers to validate moorings, SCADA, and O&M strategies at modest cost. The segment's popularity is evident in Scotland's Kincardine and France's Mediterranean demonstrators, which collectively logged availability above 92% in 2024. Yet the deep-water segment (above 60 m) is scaling fast, lifted by stronger wind profiles that raise annual energy output by up to 25 % versus transitional sites. As turbine ratings pass 15 MW, deeper waters also reduce visual-impact opposition, a factor especially potent in tourism-heavy coastlines.
Deep-water projects are forecast to post an 88% CAGR, lifting their floating offshore wind market share to just over 40% by 2030. Norway's Utsira-Nord and California's Morro Bay zones illustrate how contiguous 1-GW blocks streamline array layouts and enable shared export corridors. Oil-and-gas majors bring subsea expertise that mitigates met-ocean risks, while classification societies have codified design fatigue factors exceeding 25 years. The shallow (<30 m) category remains confined to R&D prototypes where seabed conditions or ecological constraints make fixed monopiles unviable. Over time, increasing confidence in dynamic cable performance and floater structural redundancy is expected to tilt investment decisively toward water depths beyond 100 m, reinforcing the deep-water pathway for the floating offshore wind industry.
Semi-Submersible hulls dominated with 57% share of the floating offshore wind market in 2024, buoyed by designs such as WindFloat and VolturnUS that can be fabricated in modular sections and launched via existing docks. Their shallow draft facilitates tow-out operations without extensive dredging, a key advantage for shipyard-constrained nations. Mooring spreads use standard chain and polyester rope, minimizing bespoke hardware. The approach reliably delivers stability with pitch motions below 5°, ensuring drivetrain loads stay within warranty envelopes for 6-10 MW turbines. Developers value the platform's adaptability, enabling deployment from Norwegian fjords to the Canary Islands.
Spar-Buoy concepts, although accounting for 31% of 2024 capacity, are on an 84% CAGR trajectory as material usage per MW drops by up to 15% compared with Semi-Subs. Hywind Tampen's 107-m-long columns verified operational uptimes of 97% under North Sea squalls. Future variants plan slip-forming techniques that lower fabrication man-hours, while hybrid concrete-steel spars promise further capex savings. Tension-Leg Platforms offer heave suppression traits attractive for turbine nacelle heights approaching 180 m, but anchor-pile precision raises costs. Barge and hybrid formats remain niche, yet Japan's 3 MW Hibiki-nada plant shows how calm-sea locales can host low-freeboard hulls. Competition among hull types will continue until mass production clarifies the most bankable option, though Semi-Subs currently act as the reference design for lenders appraising floating offshore wind market risk.
The Floating Offshore Wind Market Report is Segmented by Water Depth (Shallow, Transitional and Deep), Floating Platform Type (Semi-Submersible, Spar-Buoy, and Others), Turbine Capacity Rating (Below 5 MW, 5 To 10 MW, and Others), Application Stage (Pre-Commercial Pilot, Commercial Utility-Scale, and Hybrid Wind-To-X), and by Geography (North America, Europe, Asia-Pacific, South America, and Middle East and Africa).
Geography Analysis
Europe maintained a commanding 92% share of global deployments in 2024, with a floating offshore wind market size close to 220 MW. Mature engineering clusters in Norway, Scotland, and Portugal underpin this lead, while the UK's 50 GW total offshore wind ambition-5 GW of which must be floating by 2030-anchors forward pipelines. State-backed grants like the GBP 160 million Floating Offshore Wind Manufacturing Investment Scheme funnel capex toward blade, tower, and mooring plants, shortening delivery times. Norway's Hywind Tampen has already demonstrated concrete CO2 savings by electrifying petroleum platforms, solidifying government and public buy-in. France is following with Mediterranean tenders that favor local fabrication yards in Fos-sur-Mer and Port-la-Nouvelle, expanding regional industrial footprints.
Asia-Pacific is the fastest-growing theatre, registering a 156% CAGR as island nations seek deeper-water options where continental shelf widths are minimal. Japan's target of 5.7 GW by fiscal 2030 and 45 GW by 2040 relies heavily on floating foundations; its seabed surveys identify 424 GW of theoretical resource above 10 m/s wind speeds. South Korea's 1.8 GW procurement round near Ulsan promises to ignite a specialized supply base encompassing chains, suction anchors, and heavy-lift barges. Taiwan positions itself as a non-China alternative for blades and nacelles, leveraging tax incentives inside its Port of Taichung free-trade zone. China itself dominates fixed-bottom additions, but provincial authorities from Guangdong to Zhejiang are cataloguing floating wind corridors exceeding 80 m depths to diversify coastal load centers.
North America ramps up under the Biden-Harris Administration's 30 GW offshore wind and 15 GW floating targets. California's twin lease zones at Morro Bay and Humboldt could host enough capacity to power 5.5 million households, but Endangered Species Act safeguards for the North Atlantic right whale prolong permitting cycles along the broader Pacific Coast. The Gulf of Mexico's milder sea states and dense brownfield infrastructure make it an attractive early-mover candidate, with oil majors repurposing jack-up rigs as temporary welding stations. Canada monitors the sector's advance yet waits for turbine icing studies before setting national quotas, while Mexico explores policy incentives to couple floating wind with existing gas-fired peakers on the Baja Peninsula. Collectively, North American projects account for more than 40 GW of auctioned potential, a base that will materially widen the floating offshore wind market after 2027.
- Siemens Gamesa Renewable Energy SA
- Vestas Wind Systems A/S
- GE Vernova (GE Renewable Energy)
- BW Ideol AS
- Equinor ASA
- Orsted A/S
- Principle Power Inc.
- Aker Solutions ASA
- Hexicon AB
- TotalEnergies SE
- Shell plc
- Ocean Winds (EDPR/ENGIE)
- Copenhagen Infrastructure Partners
- RWE AG
- Marubeni Corporation
- MingYang Smart Energy
- Goldwind Science & Technology
- Gazelle Wind Power Ltd.
Additional Benefits:
- The market estimate (ME) sheet in Excel format
- 3 months of analyst support
TABLE OF CONTENTS
1 Introduction
- 1.1 Study Assumptions & Market Definition
- 1.2 Scope of the Study
2 Research Methodology
3 Executive Summary
4 Market Landscape
- 4.1 Market Overview
- 4.2 Market Drivers
- 4.2.1 Growing Lease Awards in U.S. & APAC Deep-Water Zones
- 4.2.2 Rapid Turbine Upsizing to 15-20 MW Class Reducing LCOE
- 4.2.3 Oil & Gas Platform Conversions Unlocking Gulf of Mexico Supply Chain
- 4.2.4 EU & UK CfD Reform Boosting Bankability
- 4.2.5 National Hydrogen Roadmaps Creating Co-location Demand
- 4.2.6 Asian Cable-Vessel Build-out Shortening Installation Schedules
- 4.3 Market Restraints
- 4.3.1 WTIV & FIV Vessel Shortage Driving Day-rates > US$450k
- 4.3.2 High-Voltage Dynamic Cable Failures in 50-100 m Depth Pilots
- 4.3.3 California ESA Right-Whale Constraints Slowing BOEM Permits
- 4.3.4 Spot Steel Price Volatility (> US$950/t) Disrupting Floater Yards
- 4.4 Supply-Chain Analysis
- 4.5 Regulatory & Technological Outlook
- 4.6 Key Projects Information
- 4.6.1 Major Existing Projects
- 4.6.2 Upcoming Projects
- 4.7 Recent Trends & Developments
- 4.8 Porter's Five Forces
- 4.8.1 Bargaining Power of Suppliers
- 4.8.2 Bargaining Power of Buyers
- 4.8.3 Threat of New Entrants
- 4.8.4 Threat of Substitutes
- 4.8.5 Competitive Rivalry
- 4.9 Investment Analysis
5 Market Size & Growth Forecasts
- 5.1 By Water Depth
- 5.1.1 Shallow (Below 30 m)
- 5.1.2 Transitional (30 to 60 m)
- 5.1.3 Deep (Above 60 m)
- 5.2 By Floating Platform Type
- 5.2.1 Semi-Submersible
- 5.2.2 Spar-Buoy
- 5.2.3 Tension-Leg Platform (TLP)
- 5.2.4 Barge and Hybrid Concepts
- 5.3 By Turbine Capacity Rating
- 5.3.1 Below 5 MW
- 5.3.2 5 to 10 MW
- 5.3.3 11 to 15 MW
- 5.3.4 Above 15 MW
- 5.4 By Application Stage
- 5.4.1 Pre-Commercial Pilot
- 5.4.2 Commercial Utility-Scale
- 5.4.3 Hybrid Wind-to-X (Hydrogen, Desalination)
- 5.5 By Geography
- 5.5.1 North America
- 5.5.1.1 United States
- 5.5.1.2 Rest of North America
- 5.5.2 Europe
- 5.5.2.1 France
- 5.5.2.2 United Kingdom
- 5.5.2.3 Spain
- 5.5.2.4 Nordic Countries
- 5.5.2.5 Italy
- 5.5.2.6 Rest of Europe
- 5.5.3 Asia-Pacific
- 5.5.3.1 China
- 5.5.3.2 Japan
- 5.5.3.3 South Korea
- 5.5.3.4 Rest of Asia-Pacific
- 5.5.4 South America
- 5.5.4.1 Brazil
- 5.5.4.2 Argentina
- 5.5.4.3 Rest of South America
- 5.5.5 Middle East and Africa
- 5.5.5.1 United Arab Emirates
- 5.5.5.2 Saudi Arabia
- 5.5.5.3 South Africa
- 5.5.5.4 Rest of Middle East and Africa
- 5.5.1 North America
6 Competitive Landscape
- 6.1 Market Concentration
- 6.2 Strategic Moves (M&A, Partnerships, PPAs)
- 6.3 Market Share Analysis (Market Rank/Share for key companies)
- 6.4 Company Profiles (includes Global level Overview, Market level overview, Core Segments, Financials as available, Strategic Information, Products & Services, and Recent Developments)
- 6.4.1 Siemens Gamesa Renewable Energy SA
- 6.4.2 Vestas Wind Systems A/S
- 6.4.3 GE Vernova (GE Renewable Energy)
- 6.4.4 BW Ideol AS
- 6.4.5 Equinor ASA
- 6.4.6 Orsted A/S
- 6.4.7 Principle Power Inc.
- 6.4.8 Aker Solutions ASA
- 6.4.9 Hexicon AB
- 6.4.10 TotalEnergies SE
- 6.4.11 Shell plc
- 6.4.12 Ocean Winds (EDPR/ENGIE)
- 6.4.13 Copenhagen Infrastructure Partners
- 6.4.14 RWE AG
- 6.4.15 Marubeni Corporation
- 6.4.16 MingYang Smart Energy
- 6.4.17 Goldwind Science & Technology
- 6.4.18 Gazelle Wind Power Ltd.
7 Market Opportunities & Future Outlook
- 7.1 White-space & Unmet-Need Assessment
 浮体式海上风电市场:按组件、涡轮机功率、水深、技术、应用和发展阶段划分-2026-2032年全球市场预测
 2026年全球浮体式海上电市场报告2026年全球浮体式海上风力发电市场报告
 浮体式海上风电市场-2026-2031年预测
 全球浮体式海上风电系统市场:预测至2032年-按组件、平台类型、风扇容量、水深、轴线、应用、最终用户及地区进行分析
 海上漂浮式风电:全球市场份额和排名、总收入和需求预测(2025-2031年)
 全球浮体式海上风力发电市场
 浮动离岸风电市场-全球产业规模、份额、趋势、机会和预测,按水深(浅水、过渡水域和深水)、按涡轮机容量、按地区、按竞争细分,2020-2030 年
 浮动离岸风能市场机会、成长动力、产业趋势分析及2025-2034年预测
 亚太地区浮体式海上风电:市场占有率分析、产业趋势与成长预测(2025-2030)