


 |
市场调查报告书
商品编码
1851812
延展实境(XR):市场份额分析、行业趋势、统计数据和成长预测(2025-2030 年)Extended Reality (XR) - Market Share Analysis, Industry Trends & Statistics, Growth Forecasts (2025 - 2030) |
||||||
※ 本网页内容可能与最新版本有所差异。详细情况请与我们联繫。
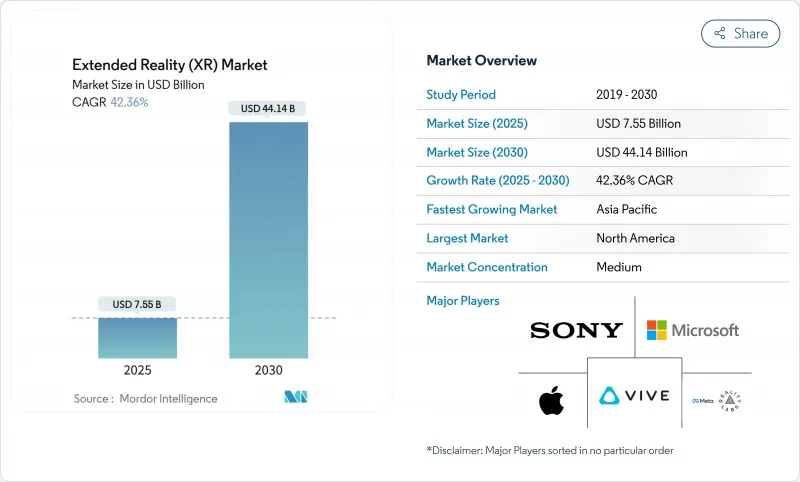
预计到 2025 年,延展实境(XR) 市场将达到 75.5 亿美元,到 2030 年将达到 441.4 亿美元,复合年增长率为 42.36%。
XR技术在製造业、医疗保健、国防等领域的快速企业应用,使其超越了消费娱乐,从游戏新奇玩意转变为关键任务生产力工具。第五代行动网路与边缘运算的结合消除了延迟障碍,使得毫秒精度的可视化在工厂和手术室等场所实用化。嵌入空间运算的人工智慧可实现培训内容的个人化,而即时分析则形成回馈闭环,进一步提升了可衡量的效益。美国两国政府的资助,以及OpenXR等开放标准的推动,正在加速生态系统的成熟,并缓解人们对厂商锁定的担忧。供应链限制和零件价格上涨仍然是阻碍因素,但随着新的半导体产能和替代材料来源投入生产,这些因素正在逐步缓解。
全球延展实境(XR)市场趋势与洞察
扩大5G覆盖范围和边缘运算可产生协同效应
低于 20 毫秒的延迟使得多人 VR 协作摆脱了背包的束缚,爱立信、AT&T、Dreamscape 和高通的试验都证明了这一点。中国钢铁集团的 5G 虚拟工厂参观整合了来自 85 个生产节点的即时数据,证明了其在重工业领域的价值。 DHL 的智慧眼镜试验展示了即时拣货指导在物流的优势。随着运算向网路边缘转移,设备重量减轻,提高了轮班期间的舒适度。因此,通讯业者正在用户 50 公里范围内部署微型资料中心,以保持身临其境型吞吐量。
XR正越来越多地被整合到数位双胞胎和工业4.0框架中。
和硕的 PEGAVERSE 基于 NVIDIA Omniverse 建造了五个虚拟工厂,透过远距离诊断和场景测试来减少停机时间和差旅时间。BASF的 AR 工厂方案将感测器数据与身临其境型视觉化相结合,以简化风险识别流程。西门子和SONY推出了售价 4,750 美元的 SRH-S1 工程头戴式显示器,实现了像素级精确的设计协作。 OpenUSD 对齐技术将 CAD、PLM 和物联网资料整合到单一空间层。因此,平台供应商可以透过订阅模式而非一次性授权费来实现视觉化功能的获利。
高传真光学元件和处理器的初始成本很高
镓和锗的短缺导致光学元件价格上涨高达25%。 Meta旗下的Reality Labs预计2024年第四季XR硬体销售额将达到11亿美元,但自2020年以来累计亏损600亿美元,凸显了盈利的挑战。中小企业缺乏资金或明确的投资报酬率,因此犹豫不决。云渲染的XR技术虽然可以减轻设备重量,但会带来延迟方面的权衡,使其应用范围仅限于5G讯号覆盖良好的区域。
其他福利:
- Excel格式的市场预测(ME)表
- 3个月的分析师支持
目录
第一章 引言
- 研究假设和市场定义
- 调查范围
第二章调查方法
第三章执行摘要
第四章 市场情势
- 市场概览
- 市场驱动因素
- 扩大5G覆盖范围和边缘运算可产生协同效应
- XR正越来越多地被整合到数位双胞胎和工业4.0框架中。
- 企业对身临其境型远距培训的需求日益增长
- 空间感测器在大众市场智慧型手机中的集成
- 政府资助与元宇宙相关的研究和开发
- 采用开放式XR标准可减少厂商锁定。
- 市场限制
- 高传真光学元件和处理器的初始成本很高
- 使用者晕动症和人体工学限制
- 眼动追踪和手部追踪分析中的资料隐私漏洞
- 内容编写工具的生态系支离破碎
- 供应链分析
- 监管环境
- 技术展望
- 波特五力模型
- 供应商的议价能力
- 消费者议价能力
- 新进入者的威胁
- 替代品的威胁
- 竞争对手之间的竞争
- 评估市场的宏观经济因素
第五章 市场规模与成长预测
- 报价
- 硬体
- 软体
- 服务
- 依设备类型
- 头戴式显示器(有线、独立式)
- 抬头显示器
- 手持行动装置
- 其他的
- 透过技术
- 虚拟实境(VR)
- 扩增实境(AR)
- 混合实境(MR)
- 按最终用户行业划分
- 游戏与娱乐
- 医疗保健和生命科学
- 工业和製造业
- 零售与电子商务
- 教育和培训
- 航太/国防
- 建筑、工程与施工
- 其他的
- 按地区
- 北美洲
- 美国
- 加拿大
- 墨西哥
- 南美洲
- 巴西
- 阿根廷
- 其他南美洲国家
- 欧洲
- 英国
- 德国
- 法国
- 义大利
- 西班牙
- 其他欧洲地区
- 亚太地区
- 中国
- 日本
- 韩国
- 印度
- 澳洲
- 亚太其他地区
- 中东和非洲
- 中东
- 沙乌地阿拉伯
- 阿拉伯聯合大公国
- 土耳其
- 其他中东地区
- 非洲
- 南非
- 奈及利亚
- 埃及
- 其他非洲地区
- 北美洲
第六章 竞争情势
- 市场集中度
- 策略趋势
- 市占率分析
- 公司简介
- Meta Platforms Inc.(Reality Labs)
- Sony Group Corp.
- Microsoft Corp.
- Apple Inc.
- HTC Corp.(Vive)
- Qualcomm Technologies Inc.
- Samsung Electronics Co. Ltd.
- Alphabet Inc.(Google XR)
- Pico Interactive Inc.(ByteDance)
- Varjo Technologies Oy
- Magic Leap Inc.
- Nvidia Corp.
- Unity Technologies Inc.
- Vuzix Corp.
- Lenovo Group Ltd.
- Snap Inc.
- Niantic Inc.
- Ultraleap Ltd.
- HP Inc.
- Immersion Corp.
第七章 市场机会与未来展望
The Extended Reality market reached USD 7.55 billion in 2025 and is projected to deliver USD 44.14 billion by 2030, reflecting a 42.36% CAGR.
Rapid enterprise adoption across manufacturing, healthcare, and defense now outpaces consumer entertainment, turning XR from a gaming novelty into a mission-critical productivity tool. Five-generation mobile networks paired with edge computing have erased latency barriers, making millisecond-accurate visualization practical on factory floors and in surgical suites. Artificial intelligence embedded in spatial computing personalizes training content while real-time analytics close feedback loops, further raising measurable returns. Government funding in the United States and China, coupled with open standards such as OpenXR, is accelerating ecosystem maturity and reducing vendor lock-in worries. Supply chain constraints and component price inflation remain headwinds but continue to ease as new semiconductor capacity and alternative material sourcing enter production.
Global Extended Reality (XR) Market Trends and Insights
Expanding 5G Coverage and Edge Computing Synergy
Sub-20 ms latency now enables multi-user VR collaboration without tethered backpack PCs, as trials by Ericsson, AT&T, Dreamscape, and Qualcomm have shown. China Steel Corporation's 5G-enabled virtual factory tours integrate live data from 85 production nodes, proving value for heavy industry. DHL smart-glasses pilots illustrate logistics gains from real-time pick guidance. Device weight drops as compute moves to the network edge, boosting shift-length comfort. Telcos therefore place micro-data-centers within 50 km of users to sustain immersive throughput.
Increased Integration of XR into Digital Twin and Industry 4.0 Frameworks
Pegatron's PEGAVERSE builds five virtual factories on NVIDIA Omniverse for remote diagnostics and scenario testing, lowering downtime and travel. BASF's AR-enabled plant planning links sensor data with immersive visualization to streamline hazard identification. Siemens and Sony priced the SRH-S1 engineering headset at USD 4,750 to deliver pixel-accurate design collaboration. OpenUSD alignment lets disparate CAD, PLM, and IoT feeds merge into a single spatial layer. Platform vendors thus monetize subscription-based visualization rather than one-off license fees.
High Upfront Costs of High-Fidelity Optics and Processors
Gallium and germanium shortages have inflated optics prices by up to 25%. Meta's Reality Labs has accumulated USD 60 billion losses since 2020 while selling USD 1.1 billion in Q4 2024 XR hardware, underscoring profitability challenges. Smaller firms hesitate without capital or clear ROI. Cloud-rendered XR lightens devices yet introduces latency trade-offs that limit usage to well-served 5G zones.
Other drivers and restraints analyzed in the detailed report include:
- Rising Enterprise Demand for Immersive Remote Training
- Mass-Market Smartphone Integration of Spatial Sensors
- User Motion-Sickness and Ergonomic Limitations
For complete list of drivers and restraints, kindly check the Table Of Contents.
List of Companies Covered in this Report:
- Meta Platforms Inc. (Reality Labs)
- Sony Group Corp.
- Microsoft Corp.
- Apple Inc.
- HTC Corp. (Vive)
- Qualcomm Technologies Inc.
- Samsung Electronics Co. Ltd.
- Alphabet Inc. (Google XR)
- Pico Interactive Inc. (ByteDance)
- Varjo Technologies Oy
- Magic Leap Inc.
- Nvidia Corp.
- Unity Technologies Inc.
- Vuzix Corp.
- Lenovo Group Ltd.
- Snap Inc.
- Niantic Inc.
- Ultraleap Ltd.
- HP Inc.
- Immersion Corp.
Additional Benefits:
- The market estimate (ME) sheet in Excel format
- 3 months of analyst support
TABLE OF CONTENTS
1 INTRODUCTION
- 1.1 Study Assumptions and Market Definition
- 1.2 Scope of the Study
2 RESEARCH METHODOLOGY
3 EXECUTIVE SUMMARY
4 MARKET LANDSCAPE
- 4.1 Market Overview
- 4.2 Market Drivers
- 4.2.1 Expanding 5G coverage and edge computing synergy
- 4.2.2 Increased integration of XR into digital twin and Industry 4.0 frameworks
- 4.2.3 Rising enterprise demand for immersive remote-training
- 4.2.4 Mass-market smartphone integration of spatial sensors
- 4.2.5 Government funding for metaverse-related Rand
- 4.2.6 Adoption of open XR standards lowering vendor lock-in
- 4.3 Market Restraints
- 4.3.1 High upfront costs of high-fidelity optics and processors
- 4.3.2 User motion-sickness and ergonomic limitations
- 4.3.3 Data-privacy gaps in eye- and hand-tracking analytics
- 4.3.4 Fragmented content-authoring tool ecosystem
- 4.4 Supply-Chain Analysis
- 4.5 Regulatory Landscape
- 4.6 Technological Outlook
- 4.7 Porter's Five Forces
- 4.7.1 Bargaining Power of Suppliers
- 4.7.2 Bargaining Power of Consumers
- 4.7.3 Threat of New Entrants
- 4.7.4 Threat of Substitutes
- 4.7.5 Intensity of Competitive Rivalry
- 4.8 Assesment of Macroeconomic Factors on the market
5 MARKET SIZE AND GROWTH FORECASTS (VALUE)
- 5.1 By Offering
- 5.1.1 Hardware
- 5.1.2 Software
- 5.1.3 Services
- 5.2 By Device Type
- 5.2.1 Head-Mounted Displays (Tethered, Stand-alone)
- 5.2.2 Head-Up Displays
- 5.2.3 Handheld and Mobile Devices
- 5.2.4 Others
- 5.3 By Technology
- 5.3.1 Virtual Reality (VR)
- 5.3.2 Augmented Reality (AR)
- 5.3.3 Mixed Reality (MR)
- 5.4 By End-user Industry
- 5.4.1 Gaming and Entertainment
- 5.4.2 Healthcare and Life Sciences
- 5.4.3 Industrial and Manufacturing
- 5.4.4 Retail and E-commerce
- 5.4.5 Education and Training
- 5.4.6 Aerospace and Defense
- 5.4.7 Architecture, Engineering and Construction
- 5.4.8 Others
- 5.5 By Geography
- 5.5.1 North America
- 5.5.1.1 United States
- 5.5.1.2 Canada
- 5.5.1.3 Mexico
- 5.5.2 South America
- 5.5.2.1 Brazil
- 5.5.2.2 Argentina
- 5.5.2.3 Rest of South America
- 5.5.3 Europe
- 5.5.3.1 United Kingdom
- 5.5.3.2 Germany
- 5.5.3.3 France
- 5.5.3.4 Italy
- 5.5.3.5 Spain
- 5.5.3.6 Rest of Europe
- 5.5.4 Asia-Pacific
- 5.5.4.1 China
- 5.5.4.2 Japan
- 5.5.4.3 South Korea
- 5.5.4.4 India
- 5.5.4.5 Australia
- 5.5.4.6 Rest of Asia-Pacific
- 5.5.5 Middle East and Africa
- 5.5.5.1 Middle East
- 5.5.5.1.1 Saudi Arabia
- 5.5.5.1.2 United Arab Emirates
- 5.5.5.1.3 Turkey
- 5.5.5.1.4 Rest of Middle East
- 5.5.5.2 Africa
- 5.5.5.2.1 South Africa
- 5.5.5.2.2 Nigeria
- 5.5.5.2.3 Egypt
- 5.5.5.2.4 Rest of Africa
- 5.5.1 North America
6 COMPETITIVE LANDSCAPE
- 6.1 Market Concentration
- 6.2 Strategic Moves
- 6.3 Market Share Analysis
- 6.4 Company Profiles (includes Global level Overview, Market level overview, Core Segments, Financials as available, Strategic Information, Market Rank/Share for key companies, Products and Services, and Recent Developments)
- 6.4.1 Meta Platforms Inc. (Reality Labs)
- 6.4.2 Sony Group Corp.
- 6.4.3 Microsoft Corp.
- 6.4.4 Apple Inc.
- 6.4.5 HTC Corp. (Vive)
- 6.4.6 Qualcomm Technologies Inc.
- 6.4.7 Samsung Electronics Co. Ltd.
- 6.4.8 Alphabet Inc. (Google XR)
- 6.4.9 Pico Interactive Inc. (ByteDance)
- 6.4.10 Varjo Technologies Oy
- 6.4.11 Magic Leap Inc.
- 6.4.12 Nvidia Corp.
- 6.4.13 Unity Technologies Inc.
- 6.4.14 Vuzix Corp.
- 6.4.15 Lenovo Group Ltd.
- 6.4.16 Snap Inc.
- 6.4.17 Niantic Inc.
- 6.4.18 Ultraleap Ltd.
- 6.4.19 HP Inc.
- 6.4.20 Immersion Corp.
7 MARKET OPPORTUNITIES AND FUTURE OUTLOOK
- 7.1 White-space and Unmet-Need Assessment
 日本延展实境市场报告(按组件、类型、组织规模、应用(虚拟实境、扩增实境、混合实境)、最终用户产业和地区划分,2026-2034 年)
 2025年全球即时动态扩增实境(XR)工具市场报告2025年边缘联合XR平台全球市场报告
 2032 年教育领域的扩增实境(XR) 市场:按组件、部署模式、技术、应用、最终用户和地区进行的全球分析
 延展实境市场(按组件、技术、设备类型和垂直产业)—2025-2032 年全球预测扩增实境显示市场按连接方式、设备类型、显示技术、技术和最终用户划分-2025-2032年全球预测2025年建筑业扩增实境全球市场报告2025年全球延展实境显示器市场报告2025年全球扩增实境技术市场报告2025年医疗保健领域扩增实境全球市场报告