


 |
市场调查报告书
商品编码
1906089
基于位置的虚拟实境-市场占有率分析、产业趋势与统计、成长预测(2026-2031)Location-Based VR - Market Share Analysis, Industry Trends & Statistics, Growth Forecasts (2026 - 2031) |
||||||
※ 本网页内容可能与最新版本有所差异。详细情况请与我们联繫。
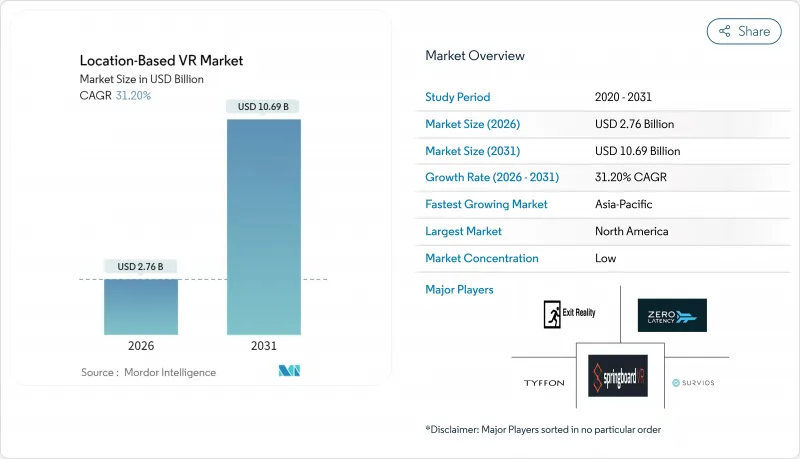
预计到 2025 年,基于位置的 VR 市场价值将达到 21 亿美元,从 2026 年的 27.6 亿美元成长到 2031 年的 106.9 亿美元。
预计在预测期(2026-2031 年)内,复合年增长率将达到 31.2%。
硬体价格下降、与热门智慧财产权 (IP) 的合作增加以及基础设施的改善提升了设施的经济效益,这些因素共同推动了这一加速成长。营运商如今将虚拟实境体验馆定位为稳定的收入来源,与保龄球馆、电影院和密室逃脱游戏厅竞争。在消费者对社交体验的需求、活性化经营模式的兴起以及城市更新补贴的津贴下,市场扩张稳步推进。设备製造商透过增加预测性诊断和无线功能来满足设施需求,从而提高维护效率。同时,软体平台正在将渲染转移到云端并缩短内容更新周期,从而增加用户重复存取的收入潜力。这些因素共同推动了基于位置的虚拟实境市场走上稳健成长的道路。
全球基于位置的虚拟实境市场趋势与洞察
硬体成本的快速下降提高了营运商的投资收益。
设备价格下降和无线系统布线成本降低,正在改善场馆的经济效益。 Zero Latency 的 8 人 VR 系统目前售价为 24.5 万美元,比上一代产品便宜 30%,同时还增加了 5K 解析度和无线串流功能。无线组件省去了耗时的设定步骤,使工作人员能够更快地开始游戏。头显内建的预测性诊断功能可减少非计划性停机时间并降低维修预算。较低的资本支出和人员配备减少,使得位置优越的场馆的投资回收期从三年缩短至最短 18 个月。价格下降正鼓励小规模业者进入基于位置的 VR 市场,从而扩大场馆的安装基础。
消费者对身临其境型行动体验的需求日益增长
消费者正增加自由裁量权的支出,用于那些无法在家复製的共用体验。 Sandbox VR在2024年售出140万张门票,较去年同期成长33%,美国顾客平均消费53美元。团体预订已成为常态,85%的游客会携带3-6名同伴,凸显了社交娱乐的吸引力。研究表明,年轻一代如今更重视创造回忆而非物质财富,这种偏好即使在经济状况不确定时期也能维持较高的客流量。营运商正抓住这一趋势,将食品、饮料和周边商品融入行动体验中,从而提高人均消费和利润率。
较高的初始资本投入与维护成本
即使经过近期的成本削减,经营完整的游乐设施仍然需要大量资金。一套Park Playground特许经营方案需要35万英镑(约44.8万美元)的初始资金,投资者预计第一年收入将达到60万英镑(约合76.8万美元),并在大约20个月内实现盈亏平衡。年度维护成本相当于设施价值的10%至15%,而内容授权费用可能高达每部作品数千美元。在区域性城市,由于房地产成本、保险成本以及熟练技术人员的人事费用,损益平衡点甚至更高。这种成本壁垒减缓了新兴市场(资金筹措管道有限)的普及速度。
细分市场分析
2024年,硬体将成为设施支出的主要组成部分,这主要受头戴式显示器、追踪摄影机和网路设备高昂成本的驱动。商用头戴式显示器的价格远高于消费级产品,每个售价在800美元到3000美元之间,迫使营运商配备备用设备以减少停机时间。网路附加储存、GPU伺服器和安全设备也将推高成本。
儘管硬体占据主导地位反映了当前的支出结构,但软体领域目前正经历着最快的成长,年复合成长率高达 33.15%。 NVIDIA CloudXR 等边缘云端管道使场馆能够从异地伺服器串流逼真的环境。订阅模式将零散的投资转化为可控的月费,而云端託管的分析功能则为营运商提供了关于用户停留时间和转换漏斗的指导。转向软体可以提高利润率、稳定现金流,并在景气衰退时期增强韧性。
VR娱乐设施面积小规模,体验週转快,因此非常适合购物中心和娱乐区。到2025年,VR娱乐设施将占据45.60%的市场份额,并受到优先考虑透过吸引租户来吸引顾客的房地产所有者的青睐。营运商正透过改进布局、配备自助服务终端以及增加附带消费(例如销售轻食和周边商品)来缩短等待时间。
自由漫游竞技场目前是领先的应用领域,预计到2031年将以33.40%的复合年增长率成长。无线追踪和精简型用户端头戴设备让8-12名玩家无需背负背包即可在仓库大小的空间内自由探索。玩家们在现实世界中解谜、躲避虚拟敌人并互相击掌高触感,从而带动口碑传播。企业团建活动和生日派对也纷纷涌向这些竞技场,不仅能带来平日收入,还能有效缓和需求的波动。
区域分析
到2025年,北美将继续保持主导,这主要得益于富裕的消费者、有利的特许经营法律以及城市更新奖励。旧金山的「市中心ENRG」计画为有助于振兴零售街区的体验式场所提供5万美元的津贴。业者通常将VR与餐饮概念结合,打造适合混合用途区域的混合空间。在加拿大,购物中心业主正在将现有的主力店重新定位为娱乐中心,协调VR体验馆、匹克球场和电竞休息室等设施。墨西哥开发商正在采用收益分成租赁模式,以降低初始租金并吸引外国加盟商。
儘管亚太地区面积较小,但其复合年增长率却高达33.20%,位居全球之首。中国的国家蓝图旨在2026年将VR相关产业规模扩大至3,500亿日圆(人民币),并为硬体製造商和场馆连锁提供补贴。地方政府津贴涵盖娱乐区的土地成本,有助于降低业者的风险。日本成熟的主机游戏机文化对内容有着极高的期望,促使场馆透过区域独家游戏和动画合作来打造差异化优势。韩国乐天世界建造了一个700平方公尺的自由漫游VR体验馆,融合了K-pop智慧财产权和社群媒体拍照点。在印度的一线城市,购物中心空置率的上升促使业主将其改造成VR娱乐丛集,并提供租金补贴。每个市场都会根据当地的休閒模式,量身订做游乐场、VR体验馆和教育中心的组合。
欧洲正经历稳定成长,主要集中在德国、英国和法国。受高人均休閒消费的吸引,德国的特许经营伙伴承诺到2026年开设多达12家Sandbox VR体验中心。英国则着重走高端路线,在伦敦和曼彻斯特的旗舰店提供精酿鸡尾酒和VIP休息室。法国正利用文化基金在其国家博物馆内安装VR展品。东欧业者正利用较低的建设成本,但同时也面临消费者接受度较低的挑战,他们透过与西方品牌成立合资企业来共用行销经验。中东和非洲地区是一个新兴市场,但旅游业主导的消费为其发展提供了支撑。沙乌地阿拉伯的「2030愿景」计画正在资助在利雅德新城中心建造混合实境乐园,而阿联酋的一家购物中心则将VR技术与室内跳伞和雪地乐园相结合,以保持全年客流量。
其他福利:
- Excel格式的市场预测(ME)表
- 3个月的分析师支持
目录
第一章 引言
- 研究假设和市场定义
- 调查范围
第二章调查方法
第三章执行摘要
第四章 市场情势
- 市场概览
- 市场驱动因素
- 硬体成本的快速下降提高了营运商的投资收益(ROI)。
- 消费者对身临其境型户外体验的需求日益增长
- 与热门IP进行内容合作
- 无线自由漫游追踪技术的进步
- 5G边缘串流媒体降低了本地运算成本
- 体验式设施的城市振兴津贴
- 市场限制
- 较高的初始资本投入与维护成本
- 独家高级多人游戏内容
- 保险费和责任险;
- 对光学元件征收半导体关税
- 产业价值链分析
- 宏观经济因素的影响
- 技术展望
- 监管环境
- 波特五力分析
- 供应商的议价能力
- 买方的议价能力
- 新进入者的威胁
- 替代品的威胁
- 竞争对手之间的竞争
第五章 市场规模与成长预测
- 按解决方案类型
- 硬体
- 头戴式显示器
- 抬头显示器
- 眼镜
- 感应器
- 相机
- 软体
- 硬体
- 透过使用
- VR娱乐设施
- VR主题乐园
- VR影院
- 自由漫游竞技场
- VR电竞休息室
- 教育培训中心
- 按最终用途
- 游乐园
- 游乐场工作室
- 电影院
- 博物馆和文化中心
- 商业和零售商店
- 军事和训练设施
- 透过技术
- 2D
- 3D
- 云端融合现实
- 按地区
- 北美洲
- 美国
- 加拿大
- 墨西哥
- 南美洲
- 巴西
- 阿根廷
- 其他南美洲
- 欧洲
- 德国
- 法国
- 英国
- 义大利
- 西班牙
- 俄罗斯
- 其他欧洲地区
- 亚太地区
- 中国
- 日本
- 韩国
- 印度
- 澳洲
- 亚太其他地区
- 中东
- 阿拉伯聯合大公国
- 沙乌地阿拉伯
- 土耳其
- 其他中东地区
- 非洲
- 南非
- 奈及利亚
- 埃及
- 其他非洲地区
- 北美洲
第六章 竞争情势
- 市场集中度
- 策略趋势
- 市占率分析
- 公司简介
- Sandbox VR Inc.
- Zero Latency Pty Ltd
- Hologate GmbH
- Dreamscape Immersive Inc.
- VRstudios Inc.
- Vertigo Games Holding BV(Springboard VR)
- EXIT VR GmbH
- Survios Inc.
- Tyffon Inc.
- Neurogaming Limited
- Ctrl V Inc.
- IMAX Corporation
- Spaces LLC
- Nomadic Inc.
- The VOID LLC
- HTC Corporation(Viveport Arcade)
- Facebook Technologies LLC(Oculus VR)
- Disney Parks, Experiences and Products Inc.
- Pico Interactive Inc.
- DPVR Co. Ltd.
第七章 市场机会与未来展望
The location-based virtual reality market was valued at USD 2.1 billion in 2025 and estimated to grow from USD 2.76 billion in 2026 to reach USD 10.69 billion by 2031, at a CAGR of 31.2% during the forecast period (2026-2031).
The acceleration comes from falling hardware prices, rising blockbuster intellectual-property partnerships, and infrastructure advances that improve venue economics. Operators now treat venues as dependable profit centers that compete with bowling, cinemas, and escape rooms. Consumer demand for social experiences, strong franchise roll-outs, and supportive urban revitalization grants keep expansion on track. Equipment makers align with venue needs by adding predictive diagnostics and wireless capability that streamline maintenance. At the same time, software platforms shift rendering to the cloud and shorten content-refresh cycles, which raises repeat-visit revenue potential. These forces collectively anchor the location-based virtual reality market on a solid growth trajectory.
Global Location-Based VR Market Trends and Insights
Rapid Hardware Cost Decline Improving ROI for Operators
Venue economics improve as equipment prices drop and wireless systems remove cabling costs. A Zero Latency eight-player rig now lists at USD 245,000, down 30% from the prior generation while adding 5K resolution and wireless streaming. Wireless packs eliminate time-consuming setup tasks so staff can turn around play sessions faster. Predictive diagnostics inside headsets cut unplanned downtime and shrink maintenance budgets. Lower capital outlays and lighter staffing shorten payback periods from three years to as little as 18 months for well located sites. The downward price curve motivates smaller entrepreneurs to enter the location-based virtual reality market, broadening the venue footprint.
Growing Consumer Appetite for Immersive Out-of-Home Experiences
Consumers channel more discretionary spending toward shared experiences that cannot be reproduced at home. Sandbox VR sold 1.4 million tickets in 2024, up 33% year over year, at an average U.S. price of USD 53 per guest. Group bookings dominate, with 85% of visits involving three to six participants, showing the draw of social play. Surveys indicate younger adults now rank memory-making activities above material goods, a preference that underpins healthy attendance even when macroeconomic conditions wobble. Operators leverage this trend by layering food, beverage, and merchandise into the outing, which lifts per-capita spend and margins.
High Upfront Capex and Maintenance
A full venue still demands sizeable capital even after recent cost declines. The Park Playground's franchise kit requires GBP 350,000 (USD 448,000) in startup funds, and investors aim for GBP 600,000 (USD 768,000) in first-year revenue to break even in about 20 months. Annual upkeep can run 10-15% of hardware value, and content licenses add several thousand dollars per title. Real-estate, insurance, and skilled technician wages push breakeven higher in secondary cities. This cost barrier slows penetration in emerging economies where financing options remain limited.
Other drivers and restraints analyzed in the detailed report include:
- Content Partnerships with Blockbuster IP
- Advances in Wireless Free-Roam Tracking
- Rising Insurance and Liability Premiums
For complete list of drivers and restraints, kindly check the Table Of Contents.
Segment Analysis
Hardware accounts for the bulk of 2024 venue spending because head-mounted displays, tracking cameras, and networking gear command premium prices. Commercial-grade headsets sell for USD 800 to USD 3,000 apiece, far above consumer models, and operators must own spares to minimize downtime. Network-attached storage devices, GPU servers, and safety gear push the bill higher.
Although hardware dominance reflects today's spending mix, software now posts the fastest rise at 33.15% CAGR. Edge-cloud pipelines like NVIDIA CloudXR let venues stream photorealistic environments from off-site servers. Subscription models convert lumpy investments into manageable monthly fees, and cloud-hosted analytics guide operators on dwell times and conversion funnels. The pivot toward software lifts margins and smooths cash flow, offering resiliency in downturns
VR Arcades occupy modest footprints, deliver quick session turnover, and suit mall or high-street settings. They held 45.60% share in 2025 because landlords favor such tenants for foot-traffic generation. Operators refine layouts with self-serve kiosks that shorten wait lines and grow ancillary spend on snacks and merchandise.
Free-Roam Arenas now pace the application leaderboard with 33.40% CAGR through 2031. Wireless tracking and thin-client headsets allow 8-12 players to navigate warehouse-scale spaces without backpacks. Teams solve puzzles, dodge digital foes, and share real-world high-fives, which elevates word-of-mouth marketing. Corporate team-building events and birthday parties gravitate to arenas, producing weekday revenue that smooths peaks and troughs.
The Location-Based Virtual Reality Market Report is Segmented by Solution Type (Hardware, and Software), Application (VR Arcades, VR Theme Parks, VR Cinemas, Free-Roam Arenas, and More), End-Use (Amusement Parks, Arcade Studios, Cinemas, Museums and Cultural Centres, Commercial and Retail Venues, and More), Technology (2D, 3D, and Cloud Merged Reality), and Geography. The Market Forecasts are Provided in Terms of Value (USD).
Geography Analysis
North America retains leadership with 39.60% of location-based virtual reality market share in 2025 thanks to affluent consumers, favorable franchising laws, and urban revitalization incentives. San Francisco's Downtown ENRG program earmarks USD 50,000 grants for experiential venues that help reactivate retail corridors. Operators often pair VR with food and beverage concepts, creating hybrid spaces that fit mixed-use districts. In Canada, mall owners reposition legacy anchor stores as entertainment hubs that host VR arenas, pickleball courts, and e-sports lounges under one roof. Mexican developers adopt revenue-sharing lease models that lower upfront rent and invite foreign franchisees.
Asia Pacific, while smaller today, delivers the fastest 33.20% CAGR. China's national roadmap targets RMB 350 billion in overall VR activity by 2026, funneling subsidies toward hardware makers and venue chains. Provincial grants cover land costs for entertainment districts, reducing operator risk. Japan's mature console culture fuels high content expectations, so venues attain differentiation with location-exclusive titles and anime collaborations. South Korea's Lotte World built a 700-square-meter free-roam arena that ties into K-pop intellectual property and social-media-friendly photo zones. India's first-tier cities witness rising mall vacancy rates, which landlords convert into VR entertainment clusters at subsidized rents. Each market tailors its mix of arcades, arenas, and educational centres to local leisure patterns.
Europe posts steady growth anchored by Germany, the United Kingdom, and France. German franchise partners committed to rolling out up to 12 Sandbox VR locations each by 2026, attracted by strong per-capita spending on leisure. The United Kingdom favors premium positioning, with flagship London and Manchester venues bundling craft cocktails and VIP lounges. France capitalizes on cultural funding to install VR exhibits in national museums. Eastern European operators leverage lower construction costs yet face slower consumer adoption, prompting joint ventures with Western brands to share marketing know-how. The Middle East and Africa region, though still emerging, enjoys tourist-led spending. Saudi Arabia's Vision 2030 plan finances mixed-reality parks in Riyadh's new downtown, and United Arab Emirates malls integrate VR with indoor skydiving and snow parks to maintain year-round traffic.
- Sandbox VR Inc.
- Zero Latency Pty Ltd
- Hologate GmbH
- Dreamscape Immersive Inc.
- VRstudios Inc.
- Vertigo Games Holding B.V. (Springboard VR)
- EXIT VR GmbH
- Survios Inc.
- Tyffon Inc.
- Neurogaming Limited
- Ctrl V Inc.
- IMAX Corporation
- Spaces LLC
- Nomadic Inc.
- The VOID LLC
- HTC Corporation (Viveport Arcade)
- Facebook Technologies LLC (Oculus VR)
- Disney Parks, Experiences and Products Inc.
- Pico Interactive Inc.
- DPVR Co. Ltd.
Additional Benefits:
- The market estimate (ME) sheet in Excel format
- 3 months of analyst support
TABLE OF CONTENTS
1 INTRODUCTION
- 1.1 Study Assumptions and Market Definition
- 1.2 Scope of the Study
2 RESEARCH METHODOLOGY
3 EXECUTIVE SUMMARY
4 MARKET LANDSCAPE
- 4.1 Market Overview
- 4.2 Market Drivers
- 4.2.1 Rapid hardware cost decline improving ROI for operators
- 4.2.2 Growing consumer appetite for immersive out-of-home experiences
- 4.2.3 Content partnerships with blockbuster IP
- 4.2.4 Advances in wireless free-roam tracking
- 4.2.5 5G edge streaming reduces in-venue compute costs
- 4.2.6 Urban revitalisation grants for experiential venues
- 4.3 Market Restraints
- 4.3.1 High upfront capex and maintenance
- 4.3.2 Limited premium multiplayer content
- 4.3.3 Rising insurance and liability premiums
- 4.3.4 Semiconductor tariffs on optical components
- 4.4 Industry Value Chain Analysis
- 4.5 Impact of Macroeconomic Factors
- 4.6 Technological Outlook
- 4.7 Regulatory Landscape
- 4.8 Porter's Five Forces Analysis
- 4.8.1 Bargaining Power of Suppliers
- 4.8.2 Bargaining Power of Buyers
- 4.8.3 Threat of New Entrants
- 4.8.4 Threat of Substitute Products
- 4.8.5 Intensity of Competitive Rivalry
5 MARKET SIZE AND GROWTH FORECASTS (VALUE)
- 5.1 By Solution Type
- 5.1.1 Hardware
- 5.1.1.1 Head-Mounted Displays
- 5.1.1.2 Head-Up Displays
- 5.1.1.3 Glasses
- 5.1.1.4 Sensors
- 5.1.1.5 Cameras
- 5.1.2 Software
- 5.1.1 Hardware
- 5.2 By Application
- 5.2.1 VR Arcades
- 5.2.2 VR Theme Parks
- 5.2.3 VR Cinemas
- 5.2.4 Free-Roam Arenas
- 5.2.5 VR Esports Lounges
- 5.2.6 Educational and Training Centres
- 5.3 By End-Use
- 5.3.1 Amusement Parks
- 5.3.2 Arcade Studios
- 5.3.3 Cinemas
- 5.3.4 Museums and Cultural Centres
- 5.3.5 Commercial and Retail Venues
- 5.3.6 Military and Training Facilities
- 5.4 By Technology
- 5.4.1 2D
- 5.4.2 3D
- 5.4.3 Cloud Merged Reality
- 5.5 By Geography
- 5.5.1 North America
- 5.5.1.1 United States
- 5.5.1.2 Canada
- 5.5.1.3 Mexico
- 5.5.2 South America
- 5.5.2.1 Brazil
- 5.5.2.2 Argentina
- 5.5.2.3 Rest of South America
- 5.5.3 Europe
- 5.5.3.1 Germany
- 5.5.3.2 France
- 5.5.3.3 United Kingdom
- 5.5.3.4 Italy
- 5.5.3.5 Spain
- 5.5.3.6 Russia
- 5.5.3.7 Rest of Europe
- 5.5.4 Asia Pacific
- 5.5.4.1 China
- 5.5.4.2 Japan
- 5.5.4.3 South Korea
- 5.5.4.4 India
- 5.5.4.5 Australia
- 5.5.4.6 Rest of Asia Pacific
- 5.5.5 Middle East
- 5.5.5.1 United Arab Emirates
- 5.5.5.2 Saudi Arabia
- 5.5.5.3 Turkey
- 5.5.5.4 Rest of Middle East
- 5.5.6 Africa
- 5.5.6.1 South Africa
- 5.5.6.2 Nigeria
- 5.5.6.3 Egypt
- 5.5.6.4 Rest of Africa
- 5.5.1 North America
6 COMPETITIVE LANDSCAPE
- 6.1 Market Concentration
- 6.2 Strategic Moves
- 6.3 Market Share Analysis
- 6.4 Company Profiles {(includes Global level Overview, Market level overview, Core Segments, Financials as available, Strategic Information, Market Rank/Share for key companies, Products and Services, and Recent Developments)}
- 6.4.1 Sandbox VR Inc.
- 6.4.2 Zero Latency Pty Ltd
- 6.4.3 Hologate GmbH
- 6.4.4 Dreamscape Immersive Inc.
- 6.4.5 VRstudios Inc.
- 6.4.6 Vertigo Games Holding B.V. (Springboard VR)
- 6.4.7 EXIT VR GmbH
- 6.4.8 Survios Inc.
- 6.4.9 Tyffon Inc.
- 6.4.10 Neurogaming Limited
- 6.4.11 Ctrl V Inc.
- 6.4.12 IMAX Corporation
- 6.4.13 Spaces LLC
- 6.4.14 Nomadic Inc.
- 6.4.15 The VOID LLC
- 6.4.16 HTC Corporation (Viveport Arcade)
- 6.4.17 Facebook Technologies LLC (Oculus VR)
- 6.4.18 Disney Parks, Experiences and Products Inc.
- 6.4.19 Pico Interactive Inc.
- 6.4.20 DPVR Co. Ltd.
7 MARKET OPPORTUNITIES AND FUTURE OUTLOOK
- 7.1 White-Space and Unmet-Need Assessment
 2026年全球皮质触觉虚拟实境手套市场报告2026年全球虚拟实境治疗硬体市场报告
 虚拟实境 (VR) 市场分析及预测(至 2035 年):按类型、产品类型、服务、技术、组件、应用、设备、最终用户、部署类型和解决方案划分
 教育领域的虚拟实境:市场占有率分析、产业趋势与统计、成长预测(2026-2031)
 虚拟实境(VR)全球市场规模、份额、趋势和成长分析报告(2026-2034)
 日本虚拟实境市场报告:按设备类型、技术、组件、应用和地区划分(2026-2034年)2026年全球虚拟实境设备市场报告
 虚拟实境在治疗领域的市场-全球产业规模、份额、趋势、机会及预测(按技术、设备、应用、地区和竞争格局划分,2021-2031年)零售业虚拟实境市场-全球产业规模、份额、趋势、机会、预测:硬体、软体相容性、类型、地区和竞争格局(2021-2031年)
 太空现实显示器市场按产品类型、技术、组件、应用、最终用户产业和分销管道划分,全球预测(2026-2032年)