


 |
市场调查报告书
商品编码
1906173
快递运输:市场占有率分析、产业趋势与统计、成长预测(2026-2031)Express Delivery - Market Share Analysis, Industry Trends & Statistics, Growth Forecasts (2026 - 2031) |
||||||
※ 本网页内容可能与最新版本有所差异。详细情况请与我们联繫。
2025年快递市场价值为2,553.5亿美元,预计到2031年将达到3,612.6亿美元,而2026年为2,704.7亿美元。
预计在预测期(2026-2031 年)内,复合年增长率将达到 5.92%。
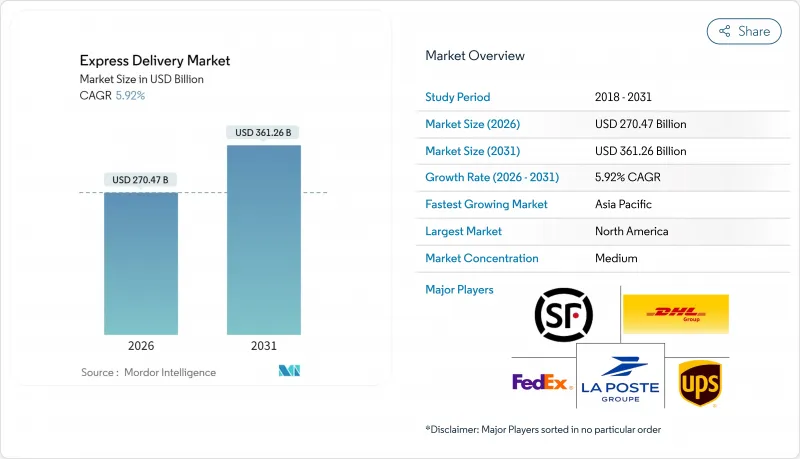
跨境电商活动活性化、数位化贸易通道的普及以及医疗低温运输需求的快速成长等因素正在巩固市场基础。同时,能源价格和人事费用的波动持续考验着业者的盈利。儘管网路规模仍然是关键的竞争优势,但对自动化、数据分析和替代性末端运输方式的技术投资,正为灵活的新参与企业在细分市场挑战现有企业创造机会。区域趋势仍在不断演变,北美凭藉着成熟的基础设施和消费者对加值服务的需求,占据最大市场份额;而亚太地区则在行动优先商务和数位支付普及的推动下,实现了最快的成长。
全球快递市场趋势与洞察
跨境电子商务导致需求快速成长
预计2025年至2030年,跨境小包裹吞吐量将以7.44%的复合年增长率成长,显着高于整体市场成长率,标誌着市场结构转型为国际采购。诸如美国墨加协定(USMCA)和区域全面经济伙伴关係协定(RCEP)等贸易协定简化了海关资料交换流程,简化了单证程序,并将平均清关时间缩短了约三分之一。主要快递公司建立的专用跨境枢纽作为多国分销网络的枢纽,实现了货物整合,从而在服务期望不断提高的情况下仍能维持利润率。国际小包裹的价格通常是国内小包裹的三到五倍,这为营运商提供了实现收入来源多元化的重要机会。对保税仓库、数位化清关平台和区域最后一公里合作的投资,进一步增强了能够同步全球库存流动的网路的竞争优势。
消费者对当日达和按需配送的期望日益提高
当日送达已从新事物变为必需品,尤其是在人口密度高的大都会圈,高效的配送路线更容易实现。亚马逊计划在2024年将业务拓展至美国90多个城市,加剧了市场竞争,迫使竞争对手透过扩展微型仓配中心和实现即时库存可见性来缩短订单到交付的周期。都市区路线优化演算法已将单件商品的配送成本降低了15%至20%,但这仅在配送密度超过一定阈值时才有效。高端、时效性强的需求与成本敏感、配送速度较慢的需求之间的日益分化,促使承运商加强市场细分策略,合理运转率车辆,并采用差异化收费系统。季节性促销活动带来的持续需求高峰,迫使承运商实施动态定价和预测性人员配置模型,以适应每小时的需求波动。
能源价格波动与人事费用上升
燃油成本通常占快递公司营运成本的15%至20%,因此任何价格波动都会立即影响收入。 2024年,地缘政治紧张局势导致原油供应趋紧,迫使联邦快递将燃油额外费用提高了12.5%。同时,劳动力短缺问题日益严重,导致北美和西欧地区的司机薪资上涨了8%至12%。电气化和路线规划软体虽然可以降低风险,但其投资回报期却长达数年。财务状况脆弱的中小型区域快递公司正在采取激进的定价策略以维持货运量,这进一步压缩了利润空间。持续的成本波动迫使快递公司重新设计其网络,整合干线,并在电网基础设施允许的情况下使用替代燃料。
细分市场分析
电子商务货运是快递市场的基础,预计到2025年将占总收入的32.55%,其货运量成长与促销活动密切相关,并有助于数据驱动的路线优化。即使在成熟地区,当日达服务的普及也推动了递送频率的提高,从而带动小包裹货运量持续保持两位数增长。
医疗保健产业对温控可追溯系统的依赖程度日益提高,预计2026年至2031年的复合年增长率将达到6.30%。快递业者正在整合检验的包装、冗余冷却系统和运输途中监控,以满足法规要求。製造商重视全程可视性,以最大限度地降低产品变质风险,并在必要时快速召回产品。这种协同效应正在提升快递产业在生命科学生态系统中的角色,使其从简单的承运商转变为策略供应链合作伙伴。
受高端跨境需求和海关摩擦减少的推动,国际货运预计将以7.31%的复合年增长率(2026-2031年)快速成长,超过国内货运。儘管地缘政治风险依然是观点,但拥有保税枢纽和海关专业知识的快递公司仍保持着定价权。到2025年,国内小包裹将占总收入的65.72%,具备规模经济优势,但由于竞争激烈和最后一公里人事费用上升,利润率将受到挤压。
国际贸易收入受益于贸易走廊的数位化倡议,这些倡议能够加快清关速度并实现即时追踪。跨境物流相关的快递市场规模预计将在预测期内持续成长,这将进一步凸显对灵活运力管理和双边航空货运协议的需求。
区域分析
预计到2025年,北美将占全球收入份额的35.12%,这反映了该地区较高的电子商务渗透率、完善的高速公路基础设施以及较高的可支配收入。纽约、洛杉矶和多伦多等高密度都会区拥有当日配送网络,并提供高价位服务。美国根据《美国墨加协定》(USMCA)支持跨境物流,确保关税稳定并简化海关程序。同时,加拿大的双语市场和墨西哥的加工出口走廊带来了多元化的货物组合。然而,人事费用上升和更严格的温室气体排放报告要求对近期盈利构成挑战。
预计亚太地区将引领全球经济成长,2026年至2031年间复合年增长率将达到7.45%,主要得益于行动钱包和社交电商平台开拓了新的消费群体。中国的小包裹密度远超过其他国家,而印度、印尼和越南也正透过奖励吸引商家,迅速扩大其市场份额。区域各国政府正积极推动一体化数位贸易框架,东协的单一窗口海关计画就是一个典型例证,该计画将合规货物的通关时间缩短至六小时以内。儘管基础设施瓶颈依然存在,但对智慧物流园区和区域机场的大力投资正在缓解运力缺口。
在统一关税制度和区域自由化推动下,短途跨境贸易蓬勃发展,欧洲经济维持稳定成长。儘管车辆电气化强制令和拥堵费上涨增加了营运成本,但早期采用者已受益于优先配送时段和企业客户对永续解决方案的偏好。东欧市场渗透率较低,成长空间巨大,收入成长和欧盟资金投入正在加速小包裹运输的使用。中东/非洲和南美洲市场规模虽小,但随着基础设施和金融科技的进步扩大了潜在市场,这些地区的成长率已达到个位数。长期前景取决于政治稳定、海关现代化以及连接区域城市与国际贸易路线的航空货运走廊的扩建。
其他福利:
- Excel格式的市场预测(ME)表
- 3个月的分析师支持
目录
第一章 引言
- 研究假设和市场定义
- 调查范围
第二章调查方法
第三章执行摘要
第四章 市场情势
- 市场概览
- 人口统计数据
- 按经济活动分類的GDP分配
- 按经济活动分類的GDP成长
- 通货膨胀
- 经济表现和公司概况
- 电子商务产业的趋势
- 製造业趋势
- 运输和仓储业的GDP
- 出口趋势
- 进口趋势
- 燃油价格
- 物流绩效
- 基础设施
- 法律规范
- 价值炼和通路分析
- 市场驱动因素
- 跨境电子商务成长推动了需求激增
- 消费者对当日达和按需配送的期望日益提高
- 扩大医疗用品运输与发展低温运输物流
- 中小企业数位化在新兴市场催生了新的B2C小包装物流流
- 数位贸易通道能够加快清关速度。
- 自动化、无人机和地面机器人正在彻底改变最后一公里配送方式。
- 市场限制
- 能源价格波动和劳动成本上升给盈利带来挑战。
- 复杂且不一致的国际航运法规造成了不确定性。
- 都市区中的零排放区和拥堵收费正在影响配送营运。
- 区域机场和分类中心的容量不足限制了成长。
- 市场创新
- 波特五力分析
- 新进入者的威胁
- 买方的议价能力
- 供应商的议价能力
- 替代品的威胁
- 竞争对手之间的竞争
第五章 市场规模与成长预测
- 目的地
- 国内的
- 国际的
- 运输重量
- 重型运输
- 轻型运输
- 中型运输
- 模型
- B2B
- B2C
- C2C
- 终端用户产业
- 电子商务
- 金融服务(BFSI)
- 卫生保健
- 製造业
- 一级产业
- 批发零售(线下)
- 其他的
- 交通工具
- 路
- 航空
- 其他的
- 地区
- 亚太地区
- 澳洲
- 中国
- 印度
- 印尼
- 日本
- 马来西亚
- 菲律宾
- 泰国
- 越南
- 亚太其他地区
- 欧洲
- 法国
- 德国
- 义大利
- 荷兰
- 西班牙
- 英国
- 北欧国家
- 中欧和东欧(CEE)
- 其他欧洲地区
- 中东和非洲
- 卡达
- 沙乌地阿拉伯
- 阿拉伯聯合大公国
- 埃及
- 奈及利亚
- 南非
- 其他中东和非洲地区
- 北美洲
- 加拿大
- 墨西哥
- 美国
- 北美其他地区
- 南美洲
- 阿根廷
- 巴西
- 智利
- 南美洲其他地区
- 亚太地区
第六章 竞争情势
- 市场集中度
- 关键策略倡议公司
- 市占率分析
- 公司简介
- Aramex PJSC
- Australian Postal Corporation
- Canada Post Corporation(Including Purolator, Inc.)
- China Post
- CJ Logistics
- Delhivery, Ltd.
- DHL Group
- Emirates Post Group
- FedEx
- InPost Sp. z oo
- International Distribution Services PLC
- Japan Post Holdings Co., Ltd.
- JD.com, Inc.(Including JD Logistics, Inc.)
- Korea Post
- La Poste Group(Including DPD Group)
- Nippon Express Holdings
- Osterreichische Post AG(Austrian Post)
- Poste Italiane
- PostNL NV
- SF Holding Co., Ltd.(Including KEX-SF)
- SG Holdings Co., Ltd.
- STO Express Co., Ltd.
- United Parcel Service of America, Inc.(UPS)
- Yamato Holdings Co., Ltd.
第七章 市场机会与未来展望
The Express Delivery Market was valued at USD 255.35 billion in 2025 and estimated to grow from USD 270.47 billion in 2026 to reach USD 361.26 billion by 2031, at a CAGR of 5.92% during the forecast period (2026-2031).
Intensifying cross-border e-commerce activity, rising adoption of digital trade corridors, and accelerating demand for healthcare cold chains are strengthening fundamentals, even as volatile energy prices and labor costs test operator profitability. Network scale remains the primary competitive moat, yet technology investments in automation, data analytics, and alternative last-mile modes are allowing agile entrants to challenge incumbents in niche pockets. Regional dynamics continue to evolve: North America commands the largest share due to mature infrastructure and consumer premium-service appetite, while Asia-Pacific registers the fastest growth on the back of mobile-first commerce and digital payment penetration.
Global Express Delivery Market Trends and Insights
Surging Demand From Cross-Border E-Commerce
Cross-border parcel volumes are climbing at a 7.44% CAGR (2025-2030), comfortably outpacing overall market growth and signaling a structural pivot toward international sourcing. Trade agreements such as USMCA and RCEP are streamlining customs data exchange and trimming paperwork, reducing average clearance times by almost one-third. Dedicated cross-border hubs established by major express carriers now anchor multi-country distribution and allow shipment consolidation that preserves margins despite higher service expectations. International parcels typically command prices three to five times domestic equivalents, providing operators with critical earnings diversity. Investment in bonded warehouses, digital customs platforms, and localized last-mile collaborations further widens the moat for networks able to synchronize global inventory flows.
Growing Consumer Expectation for Same-Day and On-Demand Delivery
Same-day fulfillment has shifted from novelty to a hygiene factor, especially in metropolitan catchments where population density supports route density economics. Amazon's 2024 roll-out to more than 90 U.S. cities accelerated competitive responses, forcing rivals to compress order-to-delivery cycles through micro-fulfillment build-outs and real-time inventory visibility. Urban route-optimization algorithms are trimming per-package costs 15-20%, but only when shipment density crosses critical thresholds. The bifurcation of premium time-sensitive demand and value-focused slower tiers enables carriers to sharpen their segmentation strategy, charging differentiated tariffs while rationalizing fleet utilization. Continuous demand peaks around seasonal promotions are pressuring operators to adopt dynamic pricing and predictive staffing models that align capacity with hourly volume swings.
Volatile Energy Prices and Rising Workforce Costs
Fuel typically constitutes 15-20% of an express carrier's operating cost base; hence, a sudden spike reverberates immediately through earnings. In 2024, FedEx lifted its fuel surcharge by 12.5% after geopolitical tensions tightened crude supply. Concurrent talent scarcity pushed driver wages up 8-12% across North America and Western Europe. Electrification and route-planning software mitigate exposure yet require multi-year payback. Smaller regional players lacking balance-sheet depth resort to aggressive pricing to retain volume, eroding margins further. Persistent cost volatility compels network redesign toward consolidation of linehaul legs and greater use of alternative fuels where grid infrastructure permits.
Other drivers and restraints analyzed in the detailed report include:
- Expanding Healthcare Shipments and Growing Cold-Chain Logistics
- SME Digitization Unlocking New B2C Parcel Flows in Emerging Markets
- Complex and Inconsistent International Shipping Rules
For complete list of drivers and restraints, kindly check the Table Of Contents.
Segment Analysis
E-commerce shipments remain the bedrock of the express delivery market with a revenue share of 32.55% in 2025, supplying predictable volume surges tied to promotional calendars and facilitating data-driven route optimization. Even mature geographies continue to register double-digit parcel growth as same-day propositions unlock incremental frequency.
Healthcare's 6.30% CAGR between 2026-2031 showcases mounting reliance on temperature-controlled, track-and-trace chains of custody. Express carriers are integrating validated packaging, redundant cooling systems, and in-flight monitoring to uphold regulatory obligations. Manufacturers value door-to-door visibility that minimizes spoilage risk and speeds product recalls when necessary. This synergy elevates the express delivery industry's role from mere carrier to strategic supply-chain partner within life-sciences ecosystems.
International shipments are expected to grow faster at a 7.31% CAGR (2026-2031), compared to domestic traffic, fueled by premium cross-border demand and reduced customs friction. Express carriers with bonded hubs and brokerage expertise command pricing power, even as geopolitical risks remain a watch point. Domestic parcels with a revenue share of 65.72% in 2025, while delivering scale economies, face margin compression from intense competition and rising last-mile labor costs.
International revenue benefits from trade corridor digitization initiatives that cut clearance times and enable real-time tracking. The express delivery market size tied to cross-border flows is on track to widen its contribution over the forecast horizon, reinforcing the need for agile capacity management and bilateral air-freight agreements.
The Express Delivery Market Report is Segmented by Destination (Domestic and International), Shipment Weight (Heavy Weight Shipments and More), Model (Business-To-Business (B2B) and More), End User Industry (E-Commerce, Healthcare, and Others), Mode of Transport (Road, Air, and Others), and Geography (Asia-Pacific, Europe, Middle East and Africa, and More). The Market Forecasts are Provided in Terms of Value (USD).
Geography Analysis
North America's 35.12% revenue share in 2025 underscores the region's advanced e-commerce penetration, expansive highway infrastructure, and high discretionary income. Dense urban agglomerations such as New York, Los Angeles, and Toronto sustain same-day networks that command premium tariffs. The United States anchors cross-border flows under the USMCA, ensuring tariff stability and simplified customs interfaces, while Canada's bilingual market and Mexico's maquiladora corridors contribute diversified volume mixes. Labor cost inflation and stricter greenhouse-gas reporting pose immediate profitability challenges.
Asia-Pacific is expected to lead global growth at a 7.45% CAGR between 2026-2031 as mobile wallets and social-commerce platforms unlock incremental shopper cohorts. China's parcel density dwarfs all peers, yet India, Indonesia, and Vietnam are scaling rapidly through merchant onboarding incentives. Regional governments promote integrated digital-trade frameworks, exemplified by ASEAN's single-window customs blueprint that trims clearance to under six hours on compliant shipments. Infrastructure bottlenecks persist, but aggressive investment in smart logistics parks and secondary-city airports is bridging capacity gaps.
Europe maintains steady expansion supported by harmonized customs codes and short-haul cross-border commerce facilitated by open internal borders. Fleet electrification mandates and escalating congestion charges elevate operating costs but also reward early adopters via preferred delivery slots and corporate customer preference for sustainable options. Eastern European markets offer under-penetrated growth avenues where rising incomes and EU funding accelerate parcel adoption. Middle East & Africa and South America collectively represent a smaller share yet deliver high-single-digit growth as infrastructure and fintech advances broaden serviceable addressable markets. Long-run prospects hinge on political stability, customs modernization, and expanded air-cargo corridors connecting secondary cities to global trade lanes.
- Aramex PJSC
- Australian Postal Corporation
- Canada Post Corporation (Including Purolator, Inc.)
- China Post
- CJ Logistics
- Delhivery, Ltd.
- DHL Group
- Emirates Post Group
- FedEx
- InPost Sp. z o.o.
- International Distribution Services PLC
- Japan Post Holdings Co., Ltd.
- JD.com, Inc. (Including JD Logistics, Inc.)
- Korea Post
- La Poste Group (Including DPD Group)
- Nippon Express Holdings
- Osterreichische Post AG (Austrian Post)
- Poste Italiane
- PostNL N.V.
- SF Holding Co., Ltd. (Including KEX-SF)
- SG Holdings Co., Ltd.
- STO Express Co., Ltd.
- United Parcel Service of America, Inc. (UPS)
- Yamato Holdings Co., Ltd.
Additional Benefits:
- The market estimate (ME) sheet in Excel format
- 3 months of analyst support
TABLE OF CONTENTS
1 Introduction
- 1.1 Study Assumptions and Market Definition
- 1.2 Scope of the Study
2 Research Methodology
3 Executive Summary
4 Market Landscape
- 4.1 Market Overview
- 4.2 Demographics
- 4.3 GDP Distribution by Economic Activity
- 4.4 GDP Growth by Economic Activity
- 4.5 Inflation
- 4.6 Economic Performance and Profile
- 4.6.1 Trends in E-Commerce Industry
- 4.6.2 Trends in Manufacturing Industry
- 4.7 Transport and Storage Sector GDP
- 4.8 Export Trends
- 4.9 Import Trends
- 4.10 Fuel Price
- 4.11 Logistics Performance
- 4.12 Infrastructure
- 4.13 Regulatory Framework
- 4.14 Value Chain and Distribution Channel Analysis
- 4.15 Market Drivers
- 4.15.1 Surging Demand Driven by Cross-Border E-Commerce Growth
- 4.15.2 Growing Consumer Expectation for Same-Day and On-Demand Delivery
- 4.15.3 Expanding Healthcare Shipments and Growing Cold-Chain Logistics
- 4.15.4 SME Digitization Unlocking New B2C Parcel Flows in Emerging Markets
- 4.15.5 Faster Border Clearance Enabled by Digital Trade Corridors
- 4.15.6 Automation, Drones, and Ground Robots Revolutionizing Last-Mile Delivery
- 4.16 Market Restraints
- 4.16.1 Volatile Energy Prices and Rising Workforce Costs Challenge Profitability
- 4.16.2 Complex and Inconsistent International Shipping Rules Create Uncertainty
- 4.16.3 Urban Zero-Emission Zones and Congestion Charges Impact Delivery Operations
- 4.16.4 Capacity Bottlenecks at Secondary Airports and Sort Centers Restrict Growth
- 4.17 Technology Innovations in the Market
- 4.18 Porter's Five Forces Analysis
- 4.18.1 Threat of New Entrants
- 4.18.2 Bargaining Power of Buyers
- 4.18.3 Bargaining Power of Suppliers
- 4.18.4 Threat of Substitutes
- 4.18.5 Competitive Rivalry
5 Market Size and Growth Forecasts (Value, USD)
- 5.1 Destination
- 5.1.1 Domestic
- 5.1.2 International
- 5.2 Shipment Weight
- 5.2.1 Heavy Weight Shipments
- 5.2.2 Light Weight Shipments
- 5.2.3 Medium Weight Shipments
- 5.3 Model
- 5.3.1 Business-to-Business (B2B)
- 5.3.2 Business-to-Consumer (B2C)
- 5.3.3 Consumer-to-Consumer (C2C)
- 5.4 End User Industry
- 5.4.1 E-Commerce
- 5.4.2 Financial Services (BFSI)
- 5.4.3 Healthcare
- 5.4.4 Manufacturing
- 5.4.5 Primary Industry
- 5.4.6 Wholesale and Retail Trade (Offline)
- 5.4.7 Others
- 5.5 Mode of Transport
- 5.5.1 Road
- 5.5.2 Air
- 5.5.3 Others
- 5.6 Geography
- 5.6.1 Asia-Pacific
- 5.6.1.1 Australia
- 5.6.1.2 China
- 5.6.1.3 India
- 5.6.1.4 Indonesia
- 5.6.1.5 Japan
- 5.6.1.6 Malaysia
- 5.6.1.7 Philippines
- 5.6.1.8 Thailand
- 5.6.1.9 Vietnam
- 5.6.1.10 Rest of Asia-Pacific
- 5.6.2 Europe
- 5.6.2.1 France
- 5.6.2.2 Germany
- 5.6.2.3 Italy
- 5.6.2.4 Netherlands
- 5.6.2.5 Spain
- 5.6.2.6 United Kingdom
- 5.6.2.7 Nordics
- 5.6.2.8 Central and Eastern Europe (CEE)
- 5.6.2.9 Rest of Europe
- 5.6.3 Middle East and Africa
- 5.6.3.1 Qatar
- 5.6.3.2 Saudi Arabia
- 5.6.3.3 United Arab Emirates
- 5.6.3.4 Egypt
- 5.6.3.5 Nigeria
- 5.6.3.6 South Africa
- 5.6.3.7 Rest of Middle East and Africa
- 5.6.4 North America
- 5.6.4.1 Canada
- 5.6.4.2 Mexico
- 5.6.4.3 United States
- 5.6.4.4 Rest of North America
- 5.6.5 South America
- 5.6.5.1 Argentina
- 5.6.5.2 Brazil
- 5.6.5.3 Chile
- 5.6.5.4 Rest of South America
- 5.6.1 Asia-Pacific
6 Competitive Landscape
- 6.1 Market Concentration
- 6.2 Key Strategic Moves
- 6.3 Market Share Analysis
- 6.4 Company Profiles (Includes Global Level Overview, Market Level Overview, Core Segments, Financials as Available, Strategic Information, Market Rank/Share for Key Companies, Products and Services, and Recent Developments)
- 6.4.1 Aramex PJSC
- 6.4.2 Australian Postal Corporation
- 6.4.3 Canada Post Corporation (Including Purolator, Inc.)
- 6.4.4 China Post
- 6.4.5 CJ Logistics
- 6.4.6 Delhivery, Ltd.
- 6.4.7 DHL Group
- 6.4.8 Emirates Post Group
- 6.4.9 FedEx
- 6.4.10 InPost Sp. z o.o.
- 6.4.11 International Distribution Services PLC
- 6.4.12 Japan Post Holdings Co., Ltd.
- 6.4.13 JD.com, Inc. (Including JD Logistics, Inc.)
- 6.4.14 Korea Post
- 6.4.15 La Poste Group (Including DPD Group)
- 6.4.16 Nippon Express Holdings
- 6.4.17 Osterreichische Post AG (Austrian Post)
- 6.4.18 Poste Italiane
- 6.4.19 PostNL N.V.
- 6.4.20 SF Holding Co., Ltd. (Including KEX-SF)
- 6.4.21 SG Holdings Co., Ltd.
- 6.4.22 STO Express Co., Ltd.
- 6.4.23 United Parcel Service of America, Inc. (UPS)
- 6.4.24 Yamato Holdings Co., Ltd.
7 Market Opportunities and Future Outlook
- 7.1 White-space and Unmet-need Assessment


