


 |
市场调查报告书
商品编码
1906910
PET包装:市场占有率分析、产业趋势与统计、成长预测(2026-2031年)PET Packaging - Market Share Analysis, Industry Trends & Statistics, Growth Forecasts (2026 - 2031) |
||||||
※ 本网页内容可能与最新版本有所差异。详细情况请与我们联繫。
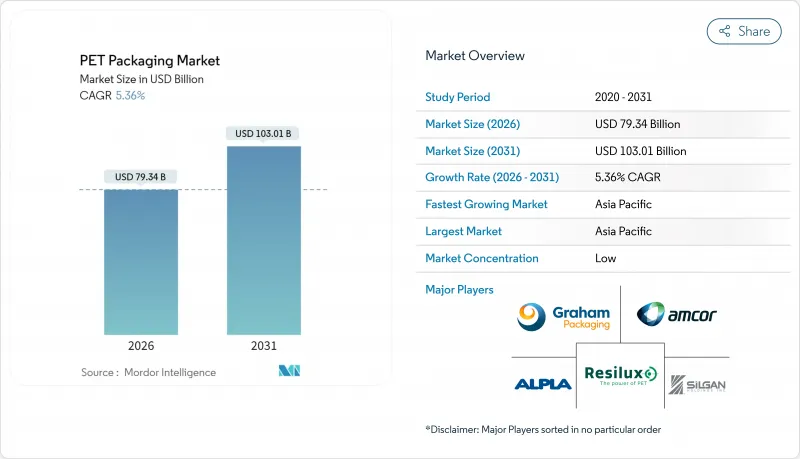
2025年PET包装市场价值为753亿美元,预计2031年将达到1,030.1亿美元,高于2026年的793.4亿美元。
预计在预测期(2026-2031 年)内,复合年增长率将达到 5.36%。
受饮料、食品和医药行业稳定需求的推动,儘管面临永续性的可持续发展压力,PET包装市场仍保持着稳步增长的势头。强制使用再生材料的法规、不断增长的电子商务交易量以及化学回收技术的进步,共同巩固了PET的市场地位。品牌所有者对最低再生PET标准的承诺,推动了对回收能力的大规模投资,而更轻的包装则降低了物流排放和成本。同时,原生树脂价格的波动以及各地不同的塑胶製品禁令,凸显了建造能够平衡原生材料和再生材料的一体化供应链的重要性。
全球PET包装市场趋势与洞察
高可回收性和轻量化优势
PET可重复进行机械回收,且物理性质不会显着劣化,因此在循环利用方面优于其他材料。其密度比玻璃低约40%,从而降低了区域和跨境物流的排放和成本。化学解聚装置,例如利安德巴塞尔的德国工厂,可回收纯度超过95%的单体,进而强化闭合迴路供应链。随着化学和机械回收方式的不断扩展,供应安全性得到提升,使PET包装市场拥有其他材料无法比拟的成本优势。因此,品牌所有者将PET视为实现气候行动和循环目标的可行途径,而无需进行昂贵的生产线改造。
欧盟和美国强制要求使用食品级rPET
欧盟法规2025/40要求饮料瓶到2030年必须含有30%的再生材料,到2040年必须含有65%的再生材料,这将大幅收紧本地再生PET的供应。美国食品药物管理局(FDA)在21 CFR 177.1630中的指导意见也提供了类似的明确信息,允许加工商对用于食品接触应用的特定回收工艺进行认证。跨国饮料製造商正在设定更严格的中期目标,从而推动对高品质再生PET(rPET)的需求和溢价。这种供需缺口正在推动PET包装市场价值链中新的和现有的回收计划。投资者开始将PET回收能力视为一种策略资产,而不仅仅是一项环境义务。
关于一次性塑胶袋的新规定
澳洲各州和加拿大各省已开始禁止使用某些PET包装袋和容器。虽然大多数饮料瓶仍不受此限制,但此举造成了不确定性,并可能导致研发支出转向可重复填充包装。在调味品包装袋等细分应用领域,加工商正在探索替代基材或专注于大包装多份装产品,以规避监管审查,这限制了该细分市场在更广泛的PET包装市场中的成长。
细分市场分析
到2025年,硬质PET将占PET包装总收入的83.12%,凭藉其在碳酸饮料瓶罐和保存食品包装领域的应用,继续保持其在PET包装市场的地位。这项优势源自于其与全球灌装生产线的兼容性、优异的阻隔性能以及成本效益高的供应链。然而,软包装PET产品正在快速成长,由于多层薄膜的应用,其复合年增长率(CAGR)达到6.08%。这些多层薄膜不仅具有高氧气阻隔性,还能减少40-60%的材料用量。品牌商正利用软包装来减轻运输重量,并满足电商对节省空间包装形式日益增长的需求。
受果汁和乳製品生产线对热灌装袋的广泛应用所推动,柔软性PET市场规模正处于加速成长阶段。网路零售商青睐这种包装,因为它能降低运输过程中的破损风险,同时也能维持与硬质容器相同的品质。随着回收系统开始接受单一材料PET包装袋,预计回收障碍将有所缓解,从而进一步增强该领域的长期发展前景。
到2025年,瓶罐将占总收入的75.74%,反映出它们在饮用水、软性饮料、食用油和个人护理液体等领域的广泛应用。高速生产线、标准化瓶盖以及消费者强大的认知度,使它们得以保持主导地位。儘管在能量饮料领域面临铝罐的竞争,在高端酒类领域面临玻璃瓶的竞争, 宝特瓶仍占据着较大的市场份额。目前的研发重点是开发轻质瓶坯,以在不牺牲瓶身强度的前提下,减少每个瓶子的树脂用量。
儘管目前袋装和小袋规模较小,但其成长率预计将达到最高,复合年增长率 (CAGR) 为 6.33%。单份家用清洁剂、婴儿优格和便携饮料都在过渡到可重复密封的袋装产品。透明 PET 层满足了品牌对产品可见度的需求,而吸嘴盖则方便倾倒。澳洲和加拿大部分地区对一次性袋装产品的监管更加严格,限制了这些地区的成长,但亚洲和拉丁美洲的扩张弥补了这一不足。
区域分析
亚太地区预计到2025年将占全球收入的38.55%,并以7.42%的复合年增长率实现最快增长,这主要得益于中阶消费的增长和本地产能的扩大。来自一体化石化联合企业的低成本树脂供应,以及政府为吸引外资投资回收产能所做的努力,正在推动成长。在印尼,Indorama Ventures、Ganesha Ecopet和PT Amandina的合资企业确保为跨国饮料品牌提供高品质的瓶装再生PET(rPET)供应。儘管一些国家正在讨论一次性塑胶瓶禁令,但宝特瓶通常不受近期法规的限制,这有利于其短期成长。
欧洲正通过强制性再生材料含量标准和严格的食品接触法规,对区域外市场施加监管影响。在莱昂内尔·贝塞尔和伊士曼等公司化学回收工厂产能增加的推动下,欧洲PET包装市场正稳步扩张。高分拣率和押金返还计划支持瓶到瓶回收,使品牌能够实现其2030年目标。高品质rPET的价格为一体化营运商提供了可观的收入来源。
北美拥有成熟的填充网路和完善的上门回收系统,但各州对一次性包装的监管规定不尽相同。 FDA的指导意见简化了再生PET的核准,加速了其在饮用水和碳酸饮料生产线上的应用。南美以及中东和非洲地区的回收基础设施相对滞后,但随着人口成长和都市化进程推动包装商品需求,这些地区仍有很大的发展空间。加工商越来越多地选择PET,因为其他替代材料需要更冷的低温运输和耐刮擦涂层,推高了成本。
其他福利:
- Excel格式的市场预测(ME)表
- 分析师支持(3个月)
目录
第一章 引言
- 研究假设和市场定义
- 调查范围
第二章调查方法
第三章执行摘要
第四章 市场情势
- 市场概览
- 市场驱动因素
- 高可回收性和轻量化优势
- 欧盟和美国强制要求使用食品级rPET
- 在热灌装线和碳酸饮料生产线中扩大应用
- 电子商务包装的成长
- 化学回收基础建设
- 品牌所有者致力于实现 25-50% 的 rPET 含量
- 市场限制
- 原生PET树脂价格波动
- 关于一次性塑胶袋的新规定
- 瓶装到瓶装循环供应缺口
- 消费者向「无塑胶」观念的转变
- 产业价值链分析
- 监管环境
- 技术展望
- 波特五力分析
- 新进入者的威胁
- 买方的议价能力
- 供应商的议价能力
- 替代品的威胁
- 竞争对手之间的竞争
- 宏观经济因素如何影响市场
第五章 市场规模与成长预测
- 按包装类型
- 硬质PET包装市场
- 柔性PET包装市场
- 依产品类型
- 瓶子和罐子
- 小袋和包装袋
- 托盘和翻盖式容器
- 盖子、瓶盖和封装件
- 预成型件和其他产品类型
- 依树脂等级
- 原生PET(vPET)
- 再生PET(rPET)
- 按最终用户行业划分
- 食品/饮料
- 製药
- 个人护理和化妆品
- 家用
- 工业产品
- 其他终端用户产业
- 按地区
- 北美洲
- 美国
- 加拿大
- 墨西哥
- 欧洲
- 德国
- 英国
- 法国
- 义大利
- 西班牙
- 其他欧洲地区
- 亚太地区
- 中国
- 日本
- 印度
- 韩国
- 澳洲
- 泰国
- 马来西亚
- 亚太其他地区
- 南美洲
- 巴西
- 阿根廷
- 南美洲其他地区
- 中东和非洲
- 中东
- 阿拉伯聯合大公国
- 沙乌地阿拉伯
- 土耳其
- 其他中东地区
- 非洲
- 南非
- 奈及利亚
- 其他非洲地区
- 中东
- 北美洲
第六章 竞争情势
- 市场集中度
- 策略趋势
- 市占率分析
- 公司简介
- Amcor plc
- Resilux NV
- Gerresheimer AG
- ALPLA Werke Alwin Lehner GmbH and Co KG
- Silgan Holdings Inc.
- Graham Packaging Company LP
- GTX Hanex Plastic Sp. z oo
- Dunmore Corporation
- Comar LLC
- TOPPAN Holdings Inc.
- Huhtamaki Oyj
- Nampak Ltd.
- Plastipak Holdings Inc.
- ACTI PACK SAS
- RETAL Industries Ltd
- Sealed Air Corporation
- Pactiv Evergreen Inc.
- Uflex Ltd.
- Zhongfu Industrial Co. Ltd.
- Novapet SA
第七章 市场机会与未来展望
The PET packaging market was valued at USD 75.30 billion in 2025 and estimated to grow from USD 79.34 billion in 2026 to reach USD 103.01 billion by 2031, at a CAGR of 5.36% during the forecast period (2026-2031).
Consistent demand from beverages, food, and pharmaceuticals keeps the PET packaging market on a steady growth path even as sustainability pressures intensify. Regulatory mandates that require recycled content, rising e-commerce volumes, and advances in chemical recycling all reinforce PET's entrenched position. Brand-owner commitments to minimum recycled PET thresholds are catalyzing large-scale investments in recycling capacity, while lightweighting gains lower logistics emissions and costs. Meanwhile, volatile virgin resin prices and a patchwork of single-use plastic bans place a premium on integrated supply chains able to balance virgin and recycled inputs.
Global PET Packaging Market Trends and Insights
High Recyclability and Light-Weighting Advantage
PET allows repeated mechanical recycling without substantial property loss, which gives it a circular edge over rival substrates. Its density is roughly 40% lower than glass, cutting freight emissions and costs in regional and cross-border logistics. Chemical depolymerization plants such as LyondellBasell's German site reclaim 95%-plus pure monomers, reinforcing closed-loop supply chains. As both chemical and mechanical recycling options scale, supply stability improves, and the PET packaging market secures a cost advantage that competing materials struggle to match. Brand owners thus view PET as a pragmatic path to meet climate and circularity goals without costly line retrofits.
Food-Grade rPET Mandates in EU and US
Regulation (EU) 2025/40 compels beverage bottles to carry 30% recycled content by 2030 and 65% by 2040, instantly tightening regional rPET supply. FDA guidance under 21 CFR 177.1630 offers parallel clarity, allowing converters to qualify specific recycling processes for food contact. Multinational beverage firms have pledged even steeper interim targets, pulling demand forward and raising premiums for high-quality rPET. The resulting supply-demand gap is spurring green-field and brown-field recycling projects across the PET packaging market value chain. Investors now see PET recycling capacity as a strategic asset rather than an environmental obligation.
Emerging Plastic Bans on Single-Use Sachets
Australia's states and Canadian provinces have begun banning certain PET sachets and small containers. Although most beverage bottles remain exempt, the policy trend seeds uncertainty that may shift R&D spending toward refillable formats. For niche applications such as condiment sachets, converters now weigh alternate substrates or concentrate on larger multi-serve packs to avoid regulatory scrutiny, tempering segment growth within the broader PET packaging market.
Other drivers and restraints analyzed in the detailed report include:
- Increased Adoption in Hot-Fill and CSD Lines
- Deployment of Chemical Recycling Infrastructure
- Bottle-to-Bottle Loop Supply Gap
For complete list of drivers and restraints, kindly check the Table Of Contents.
Segment Analysis
Rigid PET commanded 83.12% of 2025 revenue and continues to anchor the PET packaging market thanks to bottles and jars in carbonated drinks and shelf-stable foods. This dominance is rooted in global filling-line compatibility, strong barrier performance, and cost-efficient supply chains. However, flexible PET options are scaling quickly, achieving 6.08% CAGR as converters adopt multilayer films with high oxygen barriers and 40-60% lower material use. Brand owners leverage flexible packs to cut shipping weight and adapt to e-commerce demand spikes that favor space-efficient formats.
The PET packaging market size for flexible formats is on an accelerating trajectory as hot-fill capable pouches enter juice and dairy lines. Smaller transportation footprints and lower breakage risk appeal to online retailers, while barrier films keep quality on par with rigid containers. As recycling systems begin accepting mono-material PET pouches, collection hurdles are projected to ease, which strengthens the long-term outlook for this segment.
Bottles and jars held 75.74% of 2025 revenue, reflecting their ubiquity across water, soft drinks, edible oils, and personal-care liquids. High line speeds, standardized closures, and consumer familiarity sustain leadership. The PET packaging market share for bottles remains sizable despite competition from aluminum in energy drinks and glass in premium spirits. R&D now targets lightweight preforms that trim resin usage per bottle without compromising top-load strength.
Pouches and sachets, though smaller today, exhibit the highest growth at 6.33% CAGR. Unit-dose household cleaners, toddler yogurts, and on-the-go beverages all migrate toward resealable pouches. Transparent PET layers satisfy brand demands for product visibility, while spouted caps enable convenient pouring. Regulatory scrutiny of single-use sachets in parts of Australia and Canada tempers growth in those regions but is outweighed by expansion in Asia and Latin America.
The PET Packaging Market Report is Segmented by Packaging Format (Rigid PET Packaging, and Flexible PET Packaging), Product Type (Bottles and Jars, Pouches and Sachets, Trays and Clamshells, and More), Resin Grade (Virgin PET, and Recycled PET), End-User Industry (Food and Beverage, Pharmaceuticals, Personal Care and Cosmetics, and More), and Geography. The Market Forecasts are Provided in Terms of Value (USD).
Geography Analysis
Asia-Pacific captured 38.55% of 2025 revenue and is expanding fastest at 7.42% CAGR, fueled by rising middle-class spending and local manufacturing scale. Integrated petrochemical complexes deliver low-cost resin, while governments court foreign investment in recycling capacity. Projects such as Indorama Ventures' venture with Ganesha Ecopet and PT Amandina in Indonesia guarantee bottle-to-bottle quality rPET for multinational beverage brands. Although some countries debate single-use bans, PET bottles usually remain outside immediate regulatory targets, preserving short-term growth.
Europe wields regulatory influence beyond its borders through mandatory recycled-content quotas and strict food-contact rules. The PET packaging market size in Europe steadily climbs as chemical recycling plants from LyondellBasell and Eastman augment supply. High sorting rates and deposit-return schemes underpin bottle-to-bottle loops that enable brands to meet 2030 targets. Premium rPET pricing generates attractive returns for integrated players.
North America hosts mature filler networks and a robust curbside collection system, but faces divergent state-level regulations on single-use packaging. FDA guidance simplifies rPET approvals, aiding adoption in water and carbonated drink lines. South America and the Middle East & Africa trail in collection infrastructure, yet present upside as population growth and urbanization accelerate packaged goods demand. Converters gravitate toward PET because alternative substrates require colder chains or scratch-resistant finishes that raise costs.
- Amcor plc
- Resilux NV
- Gerresheimer AG
- ALPLA Werke Alwin Lehner GmbH and Co KG
- Silgan Holdings Inc.
- Graham Packaging Company LP
- GTX Hanex Plastic Sp. z o.o.
- Dunmore Corporation
- Comar LLC
- TOPPAN Holdings Inc.
- Huhtamaki Oyj
- Nampak Ltd.
- Plastipak Holdings Inc.
- ACTI PACK S.A.S
- RETAL Industries Ltd
- Sealed Air Corporation
- Pactiv Evergreen Inc.
- Uflex Ltd.
- Zhongfu Industrial Co. Ltd.
- Novapet S.A.
Additional Benefits:
- The market estimate (ME) sheet in Excel format
- 3 months of analyst support
TABLE OF CONTENTS
1 INTRODUCTION
- 1.1 Study Assumptions and Market Definition
- 1.2 Scope of the Study
2 RESEARCH METHODOLOGY
3 EXECUTIVE SUMMARY
4 MARKET LANDSCAPE
- 4.1 Market Overview
- 4.2 Market Drivers
- 4.2.1 High Recyclability and Light-Weighting Advantage
- 4.2.2 Food-Grade rPET Mandates in EU and US
- 4.2.3 Increased Adoption in Hot-Fill and CSD Lines
- 4.2.4 Growth of E-Commerce Ready Packaging Formats
- 4.2.5 Deployment of Chemical Recycling Infrastructure
- 4.2.6 Brand-Owner Commitments to 25-50% rPET Content
- 4.3 Market Restraints
- 4.3.1 Volatility in Virgin PET Resin Prices
- 4.3.2 Emerging Plastic Bans on Single-Use Sachets
- 4.3.3 Bottle-to-Bottle Loop Supply Gap
- 4.3.4 Consumer Perception Shift Toward "Plastic-Free"
- 4.4 Industry Value Chain Analysis
- 4.5 Regulatory Landscape
- 4.6 Technological Outlook
- 4.7 Porter's Five Forces Analysis
- 4.7.1 Threat of New Entrants
- 4.7.2 Bargaining Power of Buyers
- 4.7.3 Bargaining Power of Suppliers
- 4.7.4 Threat of Substitute Products
- 4.7.5 Intensity of Competitive Rivalry
- 4.8 Impact of Macroeconomic Factors on the Market
5 MARKET SIZE AND GROWTH FORECASTS (VALUE)
- 5.1 By Packaging Format
- 5.1.1 Rigid PET Packaging
- 5.1.2 Flexible PET Packaging
- 5.2 By Product Type
- 5.2.1 Bottles and Jars
- 5.2.2 Pouches and Sachets
- 5.2.3 Trays and Clamshells
- 5.2.4 Lids-Caps and Closures
- 5.2.5 Preforms and Other Product Types
- 5.3 By Resin Grade
- 5.3.1 Virgin PET (vPET)
- 5.3.2 Recycled PET (rPET)
- 5.4 By End-User Industry
- 5.4.1 Food and Beverage
- 5.4.2 Pharmaceuticals
- 5.4.3 Personal Care and Cosmetics
- 5.4.4 Household
- 5.4.5 Industrial Goods
- 5.4.6 Other End-User Industries
- 5.5 By Geography
- 5.5.1 North America
- 5.5.1.1 United States
- 5.5.1.2 Canada
- 5.5.1.3 Mexico
- 5.5.2 Europe
- 5.5.2.1 Germany
- 5.5.2.2 United Kingdom
- 5.5.2.3 France
- 5.5.2.4 Italy
- 5.5.2.5 Spain
- 5.5.2.6 Rest of Europe
- 5.5.3 Asia-Pacific
- 5.5.3.1 China
- 5.5.3.2 Japan
- 5.5.3.3 India
- 5.5.3.4 South Korea
- 5.5.3.5 Australia
- 5.5.3.6 Thailand
- 5.5.3.7 Malaysia
- 5.5.3.8 Rest of Asia-Pacific
- 5.5.4 South America
- 5.5.4.1 Brazil
- 5.5.4.2 Argentina
- 5.5.4.3 Rest of South America
- 5.5.5 Middle East and Africa
- 5.5.5.1 Middle East
- 5.5.5.1.1 United Arab Emirates
- 5.5.5.1.2 Saudi Arabia
- 5.5.5.1.3 Turkey
- 5.5.5.1.4 Rest of Middle East
- 5.5.5.2 Africa
- 5.5.5.2.1 South Africa
- 5.5.5.2.2 Nigeria
- 5.5.5.2.3 Rest of Africa
- 5.5.5.1 Middle East
- 5.5.1 North America
6 COMPETITIVE LANDSCAPE
- 6.1 Market Concentration
- 6.2 Strategic Moves
- 6.3 Market Share Analysis
- 6.4 Company Profiles (includes Global level Overview, Market level overview, Core Segments, Financials as available, Strategic Information, Market Rank/Share for key companies, Products and Services, and Recent Developments)
- 6.4.1 Amcor plc
- 6.4.2 Resilux NV
- 6.4.3 Gerresheimer AG
- 6.4.4 ALPLA Werke Alwin Lehner GmbH and Co KG
- 6.4.5 Silgan Holdings Inc.
- 6.4.6 Graham Packaging Company LP
- 6.4.7 GTX Hanex Plastic Sp. z o.o.
- 6.4.8 Dunmore Corporation
- 6.4.9 Comar LLC
- 6.4.10 TOPPAN Holdings Inc.
- 6.4.11 Huhtamaki Oyj
- 6.4.12 Nampak Ltd.
- 6.4.13 Plastipak Holdings Inc.
- 6.4.14 ACTI PACK S.A.S
- 6.4.15 RETAL Industries Ltd
- 6.4.16 Sealed Air Corporation
- 6.4.17 Pactiv Evergreen Inc.
- 6.4.18 Uflex Ltd.
- 6.4.19 Zhongfu Industrial Co. Ltd.
- 6.4.20 Novapet S.A.
7 MARKET OPPORTUNITIES AND FUTURE OUTLOOK
- 7.1 White-Space and Unmet-Need Assessment
 2026年全球PET包装市场报告2026年全球PET饮料包装市场报告
 医药市场PET包装:按包装类型、药品类型、填充和封装工艺、永续性解决方案以及最终用户划分-2026年至2032年全球市场预测
 PET包装市场-2026-2031年预测
 日本PET包装市场规模、份额、趋势及预测(依包装类型、形式、包装类型、填充技术、最终用户及地区划分),2026-2034年
 PET包装市场规模、份额和成长分析(按产品类型、原料、包装类型、最终用途和地区划分)-2026-2033年产业预测
 美国PET硬质热成型塑胶包装市场规模、份额和趋势分析报告:按产品、应用和细分市场预测(2026-2033年)
 PET 包装市场 - 全球产业规模、份额、趋势、机会及预测,按类型、包装类型、最终用户、地区及竞争情况细分,2020-2030 年预测2025 年至 2033 年 PET 包装市场规模、份额、趋势及预测(按包装类型、形式、包装类型、填充技术、最终用户和地区划分)
 PET 饮料包装:市场占有率分析、产业趋势与统计、成长预测(2025-2030 年)