


 |
市场调查报告书
商品编码
1906963
聚对苯二甲酸乙二醇酯(PET):市场占有率分析、产业趋势与统计、成长预测(2026-2031)Polyethylene Terephthalate (PET) - Market Share Analysis, Industry Trends & Statistics, Growth Forecasts (2026 - 2031) |
||||||
※ 本网页内容可能与最新版本有所差异。详细情况请与我们联繫。
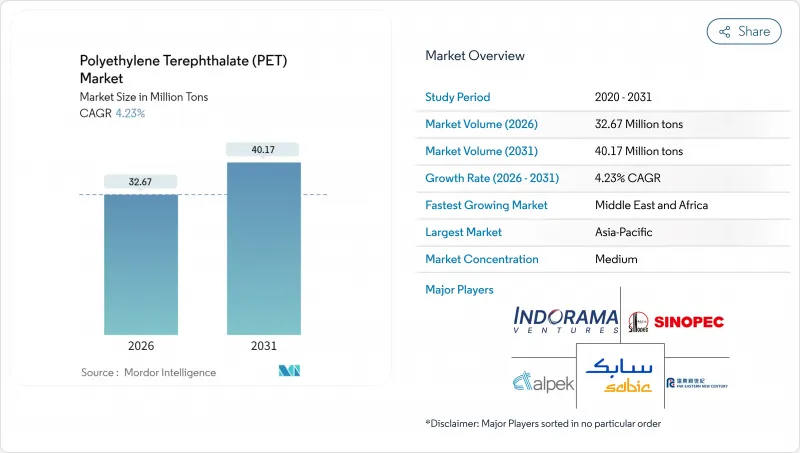
预计到 2026 年,聚对苯二甲酸乙二醇酯 (PET) 市场规模将达到 3,267 万吨。
这意味着产量将从 2025 年的 3,134 万吨增加到 2031 年的 4,017 万吨,2026 年至 2031 年的年复合成长率(CAGR)为 4.23%。
成长的驱动力在于阻隔性能、成本竞争力和可回收性之间的平衡,这使其在饮料包装领域的地位日益巩固,同时在电子产品和工业纺织品领域的应用也在不断扩展。亚太地区的强劲需求、日益严格的再生材料含量监管要求以及化学回收技术的进步是推动销售成长的根本因素。品牌所有者的永续性措施为再生聚对苯二甲酸乙二醇酯(rPET)创造了稳定的需求,而新兴市场对成本的谨慎采购则维持了对原生树脂的需求。儘管原料价格波动以及聚Polyethylene Furanoate酯(PEF)和铝替代的威胁带来了不利影响,但对闭合迴路系统和特种等级产品的投资正为聚对苯二甲酸乙二醇酯(PET)市场提供多元化的成长机会。
全球聚对苯二甲酸乙二醇酯(PET)市场趋势与洞察
过渡到封闭式瓶对瓶回收
预计2024年,欧洲聚对苯二甲酸乙二醇酯(PET)饮料瓶的回收率将达到75%,新瓶中再生材料的含量将上升至24%,接近计画于2025年底生效的25%的强制性标准。由于托盘应用中产生的高品质碎片导致区域供应紧张,欧洲再生聚对苯二甲酸乙二醇酯(rPET)的价格仍维持在每吨750-800美元左右的高位,远高于原生树脂。儘管机械回收的限制促使企业投资于催化和热解技术,但规模成本和原料波动限制了这些技术的即时效益。跨国公司继续集中投资基础设施以确保原材料供应,并正在重新制定聚对苯二甲酸乙二醇酯(PET)市场的长期筹资策略。
新兴市场无菌热灌装PET包装的快速成长
在低温运输持续短缺的情况下,东南亚和拉丁美洲等新兴市场正加速采用热固型瓶。聚对苯二甲酸乙二醇酯(PET)的耐热特性使得果汁和乳类饮料能够在室温下储存,从而减少电力供应不稳定地区的食品变质。热固型PET价格较高,有利于拥有专用设施的成熟生产商。同时,监管机构正日益将无菌包装视为食品安全政策的支柱。这一趋势正在将聚对苯二甲酸乙二醇酯(PET)市场拓展到碳酸饮料以外的领域,并促使区域树脂加工商投资升级其拉伸吹塑成型成型设备。
对二甲苯 (PX) 和单乙二醇 (MEG) 原料价格波动
对二甲苯 (PX) 和乙二醇 (MEG) 约占 PET 变动成本的 85%,其利润率与原油价格波动密切相关。亚洲的一体化生产企业享有物流优势,而欧美生产商则需承担更高的运费和能源成本。地缘政治动盪和运输限制加剧了区域价格差异,降低了独立工厂的出口竞争力。避险工具虽然可以部分缓解这个问题,但也增加了合约的复杂性,加重了小规模的加工企业,尤其是那些财务基础较弱的企业的负担。
细分市场分析
由于成本效益高且品质稳定,到2025年,原生树脂将占全球出货量的76.10%(约2,385万吨)。再生PET的出货量略低于750万吨,预计将以8.02%的复合年增长率成长,成为成长最快的树脂类型,这主要得益于监管要求和品牌目标带来的市场需求成长。欧洲将主导再生PET的普及应用,预计2024年,本地生产的再生PET将有39%用于瓶装生产。然而,原料短缺和分类回收的挑战将导致北美地区再生PET的价格持续高于原生树脂,溢价约为每吨150-200美元,欧盟地区则可能高达每吨800美元。
机械回收对颜色和污染物的限制促使人们关注化学解聚技术,但由于其资本密集,在2028年之前难以广泛应用。食品级造粒生产线的投资正在扩大再生PET的供应比例,并缩小成本差距。原生PET供应商正利用其自身的回收设施来确保打包材料的供应,从而重塑了不断发展的PET市场中原生PET与再生PET之间的竞争格局。
聚对苯二甲酸乙二醇酯(PET)市场报告按原料类型(原生PET和再生PET)、终端用户产业(汽车、建筑、电气电子、工业机械及其他终端用户产业)和地区(北美、南美、欧洲、亚太、中东和非洲)进行细分。市场预测以数量(吨)和价值(美元)为单位。
区域分析
亚太地区预计将引领市场,到2025年将占全球产量的47.10%(约1480万吨),这主要得益于其一体化的原材料供给能力和快速增长的消费需求。中国仍将是最大的生产基地,而印度的消费量正因包装食品市场的成长和回收投资而加速成长。印尼和泰国等东南亚国家正在扩大产能,以服务区域饮料和纺织业。 Indorama Ventures透过与Varun Beverages成立合资企业,加强了其在当地的业务布局,展现了其兼顾规模扩张和本地市场准入的策略。
儘管产量有限,欧洲和北美在推动再生PET(rPET)应用的法规结构方面处于主导。欧盟的目标是到2024年实现75%的宝特瓶回收率,这将使欧盟对再生PET的国内需求高于全球标准。虽然高昂的能源和劳动力成本给当地生产商带来了压力,但与寻求低碳包装的品牌所有者地理位置接近性,有利于生产高附加价值特种产品。北美页岩原料的经济效益良好,但来自亚洲的进口压力限制了利润率的成长,迫使生产商转向生产技术级和再生级PET,以保持在PET市场的竞争力。
中东和非洲地区预计将以5.05%的复合年增长率实现最快成长。沿岸地区的生产商正充分利用有利的原材料,例如博禄(Borouge)等公司计划到2028年实现年产能超过660万吨,目标出口亚洲和非洲。都市化和基础设施投资正在推动国内需求成长,尤其是瓶装水和乳类饮料的需求。儘管政治不稳定和水资源短缺构成挑战,但该地区具有优势的原材料成本以及位于欧洲和亚洲之间的地理位置,为其提供了战略性的运输路线。
其他福利:
- Excel格式的市场预测(ME)表
- 3个月的分析师支持
目录
第一章 引言
- 研究假设和市场定义
- 调查范围
第二章调查方法
第三章执行摘要
第四章 市场情势
- 市场概览
- 市场驱动因素
- 迈向闭合迴路瓶到瓶回收
- 新兴市场无菌热填充PET包装的快速成长
- 长丝级PET在产业用纺织品的应用拓展
- 品牌拥有者承诺在2030年达到50%的再生聚乙烯(rPET)含量。
- 政府强制推行一次性塑胶替代品
- 市场限制
- PX和MEG原物料价格波动
- 瓶子製纤维的降级回收可能导致供应过剩
- PEF 和铝替代品的威胁
- 价值链分析
- 波特五力模型
- 新进入者的威胁
- 供应商的议价能力
- 买方的议价能力
- 替代品的威胁
- 竞争对手之间的竞争
- 进出口趋势
- 价格趋势
- 形态趋势
- 回收利用概述
- 法律规范
- 终端用户产业趋势
- 航太(航太零件生产收入)
- 汽车(汽车产量)
- 建筑与施工(新建建筑占地面积)
- 电气电子设备(电气电子设备生产收入)
- 包装(塑胶包装量)
第五章 市场规模及成长预测(以金额为准及数量)
- 依原料类型
- 处女宠物
- 再生PET(rPET)
- 按最终用户行业划分
- 车
- 建筑/施工
- 电气和电子设备
- 工业和机械
- 包装
- 其他终端用户产业
- 按地区
- 亚太地区
- 中国
- 印度
- 日本
- 韩国
- 澳洲
- 马来西亚
- 亚太其他地区
- 北美洲
- 美国
- 加拿大
- 墨西哥
- 欧洲
- 德国
- 法国
- 英国
- 义大利
- 俄罗斯
- 其他欧洲地区
- 南美洲
- 巴西
- 阿根廷
- 南美洲其他地区
- 中东和非洲
- 沙乌地阿拉伯
- 阿拉伯聯合大公国
- 南非
- 奈及利亚
- 其他中东和非洲地区
- 亚太地区
第六章 竞争情势
- 市场集中度
- 策略趋势
- 市占率(%)/排名分析
- 公司简介
- Alpek SAB de CV
- CR Chemical Materials Technology Inc.
- Far Eastern New Century Co., Ltd.
- Hengli Group Co. Ltd
- Indorama Ventures Public Company Limited.
- LOTTE Chemical CORPORATION
- Mitsubishi Chemical Group Corporation
- NAN YA Plastics Industrial Co., Ltd.
- Reliance Industries Limited
- SABIC
- Sanfangxiang Group Co., Ltd.
- Sinopec(China Petrochemical Corporation)
- Zhejiang Hengyi Group Co., Ltd.
- Zhink Group Co., Ltd.
第七章 市场机会与未来展望
第八章:执行长面临的关键策略挑战
Polyethylene Terephthalate Market size in 2026 is estimated at 32.67 Million tons, growing from 2025 value of 31.34 Million tons with 2031 projections showing 40.17 Million tons, growing at 4.23% CAGR over 2026-2031.
Growth rests on the material's balance of barrier performance, cost-competitiveness, and recyclability, reinforcing its role in beverage packaging even as electronics and technical textiles widen the application base. Robust demand in Asia-Pacific, expanding regulatory mandates for recycled content, and technology advances in chemical recycling underpin volume expansion. Brand-owner sustainability pledges create predictable offtake for rPET (Recycled Polyethylene Terephthalate), while cost-focused procurement in emerging markets sustains virgin resin demand. Feedstock volatility and substitution threats from PEF (polyethylene furanoate) or aluminum introduce headwinds; nonetheless, investment in closed-loop systems and specialty grades positions the PET (Polyethylene Terephthalate) market for diversified growth.
Global Polyethylene Terephthalate (PET) Market Trends and Insights
Shift Toward Bottle-to-bottle Closed-loop Recycling
Collection rates of 75% for Polyethylene Terephthalate (PET) beverage bottles in Europe during 2024 pushed recycled content in new bottles to 24%, edging toward the 25% mandate effective end-2025. High-quality flakes diverted from tray applications tightened regional supply and kept European rPET (Recycled Polyethylene Terephthalate) premiums near USD 750-800 per ton above virgin resin. Mechanical recycling limits spur investment in catalytic glycolysis and pyrolysis, yet scale-up costs and feedstock variability restrain immediate impact. Multinationals continue to co-finance infrastructure to secure feedstock, redefining long-term procurement strategies within the Polyethylene Terephthalate (PET) market.
Rapid Growth of Aseptic and Hot-fill PET Packaging in Emerging Markets
Emerging markets in Southeast Asia and Latin America accelerate the adoption of heat-set bottles as cold-chain gaps persist. Polyethylene Terephthalate (PET)'s thermal resistance enables ambient shelf life for juices and dairy drinks, reducing spoilage in areas with unreliable electricity. Premium pricing for heat-set grades favors incumbents with specialized equipment, while regulators increasingly cite aseptic packaging as a pillar of food-security policy. The trend widens the Polyethylene Terephthalate (PET) market beyond carbonated beverages and supports regional resin converters investing in stretch-blow molding upgrades.
Volatility in PX (Paraxylene) and MEG (Mono Ethylene Glycol) Feedstock Prices
Paraxylene (PX) and Mono Ethylene Glycol (MEG) account for roughly 85% of PET variable cost, tying margins to crude oil swings. Integrated Asian complexes enjoy logistic advantages, whereas European and North American makers absorb freight and energy premiums. Geopolitical disruptions and shipping constraints recently widened inter-regional price gaps, eroding export competitiveness for standalone plants. Hedging tools offer partial relief but increase contract complexity, particularly for small converters lacking balance-sheet strength.
Other drivers and restraints analyzed in the detailed report include:
- Expansion of Filament-grade PET in Technical Textiles
- Brand-owner Pledges for 50 % rPET (Recycled Polyethylene Terephthalate) Content by 2030
- Substitution Threat from PEF and Aluminum
For complete list of drivers and restraints, kindly check the Table Of Contents.
Segment Analysis
Virgin resin accounted for 76.10% of global shipments in 2025-roughly 23.85 million tons-owing to cost efficiency and uniform quality. Recycled PET, at just under 7.5 million tons, posted the steepest 8.02% CAGR projection as mandates and brand targets raise demand. Europe led adoption, with 39% of locally produced rPET re-entering bottles in 2024, yet tight feedstock and separate-collection gaps sustained price premiums of USD 150-200 per ton over virgin in North America and up to USD 800 per ton in the EU (European Union).
Mechanical recycling limitations in color and contamination have accelerated interest in chemical depolymerization, though capital intensity impedes widespread roll-out before 2028. Investment in food-grade pelletizing lines expands usable rPET fraction, narrowing the cost differential. Virgin suppliers hedge with captive recycling units to secure bale access, reframing competition along the virgin-recycled continuum in the evolving PET market.
The Polyethylene Terephthalate (PET) Market Report is Segmented by Source Type (Virgin PET and Recycled PET), End User Industry (Automotive, Building and Construction, Electrical and Electronics, Industrial and Machinery, and Other End-User Industries), and Geography (North America, South America, Europe, Asia-Pacific, and Middle East and Africa). The Market Forecasts are Provided in Terms of Volume (Tons) and Value (USD).
Geography Analysis
Asia-Pacific dominated with 47.10% of the 2025 volume, nearly 14.8 million tons, due to integrated feedstock capacity and burgeoning consumer demand. China retains the largest production base, while India's consumption accelerates through packaged food growth and recycling investments. Southeast Asian nations such as Indonesia and Thailand add capacity to serve regional beverage and textile hubs. Indorama Ventures strengthened its local footprint via a joint venture with Varun Beverages, illustrating the strategy of coupling scale with local market access.
Europe and North America contribute smaller shares but lead in regulatory frameworks that stimulate rPET uptake. The EU recorded a PET bottle recycling rate of 75% in 2024, driving domestic rPET demand above global norms. High energy and labor costs pressure local producers, but proximity to brand owners seeking low-carbon packaging supports high-value specialty production. North America benefits from shale-based feedstock economics; however, import pressure from Asia tempers margin gains, pushing producers toward technical and recycled grades to remain competitive in the PET market.
The Middle East and Africa region exhibited the fastest 5.05% CAGR outlook. Gulf producers exploit advantaged feedstocks, and companies such as Borouge plan capacity beyond 6.6 million tons per year by 2028, targeting exports to Asia and Africa. Domestic demand rises with urbanization and infrastructure spending, particularly for bottled water and dairy beverages. Political instability and water scarcity pose challenges, yet feedstock economics and geographic location between Europe and Asia provide strategic shipping routes.
- Alpek S.A.B. de C.V.
- CR Chemical Materials Technology Inc.
- Far Eastern New Century Co., Ltd.
- Hengli Group Co. Ltd
- Indorama Ventures Public Company Limited.
- LOTTE Chemical CORPORATION
- Mitsubishi Chemical Group Corporation
- NAN YA Plastics Industrial Co., Ltd.
- Reliance Industries Limited
- SABIC
- Sanfangxiang Group Co., Ltd.
- Sinopec (China Petrochemical Corporation)
- Zhejiang Hengyi Group Co., Ltd.
- Zhink Group Co., Ltd.
Additional Benefits:
- The market estimate (ME) sheet in Excel format
- 3 months of analyst support
TABLE OF CONTENTS
1 Introduction
- 1.1 Study Assumptions and Market Definition
- 1.2 Scope of the Study
2 Research Methodology
3 Executive Summary
4 Market Landscape
- 4.1 Market Overview
- 4.2 Market Drivers
- 4.2.1 Shift Toward Bottle-to-bottle Closed-loop Recycling
- 4.2.2 Rapid Growth of Aseptic and Hot-fill PET Packaging in Emerging Markets
- 4.2.3 Expansion of Filament-grade PET in Technical Textiles
- 4.2.4 Brand-owner Pledges for 50 % rPET Content by 2030
- 4.2.5 Government Mandates on Single-use Plastics Substitution
- 4.3 Market Restraints
- 4.3.1 Volatility in PX and MEG Feedstock Prices
- 4.3.2 Bottle-to-fibre Down-cycling Oversupply Risk
- 4.3.3 Substitution Threat from PEF and Aluminum
- 4.4 Value Chain Analysis
- 4.5 Porter's Five Forces
- 4.5.1 Threat of New Entrants
- 4.5.2 Bargaining Power of Suppliers
- 4.5.3 Bargaining Power of Buyers
- 4.5.4 Threat of Substitutes
- 4.5.5 Competitive Rivalry
- 4.6 Import And Export Trends
- 4.7 Price Trends
- 4.8 Form Trends
- 4.9 Recycling Overview
- 4.10 Regulatory Framework
- 4.11 End-use Sector Trends
- 4.11.1 Aerospace (Aerospace Component Production Revenue)
- 4.11.2 Automotive (Automobile Production)
- 4.11.3 Building and Construction (New Construction Floor Area)
- 4.11.4 Electrical and Electronics (Electrical and Electronics Production Revenue)
- 4.11.5 Packaging(Plastic Packaging Volume)
5 Market Size and Growth Forecasts (Value and Volume)
- 5.1 By Source Type
- 5.1.1 Virgin PET
- 5.1.2 Recycled PET (rPET)
- 5.2 By End User Industry
- 5.2.1 Automotive
- 5.2.2 Building and Construction
- 5.2.3 Electrical and Electronics
- 5.2.4 Industrial and Machinery
- 5.2.5 Packaging
- 5.2.6 Other End-user Industries
- 5.3 By Geography
- 5.3.1 Asia-Pacific
- 5.3.1.1 China
- 5.3.1.2 India
- 5.3.1.3 Japan
- 5.3.1.4 South Korea
- 5.3.1.5 Australia
- 5.3.1.6 Malaysia
- 5.3.1.7 Rest of Asia-Pacific
- 5.3.2 North America
- 5.3.2.1 United States
- 5.3.2.2 Canada
- 5.3.2.3 Mexico
- 5.3.3 Europe
- 5.3.3.1 Germany
- 5.3.3.2 France
- 5.3.3.3 United Kingdom
- 5.3.3.4 Italy
- 5.3.3.5 Russia
- 5.3.3.6 Rest of Europe
- 5.3.4 South America
- 5.3.4.1 Brazil
- 5.3.4.2 Argentina
- 5.3.4.3 Rest of South America
- 5.3.5 Middle East and Africa
- 5.3.5.1 Saudi Arabia
- 5.3.5.2 United Arab Emirates
- 5.3.5.3 South Africa
- 5.3.5.4 Nigeria
- 5.3.5.5 Rest of Middle East and Africa
- 5.3.1 Asia-Pacific
6 Competitive Landscape
- 6.1 Market Concentration
- 6.2 Strategic Moves
- 6.3 Market Share (%)**/Ranking Analysis
- 6.4 Company Profiles (includes Global Level Overview, Market Level Overview, Core Segments, Financials as available, Strategic Information, Market Rank/Share for key companies, Products and Services, and Recent Developments)
- 6.4.1 Alpek S.A.B. de C.V.
- 6.4.2 CR Chemical Materials Technology Inc.
- 6.4.3 Far Eastern New Century Co., Ltd.
- 6.4.4 Hengli Group Co. Ltd
- 6.4.5 Indorama Ventures Public Company Limited.
- 6.4.6 LOTTE Chemical CORPORATION
- 6.4.7 Mitsubishi Chemical Group Corporation
- 6.4.8 NAN YA Plastics Industrial Co., Ltd.
- 6.4.9 Reliance Industries Limited
- 6.4.10 SABIC
- 6.4.11 Sanfangxiang Group Co., Ltd.
- 6.4.12 Sinopec (China Petrochemical Corporation)
- 6.4.13 Zhejiang Hengyi Group Co., Ltd.
- 6.4.14 Zhink Group Co., Ltd.
7 Market Opportunities and Future Outlook
- 7.1 White-space and Unmet-Need Assessment
- 7.2 AI-driven Technologies to Optimize Processes
8 Key Strategic Questions for CEOs
 聚对苯二甲酸乙二醇酯市场分析及预测(至2035年):类型、产品类型、应用、形态、材料类型、製程、最终用户、功能、安装类型
 南美洲聚对苯二甲酸乙二酯(PET):市场占有率分析、产业趋势与统计、成长预测(2026-2031)非洲聚对苯二甲酸乙二醇酯(PET):市场占有率分析、产业趋势与统计、成长预测(2026-2031)
 2026年全球再生聚对苯二甲酸乙二酯市场报告2026年全球聚对苯二甲酸乙二醇酯(PET)及聚聚丁烯对苯二甲酸酯(PBT)树脂市场报告2026年聚对苯二甲酸乙二酯全球市场报告
 聚对苯二甲酸乙二醇酯市场:依树脂类型、製造流程、终端用途产业及应用划分-2026-2032年全球预测聚对苯二甲酸乙二醇酯树脂市场:依树脂类型、製造流程、等级及应用划分-2026-2032年全球预测聚对苯二甲酸丙二醇酯:市场份额分析、产业趋势与统计、成长预测(2026-2031)
 聚对苯二甲酸乙二醇酯市场规模、份额和成长分析(按再生产品、应用、包装类型和地区划分)-2026-2033年产业预测