


 |
市场调查报告书
商品编码
1910551
氰化钠:市场占有率分析、产业趋势与统计、成长预测(2026-2031)Sodium Cyanide - Market Share Analysis, Industry Trends & Statistics, Growth Forecasts (2026 - 2031) |
||||||
※ 本网页内容可能与最新版本有所差异。详细情况请与我们联繫。
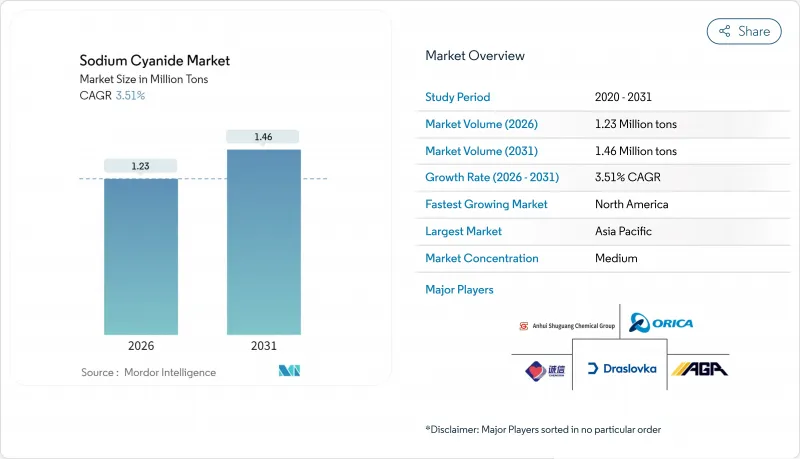
预计氰化钠市场将从 2025 年的 119 万吨增加到 2026 年的 123 万吨,到 2031 年达到 146 万吨,2026 年至 2031 年的复合年增长率为 3.51%。
传统金矿区的需求日益成熟,同时,低品位矿石计划、日益严格的环境法规以及模组化本地生产技术带来的新机会(这些技术降低了物流风险)也构成了挑战。北美和亚太地区的业者持续调整采购方式,转向为偏远堆浸场提供固态压块,而液态溶液则在自动化冶炼厂中越来越受欢迎,因为即时交货可以降低库存成本。市场领导领导者正透过收购来扩大产能和地理覆盖范围,从而加强垂直整合;同时,研发管线也正在推动替代浸出剂从试验规模走向商业性化应用。儘管监管审查和运费溢价持续抑制销售成长,但这些因素共同凸显了氰化钠市场的长期重要性。
全球氰化钠市场趋势及洞察
低品位金矿开采热潮导致氰化钠(NaCN)需求量激增
内华达金矿和纽蒙特塔纳米矿区等大型矿山矿石品位下降,导致氰化物用量比传统方法增加了30-40%。儘管黄金产量保持稳定,但这项变化推高了试剂的平均用量。现代堆浸垫片可处理金品位低于1克/吨的矿石,并透过延长停留时间来确保经济效益。矿石品位下降导致氰化钠消费量不成比例地增加。西非氧化矿带和西伯利亚不溶性矿床也出现了类似的趋势,即使新矿床放缓,这些矿床的氰化钠需求仍然稳定。儘管工程团队不断优化pH值、氧气浓度和固液比,但化学原理仍表明,黄金溶解速率与氰化钠浓度密切相关。这些因素共同支撑着全球氰化钠市场结构性而非週期性的需求。
非洲和中亚堆浸计划增加
从哈萨克的RG Gold金矿项目到Nordgold的Bissa-Buri矿区,探勘的地区的开发商已普遍采用堆浸工艺,该工艺依赖于稳定的氰化钠投加量。许多矿床含有易被氰化物浸出的氧化矿石,可实现快速、低成本的建设。随着中亚铁路走廊和内陆港口的开通,区域氰化钠生产商的供货管道日益便利,降低了运费溢价,提高了利润率。机构投资者现在要求企业必须符合国际氰化物控制规则(ICMC)才能获得融资,这迫使营运商与能够提供符合ICMC认证产品的供应商签订供应协议。因此,预计未来十年,在哈萨克、乌兹别克和萨赫勒地区拥有分销中心的氰化钠市场参与企业将占据不断增长的供应量的大部分份额。
毒性与日益增多的ICMC合规性审核
2024年,国际矿产监管委员会(ICMC)审核提高了标准,要求对氰化物的运输、储存和使用进行即时遥测,导致中型矿业公司的年度合规预算增加了15%至25%。英国发生的一起备受瞩目的氰化物洩漏事故(造成90公斤鱼类死亡)加剧了公众的关注,并导致氰化物处理者的保险费上涨。欧盟和美国职业安全与健康管理局(OSHA)对空气中氰化氢(HCN)的更严格规定,强制要求使用密封处理系统并升级个人防护设备。这些因素预计将限制产量成长,尤其是对于资金有限的小型矿业公司而言。
细分市场分析
2025年,固体氰化钠占出货量的60.72%。这一比例得益于其低洩漏风险、长保质期和简化的ICMC文件(ORICA.COM)。大规模堆浸作业使用压块进行分级和控制溶解,从而在60-90天的浸出週期内调整氰化物浓度曲线。固体产品可透过ISO罐和1吨IBC货柜进行散装运输,并严格遵守监管链通讯协定。
同时,液态氰化钠市场预计将以3.72%的复合年增长率成长,到2031年达到58.3万吨。包装和微型物流领域日益激烈的竞争正促使服务差异化从简单的吨位转向端到端的安全保障、遥测技术和试剂管理。以30-32%溶液形式供应的液态氰化钠符合「循环取送」物流模式,有助于改善营运资金并实现精准的化学品供应比例。这些趋势共同巩固了氰化钠市场的双形态结构,液态氰化钠市场正成为成长重点,而固体市场则继续保持其主导地位。
本氰化钠报告按产品形态(固体和液态溶液)、终端用户产业(采矿、化学及其他终端用户产业)和地区(亚太地区、北美、欧洲、南美以及中东和非洲)进行分析。市场预测以吨为单位。
区域分析
预计到2025年,亚太地区将占全球氰化物市场29.95%的收入份额,主要得益于河北省的氰化物合成产业园、澳洲的世界级金矿以及印尼新兴的堆浸计划。然而,随着更严格的环境法规和替代浸出剂试验抑制了新增需求,预计该地区的成长速度将放缓至3%左右。同时,北美氰化钠市场预计将实现3.98%的复合年增长率,主要受内华达黄金矿业合资企业、阿比蒂比绿岩带探勘的重启以及墨西哥模组化现场合成产能扩张的推动。在南美,秘鲁和智利的尾矿再处理计划正在推动该地区的试剂需求,而随着哈萨克和乌兹别克开始开发新的氧化矿,中亚地区的产量小规模增长。欧洲仍然是一个稳定的、小规模的消费地区,德国和法国的工业用户占了大部分消费量。中东和非洲加起来所占份额小规模,但随着新矿床和基础设施建设的推进,预计该地区将显着成长。
其他福利:
- Excel格式的市场预测(ME)表
- 分析师支持(3个月)
目录
第一章 引言
- 研究假设和市场定义
- 调查范围
第二章调查方法
第三章执行摘要
第四章 市场情势
- 市场概览
- 市场驱动因素
- 低品位金矿的快速开发需要更高的氰化钠添加量。
- 非洲和中亚的堆浸计划数量不断增加
- 透过推广本地安装的模组化氰化钠装置来降低物流成本
- 亚太地区矿山氰化物曝气系统应用范围扩大
- 拉丁美洲含银尾矿的回收。
- 市场限制
- 毒性及强化型ICMC合规性审核
- 中试规模改用甘胺酸/硫代硫酸盐浸出剂
- 危险品海运附加费高
- 价值链分析
- 波特五力模型
- 供应商的议价能力
- 买方的议价能力
- 新进入者的威胁
- 替代品的威胁
- 竞争对手之间的竞争
第五章 市场规模与成长预测
- 按产品形式
- 固体(煤球/粉末)
- 液体溶液
- 按最终用户行业划分
- 矿业
- 化学品
- 其他终端用户产业
- 按地区
- 亚太地区
- 中国
- 澳洲和纽西兰
- 印尼
- 亚太其他地区
- 北美洲
- 美国
- 加拿大
- 墨西哥
- 欧洲
- 俄罗斯
- 独联体(原俄罗斯)
- 其他欧洲地区
- 南美洲
- 巴西
- 秘鲁
- 阿根廷
- 其他南美洲
- 中东和非洲
- 迦纳
- 苏丹
- 南非
- 其他中东和非洲地区
- 亚太地区
第六章 竞争情势
- 市场集中度
- 策略趋势
- 市占率(%)/排名分析
- 公司简介
- Anhui Shuguang Chemical Group
- Australian Gold Reagents Pty Ltd
- Changsha Hekang Chemical Co. Ltd
- CSBP(Wesfarmers Chemicals, Energy & Fertilisers)
- CyPlus GmbH
- Draslovka
- Hebei Chengxin Group Co. Ltd
- JINCHENG HONGSHENG CHEMICAL CO. LTD
- Orica Limited
- Taekwang Industrial Co. Ltd
- Tongsuh Petrochemical Corp. Ltd(Asahi Kasei Corporation)
- Unigel
- Ynnovate Sanzheng(Yingkou)Fine Chemicals Co. Ltd
第七章 市场机会与未来展望
The Sodium Cyanide market is expected to grow from 1.19 Million tons in 2025 to 1.23 Million tons in 2026 and is forecast to reach 1.46 Million tons by 2031 at 3.51% CAGR over 2026-2031.
Mature demand in traditional gold-mining jurisdictions co-exists with fresh momentum from low-grade ore projects, tighter environmental codes, and modular on-site production technologies that lower logistics risk. Operators in North America and Asia-Pacific continue to recalibrate procurement toward solid briquettes for remote heap-leach sites, while liquid solutions gain favor at automated mills where just-in-time delivery trims inventory costs. Market leaders strengthen vertical integration through acquisitions that expand capacity and regional reach, and research pipelines push alternative lixiviants from pilot scale toward commercial feasibility. Collectively, these forces reinforce the sodium cyanide market's long-term relevance even as regulatory scrutiny and freight premiums apply counterweights to volume growth.
Global Sodium Cyanide Market Trends and Insights
Boom in Low-Grade Gold Mining Requiring Higher NaCN Loadings
Declining ore grades at flagship operations such as Nevada Gold Mines and Newmont's Tanami asset now demand cyanide additions that are 30-40% above historical norms, a shift that lifts average reagent intensity even where gold output stays flat. Modern heap-leach pads handle ore below 1 g/t Au, using extended residence times to secure economic recoveries, and every incremental percentage point drop in head grade translates into a disproportionate rise in sodium cyanide consumption. Similar patterns play out in West African oxide belts and Siberia's refractory lodes, adding steady tonnage demand even as greenfield discoveries slow. Engineering teams continue to optimize pH, oxygen levels, and solid-liquid ratios, yet chemistry fundamentals still tether gold dissolution rates to cyanide concentration. These realities together underpin a structural, not cyclical, pull on the global sodium cyanide market.
Rising Heap-Leach Projects in Africa and Central Asia
From Kazakhstan's RG Gold circuit to Nordgold's Bissa-Bouly complex, developers in under-explored regions are standardizing heap-leach flowsheets that rely on consistent sodium cyanide dosing. Many deposits host oxidized ores that dissolve readily under cyanide leach, enabling capital-lite builds over short schedules. Proximity to regional NaCN producers is improving as rail corridors and dry ports open across Central Asia, trimming freight surcharges and strengthening margins. Institutional lenders now require International Cyanide Management Code (ICMC) compliance as a condition of finance, pushing operators to lock in supply contracts with vendors capable of delivering code-certified product. Consequently, sodium cyanide market participants with distribution hubs in Kazakhstan, Uzbekistan, and the Sahel stand to capture an outsized share of incremental volumes over the decade.
Toxicity and Tightening ICMC Compliance Audits
ICMC auditors raised the bar in 2024 by mandating real-time telemetry on cyanide transport, storage, and consumption, adding 15-25% to annual compliance budgets for mid-tier miners. A high-profile spill in the United Kingdom that resulted in 90 kg of fish mortality sharpened public scrutiny and triggered insurance premium hikes for cyanide handlers. Stringent European Union and U.S. Occupational Safety and Health Administration (OSHA) limits on airborne HCN now compel enclosed handling systems and personal protective equipment upgrades. These factors collectively temper volume growth, especially for junior miners with constrained capital.
Other drivers and restraints analyzed in the detailed report include:
- Increasing Adoption of Cyanide Sparging Systems in APAC Mines
- Recovery of Silver-Bearing Tailings in Latin America
- High Marine Freight Premiums for Hazardous Cargoes
For complete list of drivers and restraints, kindly check the Table Of Contents.
Segment Analysis
Solid sodium cyanide accounted for 60.72% of 2025 shipments, a position underpinned by the format's lower spill risk, longer shelf life, and simplified ICMC documentation ORICA.COM. Large heap-leach operations use briquettes to stage-gate dissolution, thereby regulating the cyanide concentration profile over 60-90 day leach cycles. Solid product handling also permits bulk ISO-tank or 1 ton IBC deliveries, aligning with strict chain-of-custody protocols.
Conversely, the liquids sub-segment is poised for 3.72% CAGR, closing in on 583,000 t by 2031. Competitive intensity intensifies around packaging and micro-logistics, with service differentiation shifting from mere tonnage to end-to-end safety, telemetry, and reagent stewardship. Delivered as 30-32% solution, liquids sync with "milk-run" logistics, improving working capital and enabling precise chem-feed ratios. Together these trends preserve the solid segment's command while elevating liquids as the growth spotlight, reinforcing the sodium cyanide market's dual-format architecture.
The Sodium Cyanide Report is Segmented by Product Form (Solid and Liquid Solution), End-User Industry (Mining, Chemicals, and Other End-User Industries), and Geography (Asia-Pacific, North America, Europe, South America, and Middle-East and Africa). The Market Forecasts are Provided in Terms of Volume (Tons).
Geography Analysis
Asia-Pacific held 29.95% revenue share in 2025 on the strength of China's cyanide synthesis park in Hebei, Australia's world-class gold camps, and Indonesia's emergent heap projects. However, regional growth cools to a mid-3% pace as tighter environmental norms and alternative lixiviant pilots moderate fresh demand. Conversely, North America's sodium cyanide market is expected to post 3.98% CAGR, underwritten by the Nevada Gold Mines joint venture, renewed exploration in the Abitibi greenstone belt, and modular on-site synth capacity adds in Mexico. South America's pipeline of tailings re-treatments in Peru and Chile nudges regional reagent needs upward, while Central Asian tonnage climbs off a small base as Kazakhstan and Uzbekistan open new oxide developments. Europe remains a steady yet small consumer, with industrial users in Germany and France dominating offtake. Africa and the Middle East together account for a modest share but deliver outsized growth where greenfield deposits intersect infrastructure upgrades.
- Anhui Shuguang Chemical Group
- Australian Gold Reagents Pty Ltd
- Changsha Hekang Chemical Co. Ltd
- CSBP (Wesfarmers Chemicals, Energy & Fertilisers)
- CyPlus GmbH
- Draslovka
- Hebei Chengxin Group Co. Ltd
- JINCHENG HONGSHENG CHEMICAL CO. LTD
- Orica Limited
- Taekwang Industrial Co. Ltd
- Tongsuh Petrochemical Corp. Ltd (Asahi Kasei Corporation)
- Unigel
- Ynnovate Sanzheng (Yingkou) Fine Chemicals Co. Ltd
Additional Benefits:
- The market estimate (ME) sheet in Excel format
- 3 months of analyst support
TABLE OF CONTENTS
1 Introduction
- 1.1 Study Assumptions and Market Definition
- 1.2 Scope of the Study
2 Research Methodology
3 Executive Summary
4 Market Landscape
- 4.1 Market Overview
- 4.2 Market Drivers
- 4.2.1 Boom in low-grade gold mining requiring higher NaCN loadings
- 4.2.2 Rising heap-leach projects in Africa and Central Asia
- 4.2.3 Growth of on-site modular NaCN plants lowering logistics cost
- 4.2.4 Increasing adoption of cyanide sparging systems in APAC mines
- 4.2.5 Recovery of silver-bearing tailings in Latin America
- 4.3 Market Restraints
- 4.3.1 Toxicity and tightening ICMC compliance audits
- 4.3.2 Pilot-scale switch to glycine/thiosulphate lixiviants
- 4.3.3 High marine freight premiums for hazardous cargoes
- 4.4 Value Chain Analysis
- 4.5 Porter's Five Forces
- 4.5.1 Bargaining Power of Suppliers
- 4.5.2 Bargaining Power of Buyers
- 4.5.3 Threat of New Entrants
- 4.5.4 Threat of Substitutes
- 4.5.5 Competitive Rivalry
5 Market Size and Growth Forecasts (Value)
- 5.1 By Product Form
- 5.1.1 Solid (Briquettes/Powder)
- 5.1.2 Liquid Solution
- 5.2 By End-user Industry
- 5.2.1 Mining
- 5.2.2 Chemicals
- 5.2.3 Other End-User Industries
- 5.3 By Geography
- 5.3.1 Asia-Pacific
- 5.3.1.1 China
- 5.3.1.2 Australia and New Zealand
- 5.3.1.3 Indonesia
- 5.3.1.4 Rest of Asia-Pacific
- 5.3.2 North America
- 5.3.2.1 United States
- 5.3.2.2 Canada
- 5.3.2.3 Mexico
- 5.3.3 Europe
- 5.3.3.1 Russia
- 5.3.3.2 CIS (ex-Russia)
- 5.3.3.3 Rest of Europe
- 5.3.4 South America
- 5.3.4.1 Brazil
- 5.3.4.2 Peru
- 5.3.4.3 Argentina
- 5.3.4.4 Rest of South America
- 5.3.5 Middle-East and Africa
- 5.3.5.1 Ghana
- 5.3.5.2 Sudan
- 5.3.5.3 South Africa
- 5.3.5.4 Rest of Middle-East and Africa
- 5.3.1 Asia-Pacific
6 Competitive Landscape
- 6.1 Market Concentration
- 6.2 Strategic Moves
- 6.3 Market Share (%)/Ranking Analysis
- 6.4 Company Profiles (includes Global level Overview, Market level overview, Core Segments, Financials as available, Strategic Information, Market Rank/Share for key companies, Products and Services, and Recent Developments)
- 6.4.1 Anhui Shuguang Chemical Group
- 6.4.2 Australian Gold Reagents Pty Ltd
- 6.4.3 Changsha Hekang Chemical Co. Ltd
- 6.4.4 CSBP (Wesfarmers Chemicals, Energy & Fertilisers)
- 6.4.5 CyPlus GmbH
- 6.4.6 Draslovka
- 6.4.7 Hebei Chengxin Group Co. Ltd
- 6.4.8 JINCHENG HONGSHENG CHEMICAL CO. LTD
- 6.4.9 Orica Limited
- 6.4.10 Taekwang Industrial Co. Ltd
- 6.4.11 Tongsuh Petrochemical Corp. Ltd (Asahi Kasei Corporation)
- 6.4.12 Unigel
- 6.4.13 Ynnovate Sanzheng (Yingkou) Fine Chemicals Co. Ltd
7 Market Opportunities and Future Outlook
- 7.1 White-space and Unmet-Need Assessment
 全球氰化钠市场报告:2021-2032年历史表现及预测
 全球固体氰化钠市场研究报告(2026版)
 2026-2034年全球氰化钠市场规模、份额、趋势和成长分析报告
 氰化钠市场按产品类型、纯度等级、应用和分销管道划分,全球预测(2026-2032年)
 氰化钠市场规模、份额及成长分析(依产品类型、产业垂直领域、销售管道及地区划分)-2026-2033年产业预测氰化钠市场-2025-2030年预测
 固体氰化钠:全球市占率及排名、总收入及需求预测(2025-2031年)
 非洲氰化钠市场 -市场占有率分析、行业趋势和统计、成长预测(2025-2030 年)
 氰化钠市场:依产品类型、依最终用户、按地区