


 |
市场调查报告书
商品编码
1911331
共用办公空间:市场占有率分析、产业趋势与统计、成长预测(2026-2031)Shared Office Spaces - Market Share Analysis, Industry Trends & Statistics, Growth Forecasts (2026 - 2031) |
||||||
※ 本网页内容可能与最新版本有所差异。详细情况请与我们联繫。
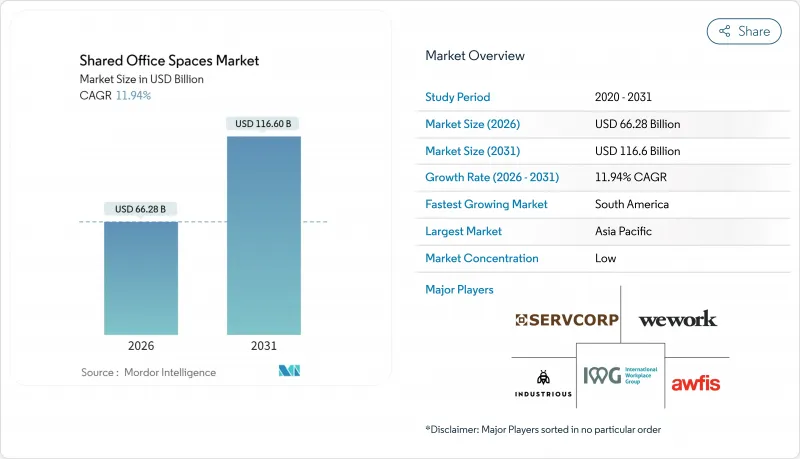
共用办公空间市场预计将从 2025 年的 592 亿美元成长到 2026 年的 662.8 亿美元,到 2031 年达到 1,166 亿美元,2026 年至 2031 年的复合年增长率为 11.94%。
企业加速采用混合办公模式、投资者对轻资产模式的兴趣以及向区域城市的稳步扩张,共同推动了这一成长。营运商正将重心转向收益分成伙伴关係,以扩大网路覆盖范围并控制租赁义务。对健康认证和数据驱动型空间的技术投资提高了客户留存率,但现有城市中心的供应过剩持续挤压着利润率。亚太地区是成长的主要驱动力,而南美洲则最具快速成长潜力,因为新进业者正在吸引首次使用弹性办公空间的使用者。
全球共用办公空间市场趋势与洞察
无论在大公司或小公司,混合弹性工作安排都正迅速变得越来越普遍。
混合办公和弹性办公模式正迅速受到大中小型企业的青睐。世邦魏理仕 (CBRE) 的一项调查显示,超过 92% 的受访企业已实施混合办公模式,其中三分之二的企业希望员工每週至少到办公室工作三天。这种转变使得长期租赁合约成为潜在的风险,而灵活的合约条款则成为一项策略性需求。企业纷纷转向共用办公空间,以便根据员工出勤率的波动调整座位数量,并消除閒置空间带来的成本。这种模式不仅降低了成本,也有助于人才招聘,因为员工越来越重视工作地点的柔软性。能够保证在多个城市提供最高安全等级和始终如一的服务品质的营运商,其需求量正在激增。
全球共享办公室营运商正向新兴城市和区域城市扩张
为了满足日益增长的需求,全球共享办公空间营运商正加速向新兴城市和区域城镇扩张。 2024年,IWG主要透过合作开设了867个办公地点,营收成长至33亿英镑(41亿美元)。该公司专注于轻资产交易,将更多资金投入装修而非租赁。这种模式提高了投资报酬率(ROIC),并支持了郊区和区域城镇的发展,这些地区的优质共同工作空间历来稀缺。分散的办公地点使IWG能够减少其远距办公团队的通勤时间,并从传统的市中心模式转向轴辐式网路。这项策略不仅保护了营运商免受市中心潜在空置风险的影响,也满足了当地中小企业未被满足的需求。
高昂的营运和内部成本降低了营运商的盈利。
在弹性办公空间市场,高昂的营运和装修成本正严重影响营运商的盈利。 2024年第二季度,WeWork的运转率降至67%,固定成本超过收入,引发了人们对其偿付能力的担忧。该公司的高端装修、企业级IT基础设施和一流服务都需要大量的资本投入。当出现空置时,这些成本尤其沉重。营运商正日益寻求房东的合作以减轻这一资本负担,但小规模的供应商却难以筹集资金进行现代化整修。这项挑战可能会加速市场退出,并进一步加剧产业整合。
细分市场分析
截至2025年,共享办公空间占共用办公市场总量的59.12%。其成功归功于即用型环境、社区计画以及对试点团队和新市场进入者而言的高性价比。企业倾向于选择共享办公中心内的专属套间,以兼顾隐私和协作机会。对于那些需要固定期限、配备齐全的私人空间的企业而言,服务式办公室和行政套房仍然需求旺盛。
混合办公和虚拟办公室解决方案将成为成长最快的细分市场,2026 年至 2031 年的复合年增长率将达到 12.75%。这些解决方案整合了基于云端的办公桌预订、去中心化会员制和按需会议额度,反映了混合办公通讯协定的广泛应用。 WeWork 与 Vast Coworking Group 合作,在郊区部署 75 个无需租赁承诺的办公地点,体现了营运商向网路化服务交付模式的转变。这些模式使企业能够根据计划进度灵活调整其办公空间布局,进而提升共用办公空间市场的价值提案。
区域分析
亚太地区预计到2025年将占全球收入的37.10%,这主要得益于快速的都市化和政府支持的创新中心。印度的共享办公空间(以Smartworks和IndiQube等为主导)运转率接近饱和,尤其是在向二线城市扩张之后。在中国,共用办公空间被纳入智慧城市规划。在东南亚,游客和数位游民的兴起促使该地区的营运商组织具有文化意义的社区活动,作为其网路扩大策略的一部分。
北美是第二大市场,但情况较为复杂。城市地区空置率上升导致租金下降,迫使营运商增加配套设施以维持租金。同时,郊区蓬勃发展,美国45%的弹性办公空间位于中央商务区(CBD)以外,满足了人们缩短通勤时间的需求。企业客户越来越多地将郊区空间用作卫星办公室,从而在传统住宅扩展业务网路。
南美洲成长最快,预计到2031年复合年增长率将达到13.28%。巴西是推动这一成长的主要力量,但哥伦比亚和智利的次市场也吸引了首次进入拉丁美洲的跨国公司日益浓厚的兴趣。儘管汇率波动构成风险,但业主正透过管理协议与营运商合作,以降低准入风险。在欧洲,成长稳定但较为温和。流动性框架和跨境GDPR合规性正在支撑成长,尤其是在拥有稳定远距工作签证政策的大都会地区。
其他福利
- Excel格式的市场预测(ME)表
- 3个月的分析师支持
目录
第一章 引言
- 研究假设和市场定义
- 调查范围
第二章调查方法
第三章执行摘要
第四章 市场情势
- 市场概览
- 市场驱动因素
- 混合式和灵活式工作安排在大中小型企业中都迅速普及。
- 全球共享办公室营运商正向新兴城市和区域城市扩张
- 来自Start-Ups、自由工作者和数位游牧者的需求不断增长
- 投资者对共用办公室投资组合的兴趣在于将其视为一种具有韧性的资产类别。
- 租户更倾向于选择获得健康认证、配备科技设施且以社区主导的空间。
- 市场限制
- 高昂的营运和内部成本正在降低营运商的盈利。
- 成熟市场供应过剩的风险及相关的价格压力
- 经济波动影响中小企业和Start-Ups运转率的稳定性
- 价值/供应链分析
- 概述
- 房地产开发商和资产所有者——关键的定量和定性见解
- 工作空间设计技术顾问—关键的定量和定性见解
- 模组化家具和智慧办公室解决方案提供者—关键定量和定性洞察
- 产业内的政府法规和政策
- 共享办公室房地产市场的技术创新
- 对办公室房地产行业关键指标(供应量、租金、价格、运转率/空置率(%))的深入分析
- 远距办公如何影响空间需求
- 波特五力模型
- 供应商的议价能力
- 买方的议价能力
- 新进入者的威胁
- 替代品的威胁
- 竞争对手之间的竞争
第五章 市场规模及成长预测(金额:美元)
- 按类型
- 共同工作空间
- 服务式办公室/行政套房
- 其他(混合办公、虚拟办公)
- 按行业
- 资讯科技(IT 和 ITES)
- 银行、金融服务和保险 (BFSI)
- 商业咨询和专业服务
- 其他服务(零售、生命科学、能源、法律服务)
- 按最终用途
- 自由工作者
- 公司
- Start-Ups及其他
- 按地区
- 北美洲
- 美国
- 加拿大
- 墨西哥
- 南美洲
- 巴西
- 南美洲其他地区
- 欧洲
- 英国
- 德国
- 法国
- 义大利
- 西班牙
- 其他欧洲
- 中东和非洲
- 沙乌地阿拉伯
- 阿拉伯聯合大公国
- 其他中东和非洲地区
- 亚太地区
- 中国
- 印度
- 日本
- 韩国
- 澳洲
- 印尼
- 亚太其他地区
- 北美洲
第六章 竞争情势
- 市场集中度
- 策略趋势
- 公司简介
- IWG plc(Regus, Spaces)
- WeWork Inc.
- Industrious
- Servcorp Ltd.
- Awfis Space Solutions
- Smartworks
- Ucommune International
- JustCo
- Convene
- Knotel
- Impact Hub
- Office Evolution
- Serendipity Labs
- 扩充型(原名 Novel Coworking)
- CommonGrounds Workplace
- The Executive Centre
- Bizspace
- Workbar
- WorkSuites
- Office Partners 360
第七章 市场机会与未来展望
The shared office spaces market is expected to grow from USD 59.20 billion in 2025 to USD 66.28 billion in 2026 and is forecast to reach USD 116.6 billion by 2031 at 11.94% CAGR over 2026-2031.
Rapid enterprise adoption of hybrid work, investor appetite for asset-light models, and steady expansion into secondary cities fuel this momentum. Operators are pivoting toward revenue-sharing partnerships that limit lease liabilities while extending network reach. Technology investments in wellness-certified, data-driven spaces deepen client stickiness, even as oversupply in legacy urban cores pressures margins. Asia-Pacific drives headline growth, while South America offers the steepest runway for new entrants courting first-time flexible-workspace users.
Global Shared Office Spaces Market Trends and Insights
Rapid Adoption of Hybrid and Flexible Work Models Across Corporations and SMEs
Hybrid and flexible work models are becoming increasingly prevalent among corporations and SMEs. Over 92% of clients surveyed by CBRE have adopted hybrid work schedules, with two-thirds anticipating their staff will be onsite a minimum of three days each week. This transition has turned extended leases into potential liabilities, making flexible terms a strategic imperative. Companies are gravitating towards shared office spaces, allowing them to adjust seating based on fluctuating attendance and reducing costs associated with unused space. This setup not only cuts costs but also attracts talent, as employees increasingly value location flexibility. Operators who can ensure top-tier security and consistent quality across different cities are witnessing a surge in demand.
Expansion of Global Co-working Operators into Emerging and Secondary Cities
Global co-working operators are increasingly expanding into emerging and secondary cities to meet growing demand. In 2024, IWG increased its revenue to GBP3.3 billion (USD 4.1 billion) by opening 867 sites, primarily through partnerships. By focusing on asset-light deals, the company allocates more capital to fit-outs rather than leases. This approach improves their Return on Invested Capital (ROIC) and supports their growth into suburbs and tier-II metros, areas previously lacking premium co-working spaces. With distributed locations, IWG reduces commute times for remote-first teams, shifting from a traditional downtown-focused model to a hub-and-spoke network. This strategy not only protects operators from potential vacancies in central business districts but also addresses the unmet needs of local SMEs.
High Operational and Fit-out Costs Reducing Operator Profitability
High operational and fit-out costs are significantly impacting the profitability of operators in the flexible workspace market. In Q2 2024, WeWork's occupancy dipped to 67%, raising concerns about its solvency as fixed costs eclipsed its billings. The company's premium interiors, enterprise-level IT, and top-tier services demand hefty capital expenditures. These costs weigh heavily, especially when seats remain unoccupied. While operators are increasingly partnering with landlords to alleviate these capital burdens, smaller providers face challenges in financing modern refurbishments. This struggle could hasten their exit from the market and fuel further consolidation.
Other drivers and restraints analyzed in the detailed report include:
- Rising Demand from Start-ups, Freelancers, and Digital Nomads
- Investor Interest in Shared Office Portfolios as a Resilient Asset Class
- Oversupply Risks in Mature Markets Leading to Price Pressures
For complete list of drivers and restraints, kindly check the Table Of Contents.
Segment Analysis
Co-working accounted for 59.12% of the shared office spaces market share in 2025. Its success stems from turnkey access, community programming, and cost efficiency for pilot teams or market entries. Enterprises favor dedicated suites within co-working hubs to balance privacy with collaboration opportunities. Serviced offices and executive suites maintain relevance among firms needing fully equipped private spaces on sealed terms.
Hybrid and virtual solutions form the fastest-growing cohort at a 12.75% CAGR as 2026-2031 unfolds. They blend cloud-based desk bookings, distributed memberships, and on-demand meeting credits, mirroring wider hybrid-work protocols. WeWork's alliance with Vast Coworking Group to onboard 75 suburban sites without signing leases demonstrates operator migration toward networked service delivery. These models let companies toggle physical presence as project pipelines ebb and flow, reinforcing the value proposition of the shared office spaces market.
The Shared Office Spaces Market Report is Segmented by Type (Co-Working Space, Serviced Offices/Executive Suites and Others), by Sector (Information Technology, Business Consulting & Professional Service, and More), by End Use (Freelancers, Enterprises and Start Ups and Others), and by Geography (North America, South America, Europe, Asia-Pacific and More). The Market Forecasts are Provided in Terms of Value (USD).
Geography Analysis
In 2025, the Asia-Pacific region contributed 37.10% of global revenue, driven by rapid urbanization and government-supported innovation hubs. Co-working spaces in India, led by companies like Smartworks and IndiQube, saw occupancy levels near full capacity, especially as they expanded into tier-II cities. In China, shared offices are part of the country's smart-city plans. Southeast Asia is benefiting from an increase in tourists and digital nomads. Operators in the region are organizing culturally relevant community events to strengthen their network expansion strategies.
North America, while ranking second in value, faces mixed conditions. Downtown areas are experiencing lower prices due to rising vacancies, prompting operators to improve amenities to maintain rates. Suburbs, however, are performing well; 45% of flexible workspaces in the U.S. are now located outside central business districts, meeting the demand for shorter commutes. Enterprise clients are increasingly using suburban spaces as satellite offices, leading to the growth of networks in previously residential areas.
South America is growing the fastest, with a 13.28% CAGR projected through 2031. Brazil is leading this growth, but secondary markets in Colombia and Chile are also seeing increased interest from multinationals entering Latin America for the first time. Although currency volatility poses a risk, landlords are partnering with operators through management agreements to reduce entry risks. In Europe, growth is steady but moderate. Mobility frameworks and compliance with cross-border GDPR support this growth, particularly in capitals with stable policies for remote work visas.
- IWG plc (Regus, Spaces)
- WeWork Inc.
- Industrious
- Servcorp Ltd.
- Awfis Space Solutions
- Smartworks
- Ucommune International
- JustCo
- Convene
- Knotel
- Impact Hub
- Office Evolution
- Serendipity Labs
- Expansive (-formerly Novel Coworking)
- CommonGrounds Workplace
- The Executive Centre
- Bizspace
- Workbar
- WorkSuites
- Office Partners 360
Additional Benefits:
- The market estimate (ME) sheet in Excel format
- 3 months of analyst support
TABLE OF CONTENTS
1 Introduction
- 1.1 Study Assumptions & Market Definition
- 1.2 Scope of the Study
2 Research Methodology
3 Executive Summary
4 Market Landscape
- 4.1 Market Overview
- 4.2 Market Drivers
- 4.2.1 Rapid adoption of hybrid and flexible work models across corporates and SMEs
- 4.2.2 Expansion of global co-working operators into emerging and secondary cities
- 4.2.3 Rising demand from start-ups, freelancers, and digital nomads
- 4.2.4 Investor interest in shared office portfolios as resilient asset class
- 4.2.5 Increasing tenant preference for wellness-certified, tech-enabled, and community-driven spaces
- 4.3 Market Restraints
- 4.3.1 High operational and fit-out costs reducing operator profitability
- 4.3.2 Oversupply risks in mature markets leading to price pressures
- 4.3.3 Economic volatility impacting occupancy stability for SMEs and start-ups
- 4.4 Value / Supply-Chain Analysis
- 4.4.1 Overview
- 4.4.2 Real Estate Developers and Asset Owners - Key Quantitative and Qualitative Insights
- 4.4.3 Workspace Design and Technology Consultants - Key Quantitative and Qualitative Insights
- 4.4.4 Modular Furniture and Smart Office Solutions Providers - Key Quantitative and Qualitative Insights
- 4.5 Government Regulations and Initiatives in the Industry
- 4.6 Technological Innovations in the Shared Office Space Real Estate Market
- 4.7 Insights into the Key Office Real Estate Industry Metrics (Supply, Rentals, Prices, Occupancy/Vacancy (%))
- 4.8 Impact of Remote Working on Space Demand
- 4.9 Porter's Five Forces
- 4.9.1 Bargaining Power of Suppliers
- 4.9.2 Bargaining Power of Buyers
- 4.9.3 Threat of New Entrants
- 4.9.4 Threat of Substitutes
- 4.9.5 Intensity of Competitive Rivalry
5 Market Size & Growth Forecasts (Value USD)
- 5.1 By Type
- 5.1.1 Co-Working Space
- 5.1.2 Serviced offices / Executive suites
- 5.1.3 Others (Hybrid, Virtual Office)
- 5.2 By Sector
- 5.2.1 Information Technology (IT and ITES)
- 5.2.2 BFSI (Banking, Financial Services and Insurance)
- 5.2.3 Business Consulting & Professional Service
- 5.2.4 Other Services (Retail, Lifesciences, Energy, Legal Services)
- 5.3 By End Use
- 5.3.1 Freelancers
- 5.3.2 Enterprises
- 5.3.3 Start Ups and Others
- 5.4 By Geography
- 5.4.1 North America
- 5.4.1.1 United States
- 5.4.1.2 Canada
- 5.4.1.3 Mexico
- 5.4.2 South America
- 5.4.2.1 Brazil
- 5.4.2.2 Rest of South America
- 5.4.3 Europe
- 5.4.3.1 United Kingdom
- 5.4.3.2 Germany
- 5.4.3.3 France
- 5.4.3.4 Italy
- 5.4.3.5 Spain
- 5.4.3.6 Rest of Europe
- 5.4.4 Middle East and Africa
- 5.4.4.1 Saudi Arabia
- 5.4.4.2 United Arab Emirates
- 5.4.4.3 Rest of Middle East and Africa
- 5.4.5 Asia-Pacific
- 5.4.5.1 China
- 5.4.5.2 India
- 5.4.5.3 Japan
- 5.4.5.4 South Korea
- 5.4.5.5 Australia
- 5.4.5.6 Indonesia
- 5.4.5.7 Rest of Asia-Pacific
- 5.4.1 North America
6 Competitive Landscape
- 6.1 Market Concentration
- 6.2 Strategic Moves
- 6.3 Company Profiles {(includes Global level Overview, Market level overview, Core Segments, Financials as available, Strategic Information, Products & Services, and Recent Developments)}
- 6.3.1 IWG plc (Regus, Spaces)
- 6.3.2 WeWork Inc.
- 6.3.3 Industrious
- 6.3.4 Servcorp Ltd.
- 6.3.5 Awfis Space Solutions
- 6.3.6 Smartworks
- 6.3.7 Ucommune International
- 6.3.8 JustCo
- 6.3.9 Convene
- 6.3.10 Knotel
- 6.3.11 Impact Hub
- 6.3.12 Office Evolution
- 6.3.13 Serendipity Labs
- 6.3.14 Expansive (-formerly Novel Coworking)
- 6.3.15 CommonGrounds Workplace
- 6.3.16 The Executive Centre
- 6.3.17 Bizspace
- 6.3.18 Workbar
- 6.3.19 WorkSuites
- 6.3.20 Office Partners 360
7 Market Opportunities & Future Outlook
 2026年全球共享办公桌市场报告2026年全球共享办公空间市场报告2026年全球共享办公空间管理软体市场报告2026年全球办公空间市场报告
 欧洲共享办公空间:市场占有率分析、产业趋势与统计、成长预测(2026-2031)
 专用弹性办公空间市场:全球产业分析(按规模、份额、成长和类型/应用划分)、区域洞察及2026-2034年预测
 日本共享办公空间市场规模、份额、趋势及预测(按类型、用途、最终用户和地区划分),2026-2034年
 共享办公空间市场-全球产业规模、份额、趋势、机会与预测:按设施、目标群体、附加价值服务、地区和竞争格局划分,2021-2031年
 共享办公空间市场:2025-2032 年全球预测(按服务类型、会员类型、组织规模、营运模式和产业重点)共享办公设施市场-全球产业规模、份额、趋势、机会及预测,依空间类型、商业模式、应用、地区及竞争细分,2020-2030 年预测