


 |
市场调查报告书
商品编码
1911758
马来西亚资料中心:市场占有率分析、产业趋势与统计、成长预测(2026-2031)Malaysia Data Center - Market Share Analysis, Industry Trends & Statistics, Growth Forecasts (2026 - 2031) |
||||||
※ 本网页内容可能与最新版本有所差异。详细情况请与我们联繫。
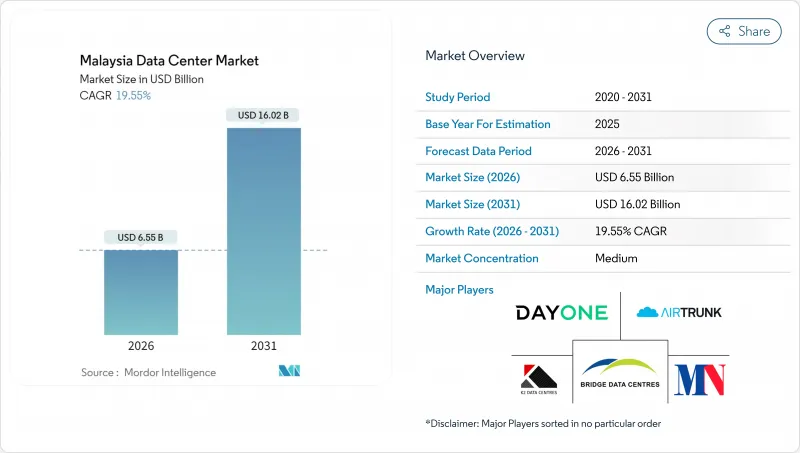
马来西亚资料中心市场在 2025 年的价值为 54.8 亿美元,预计到 2031 年将达到 160.2 亿美元,高于 2026 年的 65.5 亿美元。
预计在预测期(2026-2031 年)内,复合年增长率将达到 19.55%。
电力需求将成长得更快,IT负载容量预计将从1.53吉瓦飙升至6.43吉瓦,复合年增长率高达33.24%,主要得益于人工智慧工作负载推动的机架密度增加。市场占有率和估计值均以兆瓦(MW)为单位计算和报告。政府激励措施、超大规模资料中心业者资料中心902亿马币(203亿美元)的投资承诺以及海底电缆的增加,正在巩固马来西亚作为东南亚新兴数位中心的地位。新山正在吸收新加坡溢出的需求,而赛城则受益于多媒体超级走廊的基础建设。营运商正面临电费上涨和供水限制的双重挑战,因此必须制定可再生能源筹资策略。
马来西亚资料中心市场趋势与洞察
超大规模云端采用率上升
谷歌斥资20亿美元的区域中心、Oracle65亿美元的计画以及微软22亿美元的扩建项目,正透过将机架功率密度推至15kW以上,重新定义容量需求。这些大型企划需要专用冷却系统、冗余变电站和高速互连,而这些在传统的託管设施中难以实现。杨忠礼集团(YTL)与英伟达(NVIDIA)价值马币令吉(约22.5亿美元)的合作,标誌着国内业者正向人工智慧赋能的园区转型。随着柔佛州和森美兰州业者对海底电缆直接连接站点的竞争加剧,土地和电力采购週期也日益紧张。建筑供应链正在扩展以适应超大规模资料中心业者的设计标准,这为本地工程、采购和施工(EPC)公司创造了机会。长期合约也保障了可再生能源的需求,加速了国内太阳能发电设施的扩张。
金融科技和电子商务数位化正在蓬勃发展
Touch 'n Go 电子钱包、DuitNow 以及区域跨境支付方案需要亚毫秒级的处理速度,而传统银行资料中心无法满足这项需求。到 2023 年,数位钱包将占线上交易的 39%,这将推动对可扩展计算和即时诈欺检测节点的需求。随着第三方金融科技应用的激增,开放银行 API 也进一步推动了流量的激增。吉隆坡和槟城的边缘设施降低了人口密集城区的延迟,而柔佛州的灾害復原节点则确保了符合马来西亚国家银行的弹性准则。不断成长的电子商务基础正推动企业转向云端原生架构,进一步巩固了马来西亚资料中心市场的上升趋势。
电费波动加剧
2024年的收费系统调整导致工业电费上涨14.2%,其中资料中心等超高压用户受到的影响最大。取消补贴意味着电价现在与天然气价格挂钩,使业者面临大宗商品市场波动的风险。可再生能源供应难以满足需求,导致现货价格居高不下。营运商正透过现场太阳能和电池计划进行对冲,但资本支出不断增加,计划工期也在延长。关于未来电价上涨的合约条款模糊不清,也使超大规模资料中心业者的整体拥有成本(TCO)模型变得更加复杂。
细分市场分析
预计中型资料中心将于2026年投入运营,年复合成长率将达到30.20%,成长超过其他规模的资料中心,因为企业和内容供应商都在寻求边缘面积友善的资料中心布局,以支援区域5G网路的部署。大型资料中心占马来西亚资料中心市场占有率的24.18%,主要得益于超大规模资料中心业者资料中心营运商预租20-50兆瓦的电力单元。小规模资料中心将专注于灾害復原应用,而超大型和巨型资料中心园区将满足人工智慧训练的需求。
马来西亚资料中心市场青睐模组化建设,允许以4-6兆瓦为单位逐步增加容量,使营运商能够有效管理资本投资。中型资料中心采用节热器冷却技术,将电源使用效率(PUE)降低至1.3,达到绿色税优惠的阈值。大型资料中心在海底电缆站附近仍有优势,因为那里有足够的土地建造100兆瓦的变电站。电网容量的限制限制着大型资料中心园区的发展,但即将进行的132千伏特电网升级预计将在未来扩大电力供应。
到2025年,三级服务将占总营收的75.88%,维持34.10%的复合年增长率,成为成长最快的服务商,这印证了企业在无需支付四级服务溢价的情况下,仍能获得并发维护能力的偏好。随着中小企业转向云端服务和託管平台,一级和二级服务的面积正在萎缩。
营运商正透过增加冗余配电路径和柴油旋转式UPS系统,将二级资料中心维修到三级,从而提高机架容量。金融和电子商务工作负载需要99.982%的可用性,符合三级标准。马来西亚通讯和多媒体委员会的监管指南强化了这项用于关键数据在地化的中级标准。四级资料中心目前仍主要面向核心银行和国防工作负载,但新建设的成本阻碍了其广泛应用。
马来西亚资料中心市场报告按资料中心规模(大型、超大型、中型、巨型、小规模)、等级(Tier 1-2、Tier 3、Tier 4)、资料中心类型(超大规模/自建、企业/边缘、託管)、最终用户(银行、金融服务和保险 (BFSI)、IT 和 ITES、电子商务、政府等)以及赛城热点(吉隆坡、金融服务等)进行细分。市场预测以 IT 负载容量(兆瓦)为单位。
其他福利:
- Excel格式的市场预测(ME)表
- 3个月的分析师支持
目录
第一章 引言
- 研究假设和市场定义
- 调查范围
第二章调查方法
第三章执行摘要
第四章 市场情势
- 市场概览
- 市场驱动因素
- 超大规模云端采用率上升
- 金融科技与电子商务数位化浪潮
- 快速部署海底电缆可改善网路连接
- 政府为绿色资讯通信技术投资提供税收优惠
- 槟城-柔佛工业走廊的需求优势
- 规模达100-200兆瓦的领先人工智慧培训丛集园区
- 市场限制
- 电费波动剧烈
- 漫长的三级/四级审核週期
- 马来西亚缺乏低碳电力购电协议
- 认证执行时间工程师短缺
- 市场展望
- IT负载能力
- 高架楼层面积
- 託管收入
- 预装机架
- 机架空间利用率
- 海底电缆
- 主要行业趋势
- 智慧型手机用户数量
- 每部智慧型手机的数据流量
- 行动资料通讯速度
- 宽频资料通讯速度
- 光纤连接网路
- 法律规范
- 价值炼和通路分析
- 波特五力分析
- 新进入者的威胁
- 供应商的议价能力
- 买方的议价能力
- 替代品的威胁
- 竞争对手之间的竞争
第五章 市场规模及成长预测(兆瓦)
- 按资料中心规模
- 大规模
- 大规模
- 中号
- 百万
- 小规模
- 依层级类型
- 一级和二级
- 三级
- 第四级
- 依资料中心类型
- 超大规模/内部建设
- 企业/边缘运算
- 搭配
- 未使用的
- 运作中
- 零售共址
- 批发託管
- 最终用户
- BFSI
- 资讯科技与资讯科技服务
- 电子商务
- 政府机构
- 製造业
- 媒体与娱乐
- 沟通
- 其他最终用户
- 透过热点
- 吉隆坡
- 赛城
- 新山
- 马来西亚其他地区
第六章 竞争情势
- 市场集中度
- 策略趋势
- 市占率分析
- 公司简介
- Bridge Data Centers(Chindata Group)
- MN Holdings Bhd(in partnership with Shanghai DC-Science Co Ltd.)
- DayOne(GDS Holdings Ltd.)
- K2 Strategic(Kuok Group)
- AirTrunk Operating Pty Ltd.
- AIMS Data Centre Sdn. Bhd.(DigitalBridge Group, Inc.)
- Telekom Malaysia Berhad
- NTT Ltd.
- CSF Group
- Alibaba Cloud
- Keppel Data Center
- Open DC Sdn Bhd
- SAP SE
- Vantage Data Centers
- Telstra Group Limited
第七章 市场机会与未来展望
The Malaysia data center market was valued at USD 5.48 billion in 2025 and estimated to grow from USD 6.55 billion in 2026 to reach USD 16.02 billion by 2031, at a CAGR of 19.55% during the forecast period (2026-2031).
Power demand rises even faster, with IT load capacity projected to jump from 1.53 GW to 6.43 GW, a 33.24% CAGR, as artificial-intelligence workloads drive higher rack densities. The market segment shares and estimates are calculated and reported in terms of MW. Government incentives, hyperscaler commitments of MYR 90.2 billion (USD 20.3 billion), and submarine-cable additions reinforce Malaysia's status as Southeast Asia's new digital hub. Johor Bahru captures Singapore overflow demand while Cyberjaya benefits from the Multimedia Super Corridor infrastructure. Operators confront rising electricity tariffs and water supply constraints, prompting the need for renewable energy procurement strategies.
Malaysia Data Center Market Trends and Insights
Rising hyperscale cloud deployments
Google's USD 2 billion region, Oracle's USD 6.5 billion plan, and Microsoft's USD 2.2 billion expansion redefine capacity needs by pushing rack power densities beyond 15 kW. These mega-projects require specialized cooling, redundant substations, and high-speed interconnection, which traditional colocation facilities seldom offer. YTL's MYR 10 billion (USD 2.25 billion) NVIDIA alliance signals a shift among domestic players toward AI-ready campuses. Land and power procurement cycles are tightening as operators compete for sites in Johor and Negeri Sembilan with direct submarine cable access. The construction supply chain scales up to meet hyperscaler design standards, opening opportunities for local engineering, procurement, and construction firms. Long-term contracts also lock in renewable energy demand, which accelerates the national solar build-out.
Surge in FinTech and e-commerce digitalization
Touch 'n Go eWallet, DuitNow, and regional cross-border payment schemes require sub-millisecond processing that legacy bank data centers cannot sustain. Digital wallets captured 39% of online-transaction volume in 2023, amplifying demand for scalable compute and real-time fraud analytics nodes. Open-banking APIs further intensify traffic spikes as third-party fintech applications proliferate. Edge facilities in Kuala Lumpur and Penang shorten latency for densely populated urban centers, while disaster-recovery nodes in Johor ensure compliance with Bank Negara Malaysia's resilience guidelines. The expanding e-commerce base is pushing merchants toward cloud-native architectures, reinforcing the upward trend in the Malaysian data center market.
High electricity tariff volatility
Tariff restructuring increased industrial rates by 14.2% in 2024, with ultra-high-voltage users, such as data centers, being hit hardest. Subsidy removal ties prices to natural-gas benchmarks, exposing operators to fluctuations in the commodity market. Renewable supply lags demand, keeping spot prices elevated. Operators hedge through on-site solar and battery-storage projects, but capital expenditure rises and project timelines lengthen. Contract ambiguity around future tariff escalations complicates hyperscaler total-cost-of-ownership models.
Other drivers and restraints analyzed in the detailed report include:
- Rapid submarine-cable landings boosting connectivity
- Shortage of accredited Uptime-qualified engineers
For complete list of drivers and restraints, kindly check the Table Of Contents.
Segment Analysis
Medium facilities are expected to open in 2026 with a 30.20% CAGR forecast, outpacing other tiers as enterprises and content providers seek edge-appropriate footprints that support regional 5G rollouts. Large facilities account for 24.18% of Malaysia's data center market share, driven by hyperscaler pre-lease commitments that secure power blocks of 20-50 MW. Small sites specialize in disaster-recovery niches, while mega and massive campuses cater to AI training needs.
The Malaysian data center market favors modular builds that add capacity in 4-6 MW increments, allowing operators to manage capital deployment effectively. Medium halls integrate economizer cooling, cutting power usage effectiveness to 1.3 and meeting green tax incentive thresholds. Large-site dominance persists near submarine cable stations, where land parcels can accommodate 100 MW substations. Power-grid constraints cap mega-campus growth, but upcoming 132 kV upgrades may unlock future supply.
Tier 3 captured 75.88% of the revenue in 2025 and maintains the top growth rate at a 34.10% CAGR, confirming enterprises' preference for concurrent maintainability without Tier 4 premiums. Tier 1-2 footprints shrink as SMEs migrate to cloud and colocation platforms.
Operators retrofit Tier 2 sites to Tier 3 by adding redundant distribution paths and diesel-rotary UPS systems, unlocking higher rack rates. Financial and e-commerce workloads demand 99.982% availability, aligning with Tier 3 specifications. Regulatory guidance from the Malaysian Communications and Multimedia Commission reinforces this mid-tier standard for the localization of critical data. Tier 4 remains a niche for core banking and defense workloads, but new-build economics deter widespread adoption.
The Malaysia Data Center Market Report is Segmented by Data Center Size (Large, Massive, Medium, Mega, and Small), Tier Type (Tier 1 and 2, Tier 3, and Tier 4), Data Center Type (Hyperscale/Self-built, Enterprise/Edge, and Colocation), End User (BFSI, IT and ITES, E-Commerce, Government, and More), and Hotspot (Kuala Lumpur, Cyberjaya, and More). The Market Forecasts are Provided in Terms of IT Load Capacity (MW).
List of Companies Covered in this Report:
- Bridge Data Centers (Chindata Group)
- MN Holdings Bhd (in partnership with Shanghai DC-Science Co Ltd.)
- DayOne (GDS Holdings Ltd.)
- K2 Strategic (Kuok Group)
- AirTrunk Operating Pty Ltd.
- AIMS Data Centre Sdn. Bhd. (DigitalBridge Group, Inc.)
- Telekom Malaysia Berhad
- NTT Ltd.
- CSF Group
- Alibaba Cloud
- Keppel Data Center
- Open DC Sdn Bhd
- SAP SE
- Vantage Data Centers
- Telstra Group Limited
Additional Benefits:
- The market estimate (ME) sheet in Excel format
- 3 months of analyst support
TABLE OF CONTENTS
1 INTRODUCTION
- 1.1 Study Assumptions and Market Definition
- 1.2 Scope of the Study
2 RESEARCH METHODOLOGY
3 EXECUTIVE SUMMARY
4 MARKET LANDSCAPE
- 4.1 Market Overview
- 4.2 Market Drivers
- 4.2.1 Rising hyperscale cloud deployments
- 4.2.2 Surge in FinTech and e-commerce digitalization
- 4.2.3 Rapid submarine cable landings boosting connectivity
- 4.2.4 Government tax incentives for green ICT investments
- 4.2.5 Penang-Johor industrial corridor edge demand
- 4.2.6 AI training clusters driving 100-200 MW campuses
- 4.3 Market Restraints
- 4.3.1 High electricity tariff volatility
- 4.3.2 Lengthy Tier 3/Tier 4 approval cycles
- 4.3.3 Scarcity of low-carbon power PPAs in Malaysia
- 4.3.4 Shortage of accredited Uptime-qualified engineers
- 4.4 Market Outlook
- 4.4.1 IT Load Capacity
- 4.4.2 Raised Floor Space
- 4.4.3 Colocation Revenue
- 4.4.4 Installed Racks
- 4.4.5 Rack Space Utilization
- 4.4.6 Submarine Cable
- 4.5 Key Industry Trends
- 4.5.1 Smartphone Users
- 4.5.2 Data Traffic Per Smartphone
- 4.5.3 Mobile Data Speed
- 4.5.4 Broadband Data Speed
- 4.5.5 Fiber Connectivity Network
- 4.5.6 Regulatory Framework
- 4.6 Value Chain and Distribution Channel Analysis
- 4.7 Porter's Five Forces Analysis
- 4.7.1 Threat of New Entrants
- 4.7.2 Bargaining Power of Suppliers
- 4.7.3 Bargaining Power of Buyers
- 4.7.4 Threat of Substitutes
- 4.7.5 Competitive Rivalry
5 MARKET SIZE AND GROWTH FORECASTS (MEGAWATT)
- 5.1 By Data Center Size
- 5.1.1 Large
- 5.1.2 Massive
- 5.1.3 Medium
- 5.1.4 Mega
- 5.1.5 Small
- 5.2 By Tier Type
- 5.2.1 Tier 1 and 2
- 5.2.2 Tier 3
- 5.2.3 Tier 4
- 5.3 By Data Center Type
- 5.3.1 Hyperscale/Self-built
- 5.3.2 Enterprise/Edge
- 5.3.3 Colocation
- 5.3.3.1 Non-Utilized
- 5.3.3.2 Utilized
- 5.3.3.2.1 Retail Colocation
- 5.3.3.2.2 Wholesale Colocation
- 5.4 By End User
- 5.4.1 BFSI
- 5.4.2 IT and ITES
- 5.4.3 E-Commerce
- 5.4.4 Government
- 5.4.5 Manufacturing
- 5.4.6 Media and Entertainment
- 5.4.7 Telecom
- 5.4.8 Other End Users
- 5.5 By Hotspot
- 5.5.1 Kuala Lumpur
- 5.5.2 Cyberjaya
- 5.5.3 Johor Bahru
- 5.5.4 Rest of Malaysia
6 COMPETITIVE LANDSCAPE
- 6.1 Market Concentration
- 6.2 Strategic Moves
- 6.3 Market Share Analysis
- 6.4 Company Profiles (includes Global level Overview, Market level overview, Core Segments, Financials as available, Strategic Information, Market Rank/Share for key companies, Products and Services, and Recent Developments)
- 6.4.1 Bridge Data Centers (Chindata Group)
- 6.4.2 MN Holdings Bhd (in partnership with Shanghai DC-Science Co Ltd.)
- 6.4.3 DayOne (GDS Holdings Ltd.)
- 6.4.4 K2 Strategic (Kuok Group)
- 6.4.5 AirTrunk Operating Pty Ltd.
- 6.4.6 AIMS Data Centre Sdn. Bhd. (DigitalBridge Group, Inc.)
- 6.4.7 Telekom Malaysia Berhad
- 6.4.8 NTT Ltd.
- 6.4.9 CSF Group
- 6.4.10 Alibaba Cloud
- 6.4.11 Keppel Data Center
- 6.4.12 Open DC Sdn Bhd
- 6.4.13 SAP SE
- 6.4.14 Vantage Data Centers
- 6.4.15 Telstra Group Limited
7 MARKET OPPORTUNITIES AND FUTURE OUTLOOK
- 7.1 White-space and Unmet-need Assessment
 中东资料中心:市场占有率分析、产业趋势与统计、成长预测(2026-2031)义大利资料中心:市场占有率分析、产业趋势与统计、成长预测(2026-2031 年)印尼资料中心市场占有率分析、产业趋势与统计、成长预测(2026-2031)
 日本资料中心市场报告(按组件、类型、企业规模、最终用户和地区划分,2026-2034 年)
 资料中心乙太网路切换器市场规模、份额和成长分析(按产品、交换连接埠、应用、最终用户、类型和地区划分)-2026-2033年产业预测
 资料中心市场规模、份额和趋势分析报告:按组件、类型、伺服器机架密度、冗余、PUE、设计、层级、企业规模、最终用途、地区和细分市场预测(2026-2033 年)
 小型资料中心市场按产品类型、功率容量、部署应用、冷却技术和地区划分
 资料中心基础设施管理市场规模、份额和成长分析(按产品、功能、资料中心规模、层级类型、资料中心、应用和地区划分)-2026-2033年产业预测
 资料中心市场规模、份额和成长分析(按产品、类型、规模、资料中心冗余、最终用户产业和地区划分)-2026-2033年产业预测
 2025年全球资料中心资讯技术(IT)设备市场报告