


 |
市场调查报告书
商品编码
1937263
电信服务保障:市占率分析、产业趋势与统计、成长预测(2026-2031)Telecom Service Assurance - Market Share Analysis, Industry Trends & Statistics, Growth Forecasts (2026 - 2031) |
||||||
※ 本网页内容可能与最新版本有所差异。详细情况请与我们联繫。
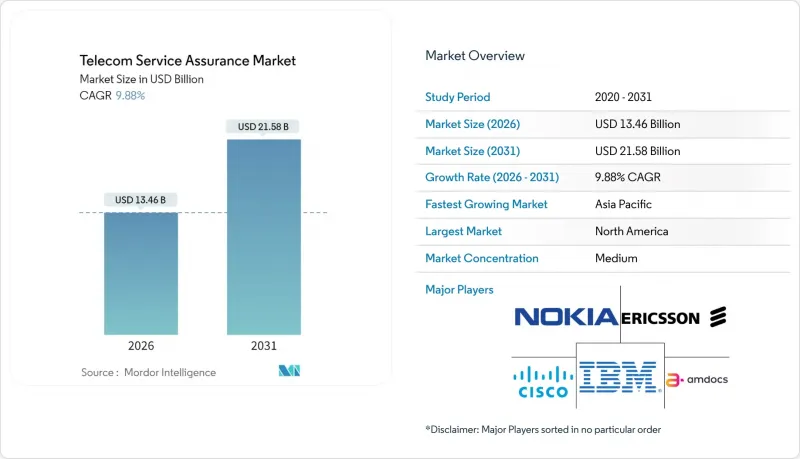
2025 年电信服务保障市场价值为 122.5 亿美元,预计到 2031 年将达到 215.8 亿美元,高于 2026 年的 134.6 亿美元。
预计在预测期(2026-2031 年)内,复合年增长率将达到 9.88%。
随着通讯业者从被动式网路管理模式向主动式网路管理模式转型,日益增长的效能监控需求、5G独立组网部署以及以人工智慧为中心的零接触运维正在推动近期支出成长。私有网路和物联网垂直产业用例正在扩大目标市场,而与超大规模资料中心业者的合作则促使保障架构向云端原生和开放API设计转型。市场竞争强度仍适中,大型跨国企业正透过收购整合相关能力,以增强其端到端产品组合。预计到2025年,北美仍将主导市场,而亚太地区快速的5G部署和企业数位化将推动该地区实现最快成长。从STIR/SHAKEN到欧盟人工智慧法规,日益严格的合规要求进一步巩固了通讯服务保障市场作为关键任务支出类别的地位。
全球电信服务保障市场趋势与洞察
引入以人工智慧为中心的零接触操作
从2024年到2025年,通讯业者为实现TM Forum 4-5级自主性目标,以降低营运成本并提升服务质量,大力推动自动化倡议,重塑网路营运模式。爱立信和AWS共同开发的智慧代理AI展示了基于意图的编配如何减少人工干预并提升客户满意度。 TM Forum的经济模型预测,人工智慧驱动的封闭回路型控制在其成熟阶段将为一级营运商平均每年节省8亿美元的成本。到2024年底,全球87%的通讯业者已实施至少一项人工智慧应用案例,其中一半营运商表示「资料收集分散」是其面临的最大障碍,这推动了对统一保障资料湖的需求。监管机构也发挥了推动作用。欧盟人工智慧立法强制要求采用透明且审核的模型,并加强了包含可解释性的保障平台的采购标准。这些因素共同推动了原生人工智慧保障模组的支出增加,并加速了通讯服务保障市场的成长。
5G SA部署需要即时SLA可见性
到 2024 年,北美、欧洲和亚太主要市场运作商用 5G 独立组网 (SA),这将带来前所未有的弹性需求。 NETSCOUT 发布了其虚拟分流技术,能够收集 100Gbps 的流量流,并在云端化核心网路中进行微秒分析。 Spirent 的主动保障探针产生合成流量,在影响客户之前检验切片效能,从而改变了传统的被动式营运模式。服务供应商优先考虑切片感知分析,将传输、核心网和无线接取网路 (RAN) 指标整合到统一的仪錶板中——这是传统 OSS/BSS 解决方案所缺乏的。标准化组织 TM Forum 和 3GPP 最终确定了切片特定的 KPI,促使供应商将其原生整合到自身产品中。企业对服务等级协定 (SLA) 的期望不断提高,尤其是在机器人和扩增实境 (AR) 领域,这进一步将即时保障从可选功能提升为合约要求。
一级行动网路营运商资本支出冻结(2024-2025 年)
由于预计5G无线设备建设将在2024年达到峰值,且宏观经济的不确定性导致通讯业者资本支出大幅收缩,Dell'Oro的研究预测,整个产业的资本支出将同比下降8%,并在2027年之前保持2%的复合年增长率。一家美国大型通讯业者已将上年度的预算削减了约50%,并推迟了非必要的软体升级。保障供应商面临更长的销售週期和更严格的投资回报率审查,但他们利用预测性维护和能源优化等成本投资收益优势,成功留在了采购候选名单上。分析师预测,随着5G接取网路计画的成熟,预算将在2025年底前逐步恢復,保障支出预计将随着无线接取网路(RAN)的重道密集化而同步復苏。
细分市场分析
2025年,效能监控和分析业务将占总收入的34.78%,为大型网路现代化专案提供支援。该业务的高份额反映了对无线、传输和核心网即时可见性的迫切需求。思科的AI增强型遥测流就是一个很好的例子,它展示了营运商如何从基于阈值的警告转向预测分析,从而主动预防网路拥塞。随着支援网路切片的指标不断扩展,与效能监控相关的通讯服务保障市场规模预计将保持稳健的中等个位数复合年增长率。
自动化根本原因识别和修復已成为一个高成长的细分市场,预计到2031年将以11.02%的复合年增长率成长,这主要得益于电信管理论坛(TM Forum)提出的4级自主目标。通讯业者正在寻求封闭回路型回馈,以便在几秒钟内自我修復劣化的网路切片,从而将平均修復时间(MTTR)缩短高达60%。供应商正在将机器学习策略引擎与产品捆绑销售,这些引擎可以关联数十亿个事件并提案修復脚本,从而减少故障排除人员的工作量。到2025年,已有超过30家全球通讯业者发布了根本原因人工智慧模组的招标书,显示该技术正从试点阶段走向主流应用。
截至2025年,本地部署平台仍维持50.62%的市场份额,反映出通讯业者希望严格管理敏感的核心数据。然而,在容器化和CI/CD管线普及的推动下,电信服务保障市场的云端原生解决方案年增率达12.08%。 Red 红帽公司基于Kubernetes的开放原始码参考堆迭透过弹性扩充和託管服务展现了成本优势。同时,Infovista的KLERITY以SaaS模式为企业客户提供厂商无关的保障和多租户功能。
混合模式正逐渐成为标准架构,它将大规模资料包代理和合法拦截工作负载保留在本地,同时将人工智慧训练和长期分析迁移到公共云端。这种双架构使企业能够在遵守资料主权要求的同时,利用超大规模资料中心业者的GPU进行模型训练。预计2031年,采用混合架构的电信服务保障市场规模将达到102.9亿美元,复合年增长率与整体市场保持一致。
区域分析
北美地区预计到2025年将维持31.88%的市场份额,这主要得益于STIR/SHAKEN合规的最后期限以及独立核心网路技术的早期商业化。 AT&T和Verizon等业者已试行实施了4级能源优化用例,可将基地台电力消耗降低5%。与AWS和谷歌云端的整合正在加速该地区向规范化保障的过渡。预计到2031年,北美相关通讯服务保障市场规模将达到71.8亿美元,维持个位数的温和成长,主要得益于私有5G倡议的扩展。
亚太地区已成为关键成长引擎,预计到2031年将实现12.12%的复合年增长率,这主要得益于印度、泰国和澳洲全国范围内的5G网路覆盖范围。惠誉评等观察到亚太地区许多通讯业者的信用指标保持稳定,因此能够持续投资于保障现代化。企业级5G和主要製造地区的大规模物联网部署推动了对基于网路切片和以设备为中心的监控的需求,使得平均合约规模比LTE时代翻了一番。
在欧洲,如何平衡GDPR合规负担和即将出台的欧盟人工智慧立法,同时实现开放式无线接取网路(RAN)多元化,仍然是一个巨大的机会。通讯业者寻求能够整合多个无线接取网/分散式单元(RU/DU)供应商的厂商中立控制面板,这提升了分散式保障方案的吸引力。在中东和非洲地区,Comarch的多域OSS部署与政府的数位经济计画相契合,推动了市场成长。拉丁美洲正处于5G普及的关键时刻,GSMA预测2030年5G渗透率将达到60%。这项转型需要基于云端的保障解决方案来弥补有限的资本支出预算。
其他福利:
- Excel格式的市场预测(ME)表
- 3个月的分析师支持
目录
第一章 引言
- 研究假设和市场定义
- 调查范围
第二章调查方法
第三章执行摘要
第四章 市场情势
- 市场概览
- 市场驱动因素
- 面对面商务旅行预算迅速恢復
- 企业永续性政策转向碳中和活动
- 利用技术,透过混合模式扩大参与者群体。
- 新兴经济体的目的地行销奖励
- Z世代/千禧世代员工对体验式设计的需求
- 海湾和东协市场的大规模基础设施开发
- 市场限制
- 机票和住宿费用波动;
- 地缘政治不确定性与签证限制
- 混合活动中的资料隐私和网路安全成本
- 加强对活动相关碳足迹的ESG审查
- 产业价值链分析
- 监管环境
- 技术展望
- 波特五力分析
- 新进入者的威胁
- 买方的议价能力
- 供应商的议价能力
- 替代品的威胁
- 竞争对手之间的竞争
第五章 市场规模与成长预测
- 按事件类型
- 会议
- 奖励
- 会议
- 展览
- 混合/虚拟活动
- 按服务类型
- 活动企划与管理
- 场地租赁
- 运输/物流
- 住宿设施
- 食品和餐饮
- 视听和技术服务
- 其他服务类型
- 依场地类型
- 会议中心
- 饭店和度假村
- 户外/非传统场地
- 公司自有设施
- 按行业
- 资讯科技/通讯
- 医疗和药品
- 银行、金融服务和保险(BFSI)
- 汽车/製造业
- 饭店和旅游业
- 政府/公共部门
- 其他行业
- 按地区
- 北美洲
- 我们
- 加拿大
- 墨西哥
- 南美洲
- 巴西
- 阿根廷
- 南美洲其他地区
- 欧洲
- 德国
- 英国
- 法国
- 义大利
- 西班牙
- 俄罗斯
- 其他欧洲
- 亚太地区
- 中国
- 日本
- 印度
- 韩国
- 澳洲
- 亚太其他地区
- 中东和非洲
- 中东
- 阿拉伯聯合大公国
- 沙乌地阿拉伯
- 土耳其
- 其他中东地区
- 非洲
- 南非
- 奈及利亚
- 肯亚
- 其他非洲地区
- 中东
- 北美洲
第六章 竞争情势
- 市场集中度
- 策略趋势
- 市占率分析
- 公司简介
- ASM Global
- Informa PLC
- Messe Frankfurt GmbH
- Reed Exhibitions(RX Global)
- Maritz Global Events Inc.
- MCI Group
- Cvent Holding Corp.
- GL Events SA
- Comexposium
- Fiera Milano SpA
- Koelnmesse GmbH
- Tarsus Group
- SMG(merged into ASM Global)
- Clarion Events Ltd.
- Viad Corp(GES)
- Emerald Holding Inc.
- Hyve Group plc
- dmg events
- Freeman Company
- Itochu Corp(Congrex)
第七章 市场机会与未来展望
The telecom service assurance market was valued at USD 12.25 billion in 2025 and estimated to grow from USD 13.46 billion in 2026 to reach USD 21.58 billion by 2031, at a CAGR of 9.88% during the forecast period (2026-2031).
Heightened performance-monitoring needs, 5G standalone adoption, and AI-centric zero-touch operations have boosted near-term spending as operators transition from reactive to proactive network management paradigms. Private-network and IoT vertical use cases are widening the addressable base, while hyperscaler partnerships are redirecting assurance architectures toward cloud-native, open-API designs. Competitive intensity has remained moderate; large multinationals are consolidating adjacent capabilities through acquisitions to strengthen end-to-end portfolios. North America continued to dominate in 2025, yet Asia Pacific's swift 5G rollout and enterprise digitalization yielded the fastest regional growth. Multiplying compliance mandates-from STIR/SHAKEN to the EU AI Act-have further entrenched the telecom service assurance market as a mission-critical spend category.
Global Telecom Service Assurance Market Trends and Insights
AI-centric Zero-touch Operations Adoption
Widespread automation initiatives reshaped network operations in 2024-2025 as operators pursued TM Forum Level 4-5 autonomy to curb operating expenses and sharpen service quality. Ericsson's joint work with AWS on Agentic AI proved that intent-based orchestration can cut manual interventions and lift customer satisfaction. TM Forum economic modelling estimated average annual savings of USD 800 million per tier-1 operator once AI-driven closed-loop control matures. Eighty-seven percent of global carriers had at least one production AI use case by late-2024, yet half cited fragmented data collection as the top barrier, spurring demand for unified assurance data lakes. Regulators added momentum: the EU AI Act requires transparent and auditable models, strengthening procurement criteria for assurance platforms that embed explainability. These forces collectively enlarged spending allocations to AI-native assurance modules, reinforcing growth in the telecom service assurance market.
5G SA Roll-out Demanding Real-time SLA Visibility
Commercial 5G standalone networks ran at scale in North America, Europe, and key Asia Pacific markets during 2024, triggering unprecedented resiliency requirements. NETSCOUT released virtual tap technology to ingest 100 Gbps traffic streams for microsecond-level analytics across cloudified cores. Spirent's active-assurance probes generated synthetic traffic to validate slice performance before customer impact, reversing long-standing reactive operating models. Service providers prioritized slice-aware analytics that tie transport, core, and RAN metrics into unified dashboards, a gap that traditional OSS/BSS could not cover. Standards groups TM Forum and 3GPP finalized slice-specific KPIs, propelling vendors to embed them natively. Heightened enterprise SLA expectations-especially for robotics and AR-further elevated real-time assurance from an optional feature to a contractual necessity.
Capex Freezes by Tier-1 MNOs 2024-25
Carrier capex contracted sharply in 2024 as 5G radio builds peaked and macroeconomic uncertainty rose. Dell'Oro's tracking placed industry capex 8% lower year-over-year, with projections for a 2% CAGR decline through 2027. Large United States operators reduced infrastructure outlays by roughly 50% versus prior budgets, delaying non-essential software expansions. Assurance vendors faced extended sales cycles and heightened ROI scrutiny; however, they leveraged cost-savings narratives-predictive maintenance and energy optimization-to remain on procurement short lists. Analysts expect budgets to thaw in late-2025 once 5G monetization initiatives mature, positioning assurance spending to rebound alongside renewed RAN densification.
Other drivers and restraints analyzed in the detailed report include:
- Compliance Pressure (STIR/SHAKEN, GDPR, EU AI Act)
- Telco API Monetization Needs End-to-end Quality
- Legacy OSS/BSS Integration Complexity
For complete list of drivers and restraints, kindly check the Table Of Contents.
Segment Analysis
Performance Monitoring and Analytics captured 34.78% revenue in 2025, underpinning every major network-modernization program. The segment's high share reflected urgent needs to visualize radio, transport, and core domains in real time. Cisco's AI-augmented telemetry streams exemplified how operators pivoted from threshold-based alarms to predictive analytics that pre-empt congestion. The telecom service assurance market size tied to Performance Monitoring is projected to maintain a robust mid-single-digit CAGR as slice-aware metrics expand.
Automated Root-Cause and Remediation rose as the high-growth niche, forecast at 11.02% CAGR through 2031, propelled by TM Forum Level-4 autonomy targets. Carriers demanded closed-loop feedback that self-heals degraded slices within seconds, slashing MTTR by up to 60%. Vendors bundled machine-learning policy engines that correlate billions of events and recommend remediation scripts, compressing troubleshooting head-counts. Over 30 global operators issued RFPs for root-cause AI modules during 2025, signaling a maturation path from pilot to mainstream adoption.
On-premises platforms still held 50.62% share in 2025 as operators sought tight control over sensitive core data. However, cloud-native instances of telecom service assurance market solutions expanded 12.08% annually, enabled by containerization and CI/CD pipelines. Red Hat's Kubernetes-based OSS reference stack showcased cost benefits from elastic scaling and managed services. Simultaneously, Infovista's KLERITY delivered vendor-agnostic assurance with multi-tenancy to serve enterprise customers in SaaS mode.
Hybrid mode is emerging as the default architecture: heavy packet brokering and lawful-intercept workloads remain on-premises, while AI training and long-term analytics shift to public clouds. This duality addresses data-sovereignty directives yet harnesses hyperscaler GPUs for model training. The telecom service assurance market size for hybrid architectures is forecast at USD 10.29 billion by 2031, advancing on par with overall market CAGR.
The Telecom Service Assurance Market Report is Segmented by Solution Type (Fault and Event Management, Performance Monitoring and Analytics, and More), Deployment Mode (On-Premises, Cloud-Native, and Hybrid), Operator Type (Mobile Network Operators, Fixed and Cable Operators, and More), Application Domain (5G RAN Assurance, Core and Edge Assurance, and More), and Geography. The Market Forecasts are Provided in Terms of Value (USD).
Geography Analysis
North America sustained 31.88% share in 2025, fueled by STIR/SHAKEN compliance deadlines and early standalone-core commercialization. Operators such as AT&T and Verizon piloted Level-4 energy-optimization use cases that trimmed cell-site power by 5%. Integration with AWS and Google Cloud advanced the regional shift toward assurance-as-code pipelines. The telecom service assurance market size tied to North America is projected at USD 7.18 billion by 2031, maintaining mid-single-digit growth as private-5G initiatives scale.
Asia Pacific rose as the primary growth engine, logging a 12.12% CAGR through 2031 on the back of nationwide 5G coverage in India, Thailand, and Australia. Fitch Ratings affirmed stable credit metrics for many Asia-Pacific telcos, enabling sustained investments in assurance modernization. Enterprise 5G and massive IoT deployments across manufacturing corridors spurred demand for slice-aware and device-centric monitoring, doubling average deal sizes compared with LTE-era contracts.
Europe retained significant opportunity, balancing GDPR and impending EU AI Act compliance burdens with open-RAN diversification. Operators sought vendor-neutral dashboards that reconcile multiple RU/DU suppliers, elevating the appeal of disaggregated assurance. Middle East and Africa gained traction through Comarch's multi-domain OSS rollouts, which align with government digital-economy blueprints. Latin America approached the tipping point for 5G dominance, with GSMA projecting 60% 5G penetration by 2030. This transition necessitates cloud-hosted assurance to offset constrained capex budgets.
- ASM Global
- Informa PLC
- Messe Frankfurt GmbH
- Reed Exhibitions (RX Global)
- Maritz Global Events Inc.
- MCI Group
- Cvent Holding Corp.
- GL Events SA
- Comexposium
- Fiera Milano SpA
- Koelnmesse GmbH
- Tarsus Group
- SMG (merged into ASM Global)
- Clarion Events Ltd.
- Viad Corp (GES)
- Emerald Holding Inc.
- Hyve Group plc
- dmg events
- Freeman Company
- Itochu Corp (Congrex)
Additional Benefits:
- The market estimate (ME) sheet in Excel format
- 3 months of analyst support
TABLE OF CONTENTS
1 INTRODUCTION
- 1.1 Study Assumptions and Market Definition
- 1.2 Scope of the Study
2 RESEARCH METHODOLOGY
3 EXECUTIVE SUMMARY
4 MARKET LANDSCAPE
- 4.1 Market Overview
- 4.2 Market Drivers
- 4.2.1 Rapid rebound of in-person business travel budgets
- 4.2.2 Corporate sustainability mandates shifting toward carbon-neutral events
- 4.2.3 Technology-enabled hybrid formats expanding attendee reach
- 4.2.4 Destination marketing incentives in emerging economies
- 4.2.5 Experiential design demand from Gen-Z/Millennial workforces
- 4.2.6 Large-scale infrastructure build-outs in Gulf and ASEAN markets
- 4.3 Market Restraints
- 4.3.1 Volatile air-travel and accommodation pricing
- 4.3.2 Geopolitical uncertainty and visa restrictions
- 4.3.3 Data-privacy and cybersecurity compliance costs for hybrid events
- 4.3.4 Rising ESG scrutiny on event-related carbon footprints
- 4.4 Industry Value Chain Analysis
- 4.5 Regulatory Landscape
- 4.6 Technological Outlook
- 4.7 Porter's Five Forces Analysis
- 4.7.1 Threat of New Entrants
- 4.7.2 Bargaining Power of Buyers
- 4.7.3 Bargaining Power of Suppliers
- 4.7.4 Threat of Substitutes
- 4.7.5 Competitive Rivalry
5 MARKET SIZE AND GROWTH FORECASTS (VALUE)
- 5.1 By Event Type
- 5.1.1 Meetings
- 5.1.2 Incentives
- 5.1.3 Conferences
- 5.1.4 Exhibitions
- 5.1.5 Hybrid/Virtual Events
- 5.2 By Service Type
- 5.2.1 Event Planning and Management
- 5.2.2 Venue Rental
- 5.2.3 Transportation and Logistics
- 5.2.4 Accommodation
- 5.2.5 Food and Catering
- 5.2.6 Audio-Visual and Technology Services
- 5.2.7 Other Service Types
- 5.3 By Venue Type
- 5.3.1 Convention Centers
- 5.3.2 Hotels and Resorts
- 5.3.3 Outdoor / Unconventional Venues
- 5.3.4 Corporate Owned Facilities
- 5.4 By Industry Vertical
- 5.4.1 IT and Telecom
- 5.4.2 Healthcare and Pharmaceuticals
- 5.4.3 Banking, Financial Services and Insurance (BFSI)
- 5.4.4 Automotive and Manufacturing
- 5.4.5 Hospitality and Tourism
- 5.4.6 Government and Public Sector
- 5.4.7 Other Industry Verticals
- 5.5 By Geography
- 5.5.1 North America
- 5.5.1.1 United States
- 5.5.1.2 Canada
- 5.5.1.3 Mexico
- 5.5.2 South America
- 5.5.2.1 Brazil
- 5.5.2.2 Argentina
- 5.5.2.3 Rest of South America
- 5.5.3 Europe
- 5.5.3.1 Germany
- 5.5.3.2 United Kingdom
- 5.5.3.3 France
- 5.5.3.4 Italy
- 5.5.3.5 Spain
- 5.5.3.6 Russia
- 5.5.3.7 Rest of Europe
- 5.5.4 Asia Pacific
- 5.5.4.1 China
- 5.5.4.2 Japan
- 5.5.4.3 India
- 5.5.4.4 South Korea
- 5.5.4.5 Australia
- 5.5.4.6 Rest of Asia Pacific
- 5.5.5 Middle East and Africa
- 5.5.5.1 Middle East
- 5.5.5.1.1 United Arab Emirates
- 5.5.5.1.2 Saudi Arabia
- 5.5.5.1.3 Turkey
- 5.5.5.1.4 Rest of Middle East
- 5.5.5.2 Africa
- 5.5.5.2.1 South Africa
- 5.5.5.2.2 Nigeria
- 5.5.5.2.3 Kenya
- 5.5.5.2.4 Rest of Africa
- 5.5.5.1 Middle East
- 5.5.1 North America
6 COMPETITIVE LANDSCAPE
- 6.1 Market Concentration
- 6.2 Strategic Moves
- 6.3 Market Share Analysis
- 6.4 Company Profiles (includes Global level Overview, Market level overview, Core Segments, Financials as available, Strategic Information, Market Rank/Share for key companies, Products and Services, and Recent Developments)
- 6.4.1 ASM Global
- 6.4.2 Informa PLC
- 6.4.3 Messe Frankfurt GmbH
- 6.4.4 Reed Exhibitions (RX Global)
- 6.4.5 Maritz Global Events Inc.
- 6.4.6 MCI Group
- 6.4.7 Cvent Holding Corp.
- 6.4.8 GL Events SA
- 6.4.9 Comexposium
- 6.4.10 Fiera Milano SpA
- 6.4.11 Koelnmesse GmbH
- 6.4.12 Tarsus Group
- 6.4.13 SMG (merged into ASM Global)
- 6.4.14 Clarion Events Ltd.
- 6.4.15 Viad Corp (GES)
- 6.4.16 Emerald Holding Inc.
- 6.4.17 Hyve Group plc
- 6.4.18 dmg events
- 6.4.19 Freeman Company
- 6.4.20 Itochu Corp (Congrex)
7 MARKET OPPORTUNITIES AND FUTURE OUTLOOK
- 7.1 White-space and Unmet-Need Assessment
 电信服务保障市场-全球产业规模、份额、趋势、机会与预测:按部署方式、营运商类型、组织规模、服务、系统、地区和竞争格局划分,2021-2031年
 日本电信服务保障市场报告(依营运商(固网、行动)、解决方案(软体、服务)、部署方式(本地部署、云端部署)、企业规模(中小企业、大型企业)和地区划分,2026-2034 年)
 电信服务保障市场按组件、部署类型、应用、垂直产业和组织规模划分 - 全球预测 2025-2032 年
 2026 年至 2032 年通讯服务保障市场(依部署模式、营运商类型、最终用户和地区划分)
 通讯服务保障市场规模、份额和成长分析(按组件、营运商类型、部署方法、组织规模和地区):产业预测(2024-2031)
 通讯服务保障市场市场规模、份额、趋势分析报告:按组件、按运营商、按部署、按公司规模、按地区、按细分市场、预测,2024-2030 年通讯服务保障市场:现况分析与预测(2024-2032年)