


 |
市场调查报告书
商品编码
1939026
海运货柜:市场占有率分析、产业趋势与统计、成长预测(2026-2031)Shipping Containers - Market Share Analysis, Industry Trends & Statistics, Growth Forecasts (2026 - 2031) |
||||||
※ 本网页内容可能与最新版本有所差异。详细情况请与我们联繫。
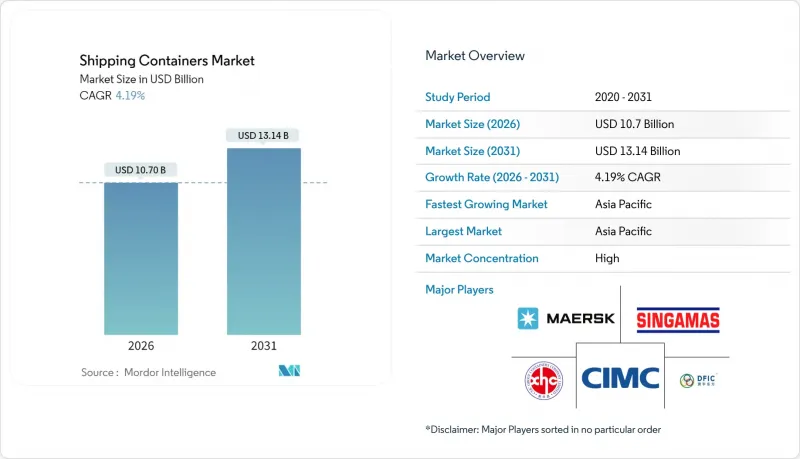
据估计,到 2026 年,海运货柜市场价值将达到 107 亿美元,高于 2025 年的 102.7 亿美元,预计到 2031 年将达到 131.4 亿美元。
预计从 2026 年到 2031 年,其复合年增长率将达到 4.19%。
电子商务履约、药品低温运输的扩张以及多式联运效率的提升,正在创造稳定的结构性需求。货柜运输在全球贸易量中占据90%的份额,为此增长提供了支撑。数位化追踪工具和智慧设计使营运商能够缩短港口停留时间,提高周转率。永续性目标正推动材料创新,朝着更轻质复合材料的方向发展。航运公司之间联盟的重新调整,正在重塑运力分配策略,更加重视规模更大、技术更先进的船队。儘管地缘政治动盪只是短期因素,但也凸显了多元化贸易路线的重要性以及动态路线规划的必要性。
全球货柜市场趋势与洞察
跨境电子商务的爆炸性成长要求24小时快速回应。
电子商务的蓬勃发展导致货运频率增加,但每次货运量却更小,因此港口吞吐速度比船舶运力更为重要。航运公司正在为高频航线增添更多设备,港口也正在投资自动化起重机,以便在一个班次内完成船舶的装卸作业。智慧追踪技术使托运人能够在货物抵达港口前预先办理清关手续并预订铁路货运位。这些精简措施缩短了库存週期,并强化了对标准干货货柜的偏好,即使贸易量波动,标准干货货柜也能保持较高的运转率。随着线上市场渗透到新兴经济体,货柜市场在各种贸易路线上都保持着持续的潜在需求。
低温运输在全球的普及速度正在加快,对尖端冷藏货柜的订单也不断增加。
为了降低成本和排放,同时不影响温度控制,製药公司正将长途运输从空运转向海运。现代冷藏货柜的温度精度可达±0.5°C,并整合遥测技术,能够即时检测偏差,从而在运输途中采取纠正措施。生鲜食品出口商也采用类似技术,以最大限度地减少食品在送达远距离消费者的过程中发生变质。提供双燃料冷冻装置的製造商透过降低能耗并符合低全球暖化潜值(GWP)法规,实现了更高的货柜售价。随着食品电商拓展至新市场,对先进冷藏货柜的需求持续成长,超过了普通货物运输的成长速度。
疫情后货柜供应过剩导致运转率下降
2021年至2023年创纪录的新造船量造成了暂时的供应过剩,压低了租赁价格,并导致营运商推迟新订单。贸易疲软导致门户港口閒置库存积压,迫使堆场降低仓储费并吸引调拨业务。製造商已采取措施应对,减少生产班次,并将产能转向需求更为稳定的特殊设计。随着老旧船队的报废和贸易恢復正常,预计这种调整将得到缓解。
细分市场分析
高立方货柜的需求日益增长,其比普通余量高出13%的净空高度,最大限度地提高了电商小包裹、轻型家电等货物的容积有效负载容量。儘管40英尺标准货柜在2025年仍将占据52.21%的市场份额,显示其在海运领域持续受到欢迎,但预计到2031年,40英尺高立方货柜的年复合增长率将达到5.43%。高立方货柜的市场规模反映了托运人在不超出重量限制的情况下对更大运力的需求。
随着港口基础设施的改善,装卸高度得以提升,码头营运商正在引入提升高度更高的正面吊运机,以有效处理这些货柜。物流整合商正在推广40英尺轨距的货柜,以简化铁路货车的分配并提高各堆场之间的互通性。 Triton Containers公司透过提供灵活的提货选项的高箱租赁服务来鼓励采用这种标准,从而降低搬迁成本。总体而言,托运人对容积效率和包装整合的关注,正在推动主要贸易走廊对高箱需求的持续成长。
预计到2025年,干货货柜将占货运量的72.32%,巩固其作为全球商品分销支柱的地位。同时,受生鲜食品出口商和製药公司海运业务扩张的推动,预计到2031年,冷藏货柜的复合年增长率将达到6.18%。目前,冷藏货柜占据了货柜市场的高端领域,其租赁价格是干货货柜的两到三倍。
技术创新包括变速压缩机和太阳能辅助电源模组,从而降低了待机能耗。药品托运商要求配备冗余的温度探头和门感测器,并且能够在异常情况发生后数秒内发出警报是区分不同製造商的关键因素。冷藏货柜也受益于脱碳,因为将对温度敏感的货物从空运转移到海运可以减少高达 80% 的相关排放。
区域分析
预计亚太地区将引领货柜市场,2025年营收成长率将达到59.88%,并在2031年之前维持5.46%的复合年增长率。中国作为製造地的地位依然稳固,而随着企业采购多元化,东南亚的需求也不断成长。马来西亚和印度的巨型港口计划每年新增超过2500万个标准箱的吞吐能力,不仅提升了区域货物吞吐量,也刺激了支线网路的货柜需求。货币稳定和有利的贸易协定也透过区域租赁池推动了船队的扩张。
北美正受益于近岸外包,即将电子产品和汽车组装转移到更靠近消费市场的地方。美国港口当局已核准数十亿美元的疏浚和泊位电气化计划,加剧了与墨西哥和加拿大港口的竞争。中西部地区铁路联运网络的建设,使得连接大西洋和太平洋盆地的陆路运输能够在八天内实现,并促进了可堆迭货柜设计的应用。
欧洲货柜航运市场正经历两极化的成长趋势。地缘政治紧张局势迫使亚欧航线绕道非洲,导致儘管运输时间延长,但地中海枢纽港口的停靠次数却增加。伦敦门户港和鹿特丹-马斯弗拉克特港的自动化投资提高了起重机每小时的处理量,从而推高了单价。更严格的环保法规加速了老旧重型货柜的淘汰,并促使货柜转向使用再生钢材製造。儘管贸易量成长放缓,但这仍然支撑了货柜的更换需求。
其他福利:
- Excel格式的市场预测(ME)表
- 3个月的分析师支持
目录
第一章 引言
- 研究假设和市场定义
- 调查范围
第二章调查方法
第三章执行摘要
第四章 市场情势
- 市场概览
- 市场驱动因素
- 跨境电子商务的爆炸性成长使得标准干货货柜的交货时间达到了24小时以内。
- 世界各地广泛使用低温运输运输生鲜食品和食材自煮包,加速了对先进冷藏箱的订单。
- 直接面向消费者 (D2C) 的品牌正在寻求客製化带有预印标誌的容器,用作行动快闪店和履约中心。
- 企业 ESG 政策促使托运人更倾向于使用可重复使用的多模态货柜,而不是一次性托盘包装,从而推动了对替代品的需求。
- 采用物联网技术的「智慧箱」可提供即时位置和状态数据,进而提高托运人为优质设备付费的意愿。
- 订阅式和模组化住宅理念正在促进旧货柜的再利用,赋予它们第二次生命。
- 市场限制
- 疫情后纸箱供应过剩,降低了运转率,抑制了对新建筑的投资。
- 热轧钢卷钢价格的波动为货柜买家的预算计划带来了不确定性。
- 从生产到处置,日益严格的监管和生产者延伸责任制 (EPR) 规则正在增加产品生命週期内的拥有成本。
- 可折迭和可压缩容器替代品的迅速崛起正在蚕食传统硬纸箱的需求。
- 价值/供应链分析
- 监管和技术趋势
- 波特五力模型
- 新进入者的威胁
- 买方的议价能力
- 供应商的议价能力
- 替代品的威胁
- 竞争对手之间的竞争
- 价格分析-标准货柜与特种货柜
- 专题报导:多式联运和铁路运输的普及
- 全球货柜租赁市场概览
- 地缘政治事件如何影响市场
第五章 市场规模与成长预测
- 按尺寸
- 20英尺(标准货柜)
- 40 英尺(FEU)
- 40英尺高立方货柜
- 其他(超过 45 英尺等)
- 按容器类型
- 干式储存(标准)
- 冷藏(冷藏车)
- 储槽(ISO储槽、低温储槽)
- 平板架和开放式顶部
- 特殊应用(侧门、隧道、隔热、折迭)
- 材料
- 耐候钢
- 不銹钢
- 铝合金
- FRP和复合材料
- 其他的
- 按最终用途行业划分
- 消费品和零售
- 食品/饮料
- 工业机械和汽车
- 化学品/石油产品
- 製药和医疗保健
- 其他的
- 透过交通工具
- 海洋/深海
- 近海/沿海路线
- 铁路货柜运输
- 陆路运输和异地存储
- 按地区
- 北美洲
- 我们
- 加拿大
- 墨西哥
- 南美洲
- 巴西
- 秘鲁
- 智利
- 阿根廷
- 其他南美洲
- 亚太地区
- 中国
- 印度
- 日本
- 澳洲
- 韩国
- 东南亚(新加坡、马来西亚、泰国、印尼、越南、菲律宾)
- 亚太其他地区
- 欧洲
- 英国
- 德国
- 法国
- 西班牙
- 义大利
- 比荷卢经济联盟(比利时、荷兰、卢森堡)
- 北欧国家(丹麦、芬兰、冰岛、挪威、瑞典)
- 其他欧洲地区
- 中东和非洲
- 阿拉伯聯合大公国
- 沙乌地阿拉伯
- 南非
- 奈及利亚
- 其他中东和非洲地区
- 北美洲
第六章 竞争情势
- 市场集中度
- 策略趋势(併购、产能扩充、租赁协议)
- 市占率分析
- 公司简介
- China International Marine Containers(CIMC)
- Dong Fang International Containers
- CXIC Group(CSSC)
- Maersk Container Industry A/S
- Singamas Container Holdings
- W&K Container
- Sea Box Inc.
- TLS Offshore Containers
- Storstac Inc.
- CARU Containers BV
- China Eastern Containers
- Valisons & Co.
- YMC Container Solutions
- American Intermodal Container Manufacturing
- Triton International
- Textainer Group Holdings
- Florens Container Services
- CAI International
- Touax Group
- UES International
第七章 市场机会与未来展望
Shipping Containers market size in 2026 is estimated at USD 10.7 billion, growing from 2025 value of USD 10.27 billion with 2031 projections showing USD 13.14 billion, growing at 4.19% CAGR over 2026-2031.
E-commerce fulfillment, pharmaceutical cold-chain expansion, and rising intermodal efficiency provide stable, structural demand. Containerization's role in handling 90% of global trade underpins this growth, while digital tracking tools and smarter designs help operators shorten port stays and boost asset turnover. Sustainability targets are pushing material innovation toward lighter composites, and alliance restructuring among carriers is reshaping capacity deployment strategies in favor of larger, technology-enabled fleets. Geopolitical disruptions add short-term volatility but also reinforce the importance of diversified trade lanes and dynamic routing.
Global Shipping Containers Market Trends and Insights
Explosive Growth of Cross-Border E-Commerce Creating 24-Hour Turnaround Expectations
E-commerce expansion drives more frequent, smaller shipments, shifting focus from vessel capacity toward port velocity. Carriers commit additional equipment to high-frequency loops, while ports invest in automated cranes that clear vessels inside one shift. Smart tracking allows shippers to pre-clear customs and book rail slots before docking. These operational gains shorten inventory cycles and reinforce preference for standard dry boxes, keeping utilization high even when trade volumes fluctuate. As online marketplaces penetrate emerging economies, the shipping container market sees sustained baseline demand across diverse trade lanes.
Worldwide Cold-Chain Penetration Accelerates Advanced Reefer Orders
Pharmaceutical producers are migrating long-haul shipments from air to ocean to cut costs and emissions without compromising temperature control. Modern reefers maintain +-0.5 °C accuracy and integrate telemetry that flags deviations in real time, allowing corrective actions mid-voyage. Fresh grocery exporters adopt similar technology to reach distant consumers with minimal spoilage. Manufacturers offering dual-fuel refrigeration units reduce energy consumption and meet low-GWP regulations, enabling higher price realisation per box. As grocery e-commerce extends to new markets, advanced reefer demand continues to outpace general cargo growth.
Post-Pandemic Oversupply of Boxes Eroding Utilization Rates
Record new builds made during 2021-2023 create a temporary surplus, pushing lease rates down and prompting operators to delay fresh orders. Idle inventories accumulate in gateway ports when trade softens, forcing depots to lower storage fees to attract repositioning business. Manufacturers adapt by trimming production shifts and redirecting capacity toward specialized designs with steadier demand. The correction is expected to resolve once scrappage catches up with ageing fleets and trade normalizes.
Other drivers and restraints analyzed in the detailed report include:
- Direct-to-Consumer Brands Demanding Bespoke, Logo-Printed Containers
- Corporate ESG Mandates Pushing Reusable Container Adoption
- Volatility in Hot-Rolled Coil Steel Prices Creating Budget Uncertainty
For complete list of drivers and restraints, kindly check the Table Of Contents.
Segment Analysis
High-cube offerings are capturing incremental demand because their 13% extra headroom maximizes volumetric loads such as e-commerce parcels and lightweight consumer electronics. 40-ft formats generated 52.21% revenue in 2025, demonstrating entrenched popularity for ocean freight, whereas 40-ft high-cube units are forecast to grow at 5.43% CAGR to 2031. The shipping container market size for high-cube units reflects shipper preference for greater capacity without breaching weight restrictions.
Port infrastructure upgrades accommodate taller stacks, and terminal operators add reach-stackers with extended lifting heights to handle these units efficiently. Logistics integrators promote standardization on the 40-ft profile to streamline rail wagon allocation and depot interchange. Triton Containers markets high-cube leases with flexible pick-up options to reduce repositioning, reinforcing adoption. Overall, shipper focus on cubic efficiency and consolidation of packaging drives continued high-cube traction across primary trade corridors.
Dry storage boxes accounted for 72.32% of 2025 shipments, underscoring their status as the backbone of global commodity flows. In contrast, reefer units record a 6.18% CAGR to 2031 as fresh produce exporters and drug makers scale ocean routes. Refrigerated boxes currently represent the premium slice of the shipping container market, commanding rental rates two to three times higher than dry units.
Technology upgrades include variable-speed compressors and solar-assisted power modules that cut energy draw during idle periods. Pharmaceutical shippers require redundant temperature probes and door sensors that trigger alerts within seconds of deviation, driving differentiation among manufacturers. Reefers also benefit from decarbonization, as shifting temperature-sensitive goods from air to sea avoids up to 80% of related emissions.
The Shipping Container Market is Segmented by Size (20-Ft (TEU), 40-Ft (FEU) and More), by Container Type (Dry Storage (Standard), Refrigerated, and More), by Material (Corten Steel, Stainless Steel and More), End-Use Industry (Consumer Goods & Retail and More), by Mode of Transport (Maritime Deep-Sea and More), by Geography (North America, South America, and More). The Market Forecasts are Provided in Terms of Value (USD).
Geography Analysis
Asia-Pacific dominated the shipping containers market with 59.88% revenue in 2025 and is set to grow at a 5.46% CAGR to 2031. China retains manufacturing leadership, yet Southeast Asia captures incremental volumes as firms diversify sourcing. Malaysian and Indian mega-port projects add more than 25 million TEU of annual capacity, anchoring regional throughput and stimulating container demand across feeder networks. Currency stability and supportive trade agreements also encourage regional leasing pools to expand their fleets.
North America benefits from nearshoring that shifts electronics and automotive assembly closer to consumption markets. United States port authorities approve multi-billion-dollar dredging and berth electrification programs, enhancing competitiveness against Mexican and Canadian gateways. The rail intermodal build-out across the Midwest unlocks cost-effective land bridges that connect Atlantic and Pacific basins in under eight days, driving uptake of stack-train compatible container designs.
Europe records mixed growth shipping container market as geopolitical tensions divert Asia-Europe sailings around Africa, extending transit times but also directing additional calls to Mediterranean hubs. Investments in automation at London Gateway and Rotterdam Maasvlakte raise throughput per crane hour, cushioning cost-per-box metrics. Stringent environmental regulations accelerate the retirement of older, heavier boxes in favor of recycled-content steel units, supporting replacement demand despite subdued trade volume growth.
- China International Marine Containers (CIMC)
- Dong Fang International Containers
- CXIC Group (CSSC)
- Maersk Container Industry A/S
- Singamas Container Holdings
- W&K Container
- Sea Box Inc.
- TLS Offshore Containers
- Storstac Inc.
- CARU Containers B.V.
- China Eastern Containers
- Valisons & Co.
- YMC Container Solutions
- American Intermodal Container Manufacturing
- Triton International
- Textainer Group Holdings
- Florens Container Services
- CAI International
- Touax Group
- UES International
Additional Benefits:
- The market estimate (ME) sheet in Excel format
- 3 months of analyst support
TABLE OF CONTENTS
1 Introduction
- 1.1 Study Assumptions & Market Definition
- 1.2 Scope of the Study
2 Research Methodology
3 Executive Summary
4 Market Landscape
- 4.1 Market Overview
- 4.2 Market Drivers
- 4.2.1 Explosive growth of cross-border e-commerce creating 24-hour turnaround expectations for standard dry containers.
- 4.2.2 Worldwide cold-chain penetration of fresh grocery and meal-kit delivery accelerating orders for advanced reefer boxes.
- 4.2.3 Direct-to-consumer (D2C) brands demanding bespoke, logo-printed containers to double as mobile pop-up stores and fulfilment hubs.
- 4.2.4 Corporate ESG mandates pushing shippers toward reusable, multimodal containers over single-use pallet wrap, lifting replacement demand.
- 4.2.5 Adoption of IoT-enabled -smart- boxes providing real-time location & condition data, raising shipper's willingness to pay for premium units.
- 4.2.6 Subscription-based and modular housing concepts spurring second-life conversions of retired shipping containers.
- 4.3 Market Restraints
- 4.3.1 Post-pandemic oversupply of boxes eroding utilisation rates and discouraging new-build investment.
- 4.3.2 Volatility in hot-rolled coil steel prices creating budget uncertainty for container purchasers.
- 4.3.3 Stricter cradle-to-grave regulations and extended-producer-responsibility (EPR) rules inflating lifetime ownership costs.
- 4.3.4 Rapid emergence of foldable and collapsible container alternatives cannibalising demand for conventional rigid boxes.
- 4.4 Value / Supply-Chain Analysis
- 4.5 Regulatory & Technological Outlook
- 4.6 Porter's Five Forces
- 4.6.1 Threat of New Entrants
- 4.6.2 Bargaining Power of Buyers
- 4.6.3 Bargaining Power of Suppliers
- 4.6.4 Threat of Substitutes
- 4.6.5 Intensity of Competitive Rivalry
- 4.7 Pricing Analysis - Standard vs. Special Containers
- 4.8 Spotlight: Intermodal & Rail Uptake
- 4.9 Global Container Leasing Landscape
- 4.10 Impact of Geopolitical Events on the Market
5 Market Size & Growth Forecasts (Value, Volume)
- 5.1 By Size
- 5.1.1 20-ft (TEU)
- 5.1.2 40-ft (FEU)
- 5.1.3 40-ft High-Cube,
- 5.1.4 Others ( >45-ft, etc)
- 5.2 By Container Type
- 5.2.1 Dry Storage (Standard)
- 5.2.2 Refrigerated (Reefer)
- 5.2.3 Tank (ISO Tank, Cryogenic)
- 5.2.4 Flat-Rack & Open-Top
- 5.2.5 Special Purpose (Side-Door, Tunnel, Insulated, Collapsible)
- 5.3 By Material
- 5.3.1 Corten Steel
- 5.3.2 Stainless Steel
- 5.3.3 Aluminium Alloy
- 5.3.4 FRP & Composite
- 5.3.5 Others
- 5.4 By End-Use Industry
- 5.4.1 Consumer Goods & Retail
- 5.4.2 Food & Beverage
- 5.4.3 Industrial Machinery & Automotive
- 5.4.4 Chemicals & Petroleum
- 5.4.5 Pharmaceuticals & Healthcare
- 5.4.6 Others
- 5.5 By Mode of Transport
- 5.5.1 Maritime Deep-Sea
- 5.5.2 Short-Sea & Coastal
- 5.5.3 Rail Intermodal
- 5.5.4 Road Inland Haulage & Off-Site Storage
- 5.6 By Geography
- 5.6.1 North America
- 5.6.1.1 United States
- 5.6.1.2 Canada
- 5.6.1.3 Mexico
- 5.6.2 South America
- 5.6.2.1 Brazil
- 5.6.2.2 Peru
- 5.6.2.3 Chile
- 5.6.2.4 Argentina
- 5.6.2.5 Rest of South America
- 5.6.3 Asia-Pacific
- 5.6.3.1 China
- 5.6.3.2 India
- 5.6.3.3 Japan
- 5.6.3.4 Australia
- 5.6.3.5 South Korea
- 5.6.3.6 South East Asia (Singapore, Malaysia, Thailand, Indonesia, Vietnam, and Philippines)
- 5.6.3.7 Rest of Asia-Pacific
- 5.6.4 Europe
- 5.6.4.1 United Kingdom
- 5.6.4.2 Germany
- 5.6.4.3 France
- 5.6.4.4 Spain
- 5.6.4.5 Italy
- 5.6.4.6 BENELUX (Belgium, Netherlands, and Luxembourg)
- 5.6.4.7 NORDICS (Denmark, Finland, Iceland, Norway, and Sweden)
- 5.6.4.8 Rest of Europe
- 5.6.5 Middle East And Africa
- 5.6.5.1 United Arab Emirates
- 5.6.5.2 Saudi Arabia
- 5.6.5.3 South Africa
- 5.6.5.4 Nigeria
- 5.6.5.5 Rest of Middle East And Africa
- 5.6.1 North America
6 Competitive Landscape
- 6.1 Market Concentration
- 6.2 Strategic Moves (M&A, Capacity Expansion, Leasing Deals)
- 6.3 Market Share Analysis
- 6.4 Company Profiles (includes Global-level Overview, Market-level Overview, Core Segments, Financials, Strategic Information, Market Rank/Share, Products & Services, Recent Developments)
- 6.4.1 China International Marine Containers (CIMC)
- 6.4.2 Dong Fang International Containers
- 6.4.3 CXIC Group (CSSC)
- 6.4.4 Maersk Container Industry A/S
- 6.4.5 Singamas Container Holdings
- 6.4.6 W&K Container
- 6.4.7 Sea Box Inc.
- 6.4.8 TLS Offshore Containers
- 6.4.9 Storstac Inc.
- 6.4.10 CARU Containers B.V.
- 6.4.11 China Eastern Containers
- 6.4.12 Valisons & Co.
- 6.4.13 YMC Container Solutions
- 6.4.14 American Intermodal Container Manufacturing
- 6.4.15 Triton International
- 6.4.16 Textainer Group Holdings
- 6.4.17 Florens Container Services
- 6.4.18 CAI International
- 6.4.19 Touax Group
- 6.4.20 UES International
7 Market Opportunities & Future Outlook
- 7.1 White-Space & Unmet-Need Assessment
 货物固定设备市场:2026-2032年全球市场预测(依产品、材料、应用及通路划分)
 货柜船市场规模、份额、成长及全球产业分析:按类型、应用和地区划分,并预测至2026-2034年全球智慧货柜市场规模、份额、趋势和成长分析报告(2026-2034)全球货柜市场规模、份额、趋势和成长分析报告(2026-2034)
 货柜市场报告:按产品、货柜尺寸、应用和地区划分(2026-2034 年)
 2026年全球货柜市场报告2026年全球锅炉、储槽和运输货柜市场报告国际货柜运输服务市场按货柜类型、服务类型、货柜尺寸、运输方式、承运人类型和最终用途产业划分-全球预测(2026-2032 年)按服务类型、货柜类型、货柜尺寸和最终用户产业分類的货柜航运市场-2026-2032年全球预测货柜航运服务市场按服务类型、货柜类型、运输方式、航线类型和最终用户产业划分-2026-2032年全球预测