


|
市场调查报告书
商品编码
1636632
通讯网路营运商市场回顾(2024年第三季):营收復苏,但持续的支出削减导致年度资本支出低于3,000亿美元大关Telecommunications Network Operators - 3Q24 Market Review: Telco Topline Rebounds but Annualized Capex Dips Below $300B Mark amid Continued Spending Cuts |
|||||||
本报告回顾了通讯网路营运商市场的成长和发展。本报告对2011年第一季至2024年第三季全球140家电信营运商的财务统计资料进行了广泛的追踪。
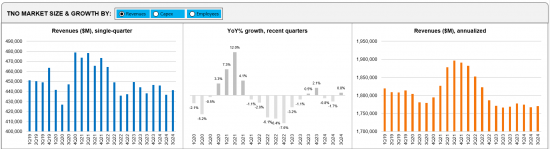
电信网路营运商2024年第三季年化收入为1.77兆美元,较上年同期成长0.1%;劳动力支出为2,624亿美元,成长0.8%,资本支出为2,946亿美元,下降7.7%。截至2024年9月,员工人数约445万人,较前一年减少1.5%。
视觉
报告重点:
营收:通讯营收年增 0.8%至 4,414亿美元,2024年第三季年化营收年增 0.1%至 1,7706亿美元。在营运商层面,2024年第三季营收成长排名前20位的公司中,每年化成长率排名的有5家:Airtel(4.6%)、America Movil(4.3%)、STC(Saudi Telecom)(4.2%)、Deutsche Telekom (3.3%)和BT(2.5%)。依照同样的标准,同期成长率最差的公司分别是Vodafone(-6.8%)、KDDI(-5.7%)、NTT(-5.0%)、SoftBank(-3.6%)和BCE(-1.6%)。汇率波动并不是第三季的重要因素,大多数主要货币相对于第三季的水准保持相对稳定。
资本支出:截至2024年9月的年度资本支出为711亿美元,年减6.1%,2024年第三季的资本支出以年率计算为2,946亿美元,较去年同期下降7.7%。在营运商层面,2024年第三季按年化资本支出成长率排名前20名的营运商中有 5 家分别是 BSNL(300.6%)、Telstra(52.3%)、BT(4.8%)、NTT(3.0%)和China Mobile(1.9%)。基于同样的理由,该时期资本支出成长表现最差的公司包括 Reliance Jio(下降 27.4%)、Verizon(下降 22.5%)、Vodafone(下降20.0%)、Deutsche Telekom(下降 18.1%)和 KDDI(下降 16.3%)。
OPEX/劳动成本:2024年第三季的OPEX 为 1,5079亿美元,较去年同期小幅成长 0.9%。若扣除折旧及摊销,营收年增1.7%至11,794亿美元。电信公司营运支出(OPEX)的关键组成部分之一是劳动力成本,其中包括工资、薪水、奖金、福利和遣散费。2024年第三季年化劳动成本年增 0.8%,劳动成本占 OPEX(不包括 D&A)的百分比为 22.2%。
利润率:2024年第三季的年化 EBITDA 利润率和 EBIT 利润率与2023年第三季相比均略有下降。2024年第三季的年化 EBIT 利润率从2023年第三季的15.5%下降至 14.8%,而2024年第三季的年化 EBITDA 利润率为 33.4%,低于2023年第三季的34.5%。
区域趋势:美洲将在 3Q24 保持其作为最大收入地区的地位,占全球电信收入的37.2%,紧随其后的是亚洲,占 36.4%。从资本投资额来看,亚洲占全球资本投资的38.2%,超过美洲成为第一大地区。这与2022年第三季和2023年第三季的情况有所不同,当时美洲凭藉 AT&T 和 Verizon 的5G 支出排名第一。2024年第三季,欧洲的年化资本密集度最高,为 17.8%,其次是中东和非洲,为 17.0%。
目标企业
|
|
调查区:
|
|
目录
- 1.报告重点
- 2.摘要
- 3.市场概况
- 4.分析
- 5.关键统计:2024年第三季
- 6.员工统计
- 7.业者排名
- 8.公司深入分析
- 9.公司标竿管理
- 10.依国家细分
- 11.依公司及国家细分
- 12.依地区细分
- 13.原始资料
- 14.订阅者与流量
- 15.汇率
- 16.研究方法与范围
- 17.关于我们
This report reviews the growth and development of the telecommunications network operator (TNO, or telco) market. The report tracks a wide range of financial stats for 140 telcos across the globe, from 1Q11 through 3Q24. For the annualized 3Q24 period, telcos represented $1.77 trillion (T) in revenues (0.1% growth YoY), $262.4 billion (B) in labor costs (0.8% YoY), and $294.6B in capex (-7.7% YoY). They employed approximately 4.45 million people as of September 2024, down 1.5% from the prior year.
VISUALS
Below are a few highlights from the report:
Revenues: Telco topline grew slightly by 0.8% on a YoY basis to post $441.4 B in the latest single quarter ending 3Q24. Revenues for the annualized 3Q24 period were $1,770.6B, up 0.1% YoY over the same period in the previous year. At the operator level, five of the top 20 telcos by topline growth in 3Q24 on an annualized basis include Airtel (4.6%), America Movil (4.3%), STC (Saudi Telecom) (4.2%), Deutsche Telekom (3.3%), and BT (2.5%). By the same criteria, the worst telco growth came from Vodafone (-6.8%), KDDI (-5.7%), NTT (-5.0%), SoftBank (-3.6%), and BCE (-1.6%) during the same period. Note that exchange rate volatility was NOT a major factor in 3Q24, as most major currencies were relatively stable versus 3Q23 levels.
Capex: Capex spending declined by 6.1% on a YoY basis to post $71.1B in the latest single quarter ending September 2024. Capex for the annualized 3Q24 period was $294.6B, down 7.7% YoY over the same period in the previous year. At the operator level, five of the top 20 telcos by capex growth in 3Q24 on an annualized basis include BSNL (300.6%), Telstra (52.3%), BT (4.8%), NTT (3.0%), and China Mobile (1.9%). By the same criteria, the worst capex growth came from Reliance Jio (-27.4%), Verizon (-22.5%), Vodafone (-20.0%), Deutsche Telekom (-18.1%), and KDDI (-16.3%) during the same period.
Opex and labor costs: Total opex for the telecom industry in the annualized 3Q24 period stood at $1,507.9B, a slight increase of 0.9% over the same period in the previous year. Excluding depreciation and amortization (D&A) costs, opex increased by 1.7% on YoY basis to record $1,179.4B in the annualized 3Q24 period. One significant element of telco opex is labor costs, which include salaries, wages, bonuses, benefits, and retirement/severance costs. Labor costs grew by 0.8% YoY in the annualized 3Q24 period, while labor costs as a percentage of opex (ex-D&A) was 22.2% in the same period.
Profitability margins: Both EBITDA and EBIT margins showed a slight decline in annualized 3Q24 compared to 3Q23. The annualized EBIT margin dipped from 15.5% in 3Q23 to 14.8% in 3Q24, while the EBITDA margin for the annualized 3Q24 period stood at 33.4%, down from 34.5% in annualized 3Q23.
Regional trends: The Americas retained its position as the largest revenue-generating region in 3Q24, contributing 37.2% of global telco revenues, closely followed by Asia with a 36.4% share. On a capex basis though, Asia emerged as the top spender, claiming 38.2% of global capex and outpacing the Americas; this is a change from 3Q22 and 3Q23, when Americas ranked #1 on the back of 5G spending by AT&T and Verizon. Europe retained the highest annualized capital intensity, reaching 17.8% in 3Q24, followed by MEA at 17.0%.
Important note: We have made some significant enhancements to our telco market review report in 1Q24. The changes are designed to provide a more insightful and user-friendly experience:
- 'Market Snapshot' Tab:This tab now features an interactive dashboard view of the telco market, allowing users to interact with and analyze market data more effectively. Additionally, users can export the dashboard to PDF for convenient sharing and reference.
- Two distinct sections have been created from the previous 'Company Deepdive & Benchmarking' section for greater clarity and functionality:
- 1.'Company Drilldown': Provides a comprehensive analysis of a selected company from the full set of 140 telcos. It covers various metrics including revenue, capex, employee counts, costs, profitability, cash and debt levels, and key ratios.
- 2.'Company Benchmarking': Focuses on a sample of 79 telcos, representing approximately 82% of the global market. This section allows users to select and compare up to 5 telcos across multiple metrics such as labor costs, opex, EBIT, as well as revenues, capex, and employee counts. The sample includes operators from all regions and of varying sizes.
Both new sections also feature the capability to export graphics to PDF, enhancing the flexibility and utility of the data presented.
Operator coverage:
|
|
Regional coverage:
|
|
Table of Contents
- 1. Report Highlights
- 2. Summary
- 3. Market snapshot
- 4. Analysis
- 5. Key stats through 3Q24
- 6. Labor stats
- 7. Operator rankings
- 8. Company drilldown
- 9. Company benchmarking
- 10. Country breakouts
- 11. Country breakouts by company
- 12. Regional breakouts
- 13. Raw Data
- 14. Subs & traffic
- 15. Exchange rates
- 16. Methodology & Scope
- 17. About
List of Figures and Charts:
- 1. TNO market size & growth by: Revenues, Capex, Employees - 1Q19-3Q24
- 2. Regional trends by: Revenues, Capex - 1Q19-3Q24
- 3. Opex & Cost trends
- 4. Labor cost trends: 1Q20-3Q24
- 5. Profitability margin trends: 1Q20-3Q24
- 6. Spending (opex, labor costs, capex): annual and quarterly trend
- 7. Key ratios: annual and quarterly trend
- 8. Workforce & productivity trends: 1Q14-3Q24
- 9. Operator rankings by revenue and capex: latest single-quarter and annualized periods
- 10. Top 20 TNOs by capital intensity: latest single-quarter and annualized periods
- 11. Top 20 TNOs by employee base: latest single-quarter
- 12. TNOs: YoY growth in single quarter revenues
- 13. TNOs: Annualized capital intensity, 1Q16-3Q24
- 14. TNOs: Revenue and RPE, annualized 1Q16-3Q24
- 15. TNOs: Capex and capital intensity (annualized), 1Q16-3Q24
- 16. TNOs: Total headcount trends, 1Q16-2Q24
- 17. TNOs: Revenue and RPE trends, 2011-23
- 18. TNOs: Capex and capital intensity, 2011-23 ($ Mn)
- 19. TNOs: Capex and capital intensity, 1Q16-3Q24 ($ Mn)
- 20. TNOs: Revenue and RPE trends, 1Q16-3Q24
- 21. TNOs by total opex, 3Q24
- 22. TNOs by labor costs, 3Q24
- 23. TNOs: Software as % of total capex
- 24. TNOs: Software & spectrum spend
- 25. TNOs: Total M&A, spectrum and capex (excl. spectrum)
- 26. TNOs by total debt: 2011-23
- 27. TNOs by total net debt: 2011-23
- 28. TNOs by long term debt: 2011-23
- 29. TNOs by short term debt: 2011-23
- 30. TNOs by total cash and short term investments ($M): 2011-23
 2026年全球虚拟网路营运商市场报告
 Apps Run The World - 应用市场分析与买家洞察
 虚拟网路营运商市场(按营运模式、服务技术和地区)
 营运商中立网路营运商 (CNNO) 市场回顾(2024 年第四季):生成式人工智慧 (Generic AI) 热潮加速私募股权投资
 关税情势如何影响美国再生能源成本
 关税情势对美国的再生能源成本带来的影响- 数据
 网路营运商资本支出展望(2024 年第四季版):电信公司持平,但人工智慧驱动的生成式资料中心炒作将推动电信资本支出在 2024 年超过 6,000 亿美元,其中 Scalers 预计将引领市场
 网路营运商永续发展策略的全球市场:2024-2029
 Direct-to-Cell 全球市场:2024-2029