


 |
市场调查报告书
商品编码
1813200
风电市场:产业趋势及全球预测(截至 2035 年):按地点、组件、应用、风力涡轮机容量、投资类型、公司类型和地区划分Wind Power Market, Till 2035: Distribution by Type of Location, Type of Component, Type of Application, Type of Turbine Capacity, Type of Investment, Type of Enterprise, and Geographical Regions: Industry Trends and Global Forecasts |
||||||
风电市场概况
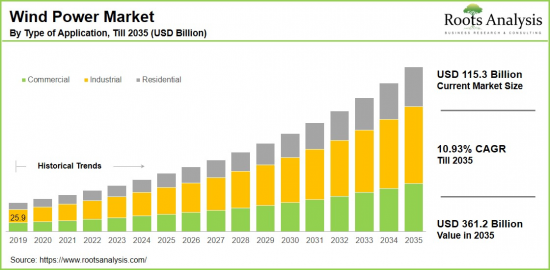
预计到 2035 年,全球风电市场规模将从目前的 1,153 亿美元成长至 3,612 亿美元,预测期内复合年增长率为 10.93%。
风力发电市场机会:分类
定位
- 陆上
- 海上
零组件
- 电力基础设施
- 支援结构
- 涡轮机
- 其他
用途
- 商业用
- 产业用
- 住宅用
涡轮机容量
- 不满100 KW
- 100 KW~500 KW
- 500 KW~1 MW
- 1 MW~3 MW
- 超3 MW
投资类型
- 政府出资计划
- 民间投资
- 官民合作关係
企业类型
- 大企业
- 中小企业
地区
- 北美
- 美国
- 加拿大
- 墨西哥
- 其他的北美各国
- 欧洲
- 奥地利
- 比利时
- 丹麦
- 法国
- 德国
- 爱尔兰
- 义大利
- 荷兰
- 挪威
- 俄罗斯
- 西班牙
- 瑞典
- 瑞士
- 英国
- 其他欧洲各国
- 亚洲
- 中国
- 印度
- 日本
- 新加坡
- 韩国
- 其他亚洲各国
- 南美
- 巴西
- 智利
- 哥伦比亚
- 委内瑞拉
- 其他的南美各国
- 中东·北非
- 埃及
- 伊朗
- 伊拉克
- 以色列
- 科威特
- 沙乌地阿拉伯
- 阿拉伯联合大公国
- 其他的中东·北非各国
- 全球其他地区
- 澳洲
- 纽西兰
- 其他的国家
风电市场:成长与趋势
风能目前是再生能源发电的最大贡献者,约占美国总发电量的10%。这表明风能正在成为一种可行的发电方式,并具有显着的效率。
风能的主要优点包括营运成本低、碳排放少、创造就业机会、为当地社区带来经济效益。此外,根据可用的风能资源,风能可以在各种环境中部署,包括陆上和海上。重要的是,再生能源技术的快速普及和公众意识的不断提升也推动了太阳能利用的成长,尤其是在住宅、商业和製造业领域。根据风能理事会 (Wind Energy Council) 的数据,全球风电装置容量年增 9%,表现稳健。
风电在全球向技术创新和数位转型以提高能源产量的过程中发挥关键作用。尤其是能够利用更强、更稳定风流的离岸风电场,其发展势头强劲。此外,建造更大、更强大的涡轮机(即使在低风速下也能利用更多风能)以及引入先进的转子叶片,将显着提高风能市场分析的效率。
本报告研究了全球风电市场,并提供了市场概况、背景、市场影响因素分析、市场规模趋势和预测、按细分市场和地区进行的详细分析、竞争格局以及主要公司概况。
目录
章节I:报告概要
第1章 序文
第2章 调查手法
第3章 市场动态
第4章 宏观经济指标
章节II:定性洞察
第5章 摘要整理
第6章 简介
第7章 法规Scenario
章节III:市场概要
第8章 主要企业的总括的资料库
第9章 竞争情形
第10章 閒置频段分析
第11章 企业的竞争力分析
第12章 风力发电市场上Start-Ups生态系统
章节IV:企业简介
第13章 企业简介
- 章概要
- Acciona
- Bergey Wind Power
- Clipper Windpowe
- Enercon
- Envision Group
- GE Wind Energy
- Goldwind
- Guodian United Power Technology
- Inoxwind
- Mingyang Group
- Orient Green Power
- Senvion
- Shanghai Electric
- Siemens
- Suzlon Energy
- United Power
- Vestas
章节V:市场趋势
第14章 兆趋势分析
第15章 未满足需求的分析
第16章 专利分析
第17章 最近的趋势
章节VI:市场机会分析
第18章 全球风力发电市场
第19章 各地区的市场机会
第20章 各零件的市场机会
第21章 各用途的市场机会
第22章 各涡轮机容量的市场机会
第23章 各投资类型的市场机会
第24章 各类型企业的市场机会
第25章 北美风力发电的市场机会
第26章 欧洲的风力发电的市场机会
第27章 亚洲的风力发电的市场机会
第28章 中东·北非的风力发电的市场机会
第29章 南美的风力发电的市场机会
第30章 全球其他地区的风力发电的市场机会
第31章 市场集中分析:各主要企业分布
第32章 邻近市场分析
章节VII:策略工具
第33章 重要的胜利策略
第34章 波特的五力分析
第35章 SWOT分析
第36章 价值链分析
第37章 ROOTS的策略建议
章节VIIII:其他独家洞察
第38章 来自初步研究的洞察
第39章 报告书的结论
章节IX:附录
第40章 表格形式资料
第41章 企业·团体一览
第42章 客制化的机会
第43章 ROOTS的订阅服务
第44章 着者详细内容
Wind Power Market Overview
As per Roots Analysis, the global wind power market size is estimated to grow from USD 115.3 billion in the current year to USD 361.2 billion by 2035, at a CAGR of 10.93% during the forecast period, till 2035.
The opportunity for wind power market has been distributed across the following segments:
Type of Location
- Onshore
- Offshore
Type of Component
- Electrical Infrastructure
- Support Structures
- Turbines
- Others
Type of Application
- Commercial
- Industrial
- Residential
Type of Turbine Capacity
- <100 KW
- 100 KW to 500 KW
- 500 KW to 1 MW
- 1MW to 3 MW
- > 3 MW
Type of Investment
- Government-funded projects
- Private sector investments
- Public-private partnerships
Type of Enterprise
- Large
- Small and Medium Enterprise
Geographical Regions
- North America
- US
- Canada
- Mexico
- Other North American countries
- Europe
- Austria
- Belgium
- Denmark
- France
- Germany
- Ireland
- Italy
- Netherlands
- Norway
- Russia
- Spain
- Sweden
- Switzerland
- UK
- Other European countries
- Asia
- China
- India
- Japan
- Singapore
- South Korea
- Other Asian countries
- Latin America
- Brazil
- Chile
- Colombia
- Venezuela
- Other Latin American countries
- Middle East and North Africa
- Egypt
- Iran
- Iraq
- Israel
- Kuwait
- Saudi Arabia
- UAE
- Other MENA countries
- Rest of the World
- Australia
- New Zealand
- Other countries
Wind Power Market: Growth and Trends
At present, wind energy stands as the largest contributor to renewable electricity generation, accounting for nearly 10% of the total electricity produced in the US. This indicates the rise of wind energy as a viable electricity generation method that has shown significant efficiency. It is important to note that wind power plants transform the kinetic energy from wind into electrical energy using a generator; wind turbines are the essential elements of wind power systems.
Some of the key benefits of wind energy include lower operational costs, decreased carbon emissions, job creation, and economic advantages for local communities. Moreover, wind energy can be implemented in various environments, both onshore and offshore, depending on the available wind resources. It is also important to mention that the use of solar energy in key industries is increasing due to the rapid adoption of renewable technologies and growing public awareness, particularly in residential, commercial, and manufacturing sectors. Interestingly, the global wind capacity has seen a healthy year-over-year increase of 9%, according to the Wind Energy Council.
The wind power sector is becoming crucial in the worldwide transition towards innovation and digital progress in order to achieve enhanced energy production. The development of offshore wind farms is gaining momentum as they take advantage of stronger and more consistent wind patterns. Furthermore, constructing larger and more powerful turbines that can harness greater wind energy even at lower speeds, combined with advanced rotor blades, marks a significant modernization in wind energy market analysis efficiency.
As a result, with ongoing technological advancements in wind energy and the rising demand for renewable energy generation, the wind power industry is expected to experience considerable growth during this forecast period.
Wind Power Market: Key Segments
Market Share by Type of Location
Based on type of location, the global wind power market is segmented into onshore and offshore. According to our estimates, currently, the onshore segment captures the majority of the market share, owing to its increased efficiency, reduced operational costs, and its established presence in nations like the US and China.
However, the offshore segment is expected to grow at a higher CAGR during the forecast period. This growth is linked to its access to stronger and more consistent wind speeds, which boosts energy production, along with supportive government policies.
Market Share by Type of Component
Based on type of component, the global wind power market is segmented into electrical infrastructure, support structures, turbines and others. According to our estimates, currently, the desalination segment captures the majority of the market share.
Furthermore, this segment is projected to experience the highest compound annual growth rate (CAGR) during the forecast period. This can be linked to its design, especially horizontal-axis turbines, which are highly efficient and capable of producing substantial amounts of electricity, thus making them more appealing to investors and developers.
Market Share by Type of Application
Based on type of application, the global wind power market is segmented into commercial, industrial and residential. According to our estimates, currently, the industrial segment captures the majority of the market share. This growth can be attributed to the increasing need for renewable energy market research sources among industrial entities aiming to lower their carbon emissions and cut down on operational expenses, along with advancements in technology.
Market Share by Type of Turbine Capacity
Based on type of turbine capacity, the global wind power market is segmented into <100 KW, 100 KW to 500 KW, 500 KW to 1 MW, 1MW to 3 MW and > 3 MW. According to our estimates, currently, the > 3 MW segment captures the majority of the market share. This can be attributed to its capacity to produce more electricity per unit, which improves the financial viability of wind projects.
However, the 500 KW to 1 MW segment is expected to grow at a higher CAGR during the forecast period. This growth can be attributed to its adaptability for both small to medium-sized projects and utility-scale initiatives, making it suitable for a wide range of applications.
Market Share by Type of Investment
Based on type of investment, the global wind power market is segmented into government-funded projects, private sector investments and public-private partnerships. According to our estimates, currently, the private sector investments capture the majority of the market share.
This can be attributed to progress in wind energy technology, which has notably reduced costs, while government support and private sector funding tend to be more flexible and responsive to market needs in comparison to government-funded initiatives.
Market Share by Type of Enterprise
Based on type of enterprise, the global wind power market is segmented into large and small and medium enterprise. According to our estimates, currently, the large-scale farms capture the majority of the market share. This can be attributed to their ability to invest in cutting-edge wind energy generation technologies and equipment, take advantage of government programs, achieve economies of scale, and foster business expansion.
Market Share by Geographical Regions
Based on geographical regions, the wind power market is segmented into North America, Europe, Asia, Latin America, Middle East and North Africa, and the rest of the world. According to our estimates, currently Asia captures the majority share of the market. This can be attributed to the abundant wind resources, government support and investments, rapid population increase, and rising energy demand in nations like China and India.
Example Players in Wind Power Market
- Acciona
- Bergey Wind Power
- Clipper Windpower
- Enercon
- Envision Group
- GE Wind Energy
- Goldwind
- Guodian United Power Technology
- Inoxwind
- Mingyang Group
- Orient Green Power
- Senvion
- Shanghai Electric
- Siemens
- Suzlon Energy
- United Power
- Vestas
Wind Power Market: Research Coverage
The report on the wind power market features insights on various sections, including:
- Market Sizing and Opportunity Analysis: An in-depth analysis of the wind power market, focusing on key market segments, including [A] type of location, [B] type of component, [C] type of application, [D] type of turbine capacity, [E] type of investment, [F] type of enterprise, and [G] geographical regions.
- Competitive Landscape: A comprehensive analysis of the companies engaged in the wind power market, based on several relevant parameters, such as [A] year of establishment, [B] company size, [C] location of headquarters and [D] ownership structure.
- Company Profiles: Elaborate profiles of prominent players engaged in the wind power market, providing details on [A] location of headquarters, [B] company size, [C] company mission, [D] company footprint, [E] management team, [F] contact details, [G] financial information, [H] operating business segments, [I] wind power portfolio, [J] moat analysis, [K] recent developments, and an informed future outlook.
- Megatrends: An evaluation of ongoing megatrends in wind power industry.
- Patent Analysis: An insightful analysis of patents filed / granted in the wind power domain, based on relevant parameters, including [A] type of patent, [B] patent publication year, [C] patent age and [D] leading players.
- Recent Developments: An overview of the recent developments made in the wind power market, along with analysis based on relevant parameters, including [A] year of initiative, [B] type of initiative, [C] geographical distribution and [D] most active players.
- Porter's Five Forces Analysis: An analysis of five competitive forces prevailing in the wind power market, including threats of new entrants, bargaining power of buyers, bargaining power of suppliers, threats of substitute products and rivalry among existing competitors.
- SWOT Analysis: An insightful SWOT framework, highlighting the strengths, weaknesses, opportunities and threats in the domain. Additionally, it provides Harvey ball analysis, highlighting the relative impact of each SWOT parameter.
- Value Chain Analysis: A comprehensive analysis of the value chain, providing information on the different phases and stakeholders involved in the wind power market
Key Questions Answered in this Report
- How many companies are currently engaged in wind power market?
- Which are the leading companies in this market?
- What factors are likely to influence the evolution of this market?
- What is the current and future market size?
- What is the CAGR of this market?
- How is the current and future market opportunity likely to be distributed across key market segments?
Reasons to Buy this Report
- The report provides a comprehensive market analysis, offering detailed revenue projections of the overall market and its specific sub-segments. This information is valuable to both established market leaders and emerging entrants.
- Stakeholders can leverage the report to gain a deeper understanding of the competitive dynamics within the market. By analyzing the competitive landscape, businesses can make informed decisions to optimize their market positioning and develop effective go-to-market strategies.
- The report offers stakeholders a comprehensive overview of the market, including key drivers, barriers, opportunities, and challenges. This information empowers stakeholders to stay abreast of market trends and make data-driven decisions to capitalize on growth prospects.
Additional Benefits
- Complimentary Excel Data Packs for all Analytical Modules in the Report
- 15% Free Content Customization
- Detailed Report Walkthrough Session with Research Team
- Free Updated report if the report is 6-12 months old or older
TABLE OF CONTENTS
SECTION I: REPORT OVERVIEW
1. PREFACE
- 1.1. Introduction
- 1.2. Market Share Insights
- 1.3. Key Market Insights
- 1.4. Report Coverage
- 1.5. Key Questions Answered
- 1.6. Chapter Outlines
2. RESEARCH METHODOLOGY
- 2.1. Chapter Overview
- 2.2. Research Assumptions
- 2.3. Database Building
- 2.3.1. Data Collection
- 2.3.2. Data Validation
- 2.3.3. Data Analysis
- 2.4. Project Methodology
- 2.4.1. Secondary Research
- 2.4.1.1. Annual Reports
- 2.4.1.2. Academic Research Papers
- 2.4.1.3. Company Websites
- 2.4.1.4. Investor Presentations
- 2.4.1.5. Regulatory Filings
- 2.4.1.6. White Papers
- 2.4.1.7. Industry Publications
- 2.4.1.8. Conferences and Seminars
- 2.4.1.9. Government Portals
- 2.4.1.10. Media and Press Releases
- 2.4.1.11. Newsletters
- 2.4.1.12. Industry Databases
- 2.4.1.13. Roots Proprietary Databases
- 2.4.1.14. Paid Databases and Sources
- 2.4.1.15. Social Media Portals
- 2.4.1.16. Other Secondary Sources
- 2.4.2. Primary Research
- 2.4.2.1. Introduction
- 2.4.2.2. Types
- 2.4.2.2.1. Qualitative
- 2.4.2.2.2. Quantitative
- 2.4.2.3. Advantages
- 2.4.2.4. Techniques
- 2.4.2.4.1. Interviews
- 2.4.2.4.2. Surveys
- 2.4.2.4.3. Focus Groups
- 2.4.2.4.4. Observational Research
- 2.4.2.4.5. Social Media Interactions
- 2.4.2.5. Stakeholders
- 2.4.2.5.1. Company Executives (CXOs)
- 2.4.2.5.2. Board of Directors
- 2.4.2.5.3. Company Presidents and Vice Presidents
- 2.4.2.5.4. Key Opinion Leaders
- 2.4.2.5.5. Research and Development Heads
- 2.4.2.5.6. Technical Experts
- 2.4.2.5.7. Subject Matter Experts
- 2.4.2.5.8. Scientists
- 2.4.2.5.9. Doctors and Other Healthcare Providers
- 2.4.2.6. Ethics and Integrity
- 2.4.2.6.1. Research Ethics
- 2.4.2.6.2. Data Integrity
- 2.4.3. Analytical Tools and Databases
- 2.4.1. Secondary Research
3. MARKET DYNAMICS
- 3.1. Forecast Methodology
- 3.1.1. Top-Down Approach
- 3.1.2. Bottom-Up Approach
- 3.1.3. Hybrid Approach
- 3.2. Market Assessment Framework
- 3.2.1. Total Addressable Market (TAM)
- 3.2.2. Serviceable Addressable Market (SAM)
- 3.2.3. Serviceable Obtainable Market (SOM)
- 3.2.4. Currently Acquired Market (CAM)
- 3.3. Forecasting Tools and Techniques
- 3.3.1. Qualitative Forecasting
- 3.3.2. Correlation
- 3.3.3. Regression
- 3.3.4. Time Series Analysis
- 3.3.5. Extrapolation
- 3.3.6. Convergence
- 3.3.7. Forecast Error Analysis
- 3.3.8. Data Visualization
- 3.3.9. Scenario Planning
- 3.3.10. Sensitivity Analysis
- 3.4. Key Considerations
- 3.4.1. Demographics
- 3.4.2. Market Access
- 3.4.3. Reimbursement Scenarios
- 3.4.4. Industry Consolidation
- 3.5. Robust Quality Control
- 3.6. Key Market Segmentations
- 3.7. Limitations
4. MACRO-ECONOMIC INDICATORS
- 4.1. Chapter Overview
- 4.2. Market Dynamics
- 4.2.1. Time Period
- 4.2.1.1. Historical Trends
- 4.2.1.2. Current and Forecasted Estimates
- 4.2.2. Currency Coverage
- 4.2.2.1. Overview of Major Currencies Affecting the Market
- 4.2.2.2. Impact of Currency Fluctuations on the Industry
- 4.2.3. Foreign Exchange Impact
- 4.2.3.1. Evaluation of Foreign Exchange Rates and Their Impact on Market
- 4.2.3.2. Strategies for Mitigating Foreign Exchange Risk
- 4.2.4. Recession
- 4.2.4.1. Historical Analysis of Past Recessions and Lessons Learnt
- 4.2.4.2. Assessment of Current Economic Conditions and Potential Impact on the Market
- 4.2.5. Inflation
- 4.2.5.1. Measurement and Analysis of Inflationary Pressures in the Economy
- 4.2.5.2. Potential Impact of Inflation on the Market Evolution
- 4.2.6. Interest Rates
- 4.2.6.1. Overview of Interest Rates and Their Impact on the Market
- 4.2.6.2. Strategies for Managing Interest Rate Risk
- 4.2.7. Commodity Flow Analysis
- 4.2.7.1. Type of Commodity
- 4.2.7.2. Origins and Destinations
- 4.2.7.3. Values and Weights
- 4.2.7.4. Modes of Transportation
- 4.2.8. Global Trade Dynamics
- 4.2.8.1. Import Scenario
- 4.2.8.2. Export Scenario
- 4.2.9. War Impact Analysis
- 4.2.9.1. Russian-Ukraine War
- 4.2.9.2. Israel-Hamas War
- 4.2.10. COVID Impact / Related Factors
- 4.2.10.1. Global Economic Impact
- 4.2.10.2. Industry-specific Impact
- 4.2.10.3. Government Response and Stimulus Measures
- 4.2.10.4. Future Outlook and Adaptation Strategies
- 4.2.11. Other Indicators
- 4.2.11.1. Fiscal Policy
- 4.2.11.2. Consumer Spending
- 4.2.11.3. Gross Domestic Product (GDP)
- 4.2.11.4. Employment
- 4.2.11.5. Taxes
- 4.2.11.6. R&D Innovation
- 4.2.11.7. Stock Market Performance
- 4.2.11.8. Supply Chain
- 4.2.11.9. Cross-Border Dynamics
- 4.2.1. Time Period
SECTION II: QUALITATIVE INSIGHTS
5. EXECUTIVE SUMMARY
6. INTRODUCTION
- 6.1. Chapter Overview
- 6.2. Overview of Wind Power Market
- 6.2.1. Type of Location
- 6.2.2. Type of Component
- 6.2.3. Type of Application
- 6.2.4. Type of Turbine Capacity
- 6.2.5. Type of Investment
- 6.2.6. Type of Enterprise
- 6.3. Future Perspective
7. REGULATORY SCENARIO
SECTION III: MARKET OVERVIEW
8. COMPREHENSIVE DATABASE OF LEADING PLAYERS
9. COMPETITIVE LANDSCAPE
- 9.1. Chapter Overview
- 9.2. Wind Power: Overall Market Landscape
- 9.2.1. Analysis by Year of Establishment
- 9.2.2. Analysis by Company Size
- 9.2.3. Analysis by Location of Headquarters
- 9.2.4. Analysis by Ownership Structure
10. WHITE SPACE ANALYSIS
11. COMPANY COMPETITIVENESS ANALYSIS
12. STARTUP ECOSYSTEM IN THE WIND POWER MARKET
- 12.1. Wind Power Market: Market Landscape of Startups
- 12.1.1. Analysis by Year of Establishment
- 12.1.2. Analysis by Company Size
- 12.1.3. Analysis by Company Size and Year of Establishment
- 12.1.4. Analysis by Location of Headquarters
- 12.1.5. Analysis by Company Size and Location of Headquarters
- 12.1.6. Analysis by Ownership Structure
- 12.2. Key Findings
SECTION IV: COMPANY PROFILES
13. COMPANY PROFILES
- 13.1. Chapter Overview
- 13.2. Acciona*
- 13.2.1. Company Overview
- 13.2.2. Company Mission
- 13.2.3. Company Footprint
- 13.2.4. Management Team
- 13.2.5. Contact Details
- 13.2.6. Financial Performance
- 13.2.7. Operating Business Segments
- 13.2.8. Service / Product Portfolio (project specific)
- 13.2.9. MOAT Analysis
- 13.2.10. Recent Developments and Future Outlook
- 13.3. Bergey Wind Power
- 13.4. Clipper Windpowe
- 13.5. Enercon
- 13.6. Envision Group
- 13.7. GE Wind Energy
- 13.8. Goldwind
- 13.9. Guodian United Power Technology
- 13.10. Inoxwind
- 13.11. Mingyang Group
- 13.12. Orient Green Power
- 13.13. Senvion
- 13.14. Shanghai Electric
- 13.15. Siemens
- 13.16. Suzlon Energy
- 13.17. United Power
- 13.18. Vestas
SECTION V: MARKET TRENDS
14. MEGA TRENDS ANALYSIS
15. UNMEET NEED ANALYSIS
16. PATENT ANALYSIS
17. RECENT DEVELOPMENTS
- 17.1. Chapter Overview
- 17.2. Recent Funding
- 17.3. Recent Partnerships
- 17.4. Other Recent Initiatives
SECTION VI: MARKET OPPORTUNITY ANALYSIS
18. GLOBAL WIND POWER MARKET
- 18.1. Chapter Overview
- 18.2. Key Assumptions and Methodology
- 18.3. Trends Disruption Impacting Market
- 18.4. Demand Side Trends
- 18.5. Supply Side Trends
- 18.6. Global Wind Power Market, Historical Trends (Since 2019) and Forecasted Estimates (Till 2035)
- 18.7. Multivariate Scenario Analysis
- 18.7.1. Conservative Scenario
- 18.7.2. Optimistic Scenario
- 18.8. Investment Feasibility Index
- 18.9. Key Market Segmentations
19. MARKET OPPORTUNITIES BASED ON TYPE OF LOCATION
- 19.1. Chapter Overview
- 19.2. Key Assumptions and Methodology
- 19.3. Revenue Shift Analysis
- 19.4. Market Movement Analysis
- 19.5. Penetration-Growth (P-G) Matrix
- 19.6. Wind Power Market for Onshore: Historical Trends (Since 2019) and Forecasted Estimates (Till 2035)
- 19.7. Wind Power Market for Offshore: Historical Trends (Since 2019) and Forecasted Estimates (Till 2035)
- 19.8. Data Triangulation and Validation
- 19.8.1. Secondary Sources
- 19.8.2. Primary Sources
- 19.8.3. Statistical Modeling
20. MARKET OPPORTUNITIES BASED ON TYPE OF COMPONENT
- 20.1. Chapter Overview
- 20.2. Key Assumptions and Methodology
- 20.3. Revenue Shift Analysis
- 20.4. Market Movement Analysis
- 20.5. Penetration-Growth (P-G) Matrix
- 20.6. Wind Power Market for Electrical Infrastructure: Historical Trends (Since 2019) and Forecasted Estimates (Till 2035)
- 20.7. Wind Power Market for Support Structures: Historical Trends (Since 2019) and Forecasted Estimates (Till 2035)
- 20.8. Wind Power Market for Turbines: Historical Trends (Since 2019) and Forecasted Estimates (Till 2035)
- 20.9. Wind Power Market for Others: Historical Trends (Since 2019) and Forecasted Estimates (Till 2035)
- 20.10. Data Triangulation and Validation
- 20.10.1. Secondary Sources
- 20.10.2. Primary Sources
- 20.10.3. Statistical Modeling
21. MARKET OPPORTUNITIES BASED ON TYPE OF APPLICATION
- 21.1. Chapter Overview
- 21.2. Key Assumptions and Methodology
- 21.3. Revenue Shift Analysis
- 21.4. Market Movement Analysis
- 21.5. Penetration-Growth (P-G) Matrix
- 21.6. Wind Power Market for Commercial: Historical Trends (Since 2019) and Forecasted Estimates (Till 2035)
- 21.7. Wind Power Market for Industrial: Historical Trends (Since 2019) and Forecasted Estimates (Till 2035)
- 21.8. Wind Power Market for Residential: Historical Trends (Since 2019) and Forecasted Estimates (Till 2035)
- 21.9. Data Triangulation and Validation
- 21.9.1. Secondary Sources
- 21.9.2. Primary Sources
- 21.9.3. Statistical Modeling
22. MARKET OPPORTUNITIES BASED ON TYPE OF TURBINE CAPACITY
- 22.1. Chapter Overview
- 22.2. Key Assumptions and Methodology
- 22.3. Revenue Shift Analysis
- 22.4. Market Movement Analysis
- 22.5. Penetration-Growth (P-G) Matrix
- 22.6. Wind Power Market for <100 KW: Historical Trends (Since 2019) and Forecasted Estimates (Till 2035)
- 22.7. Wind Power Market for 100 KW to 500 KW: Historical Trends (Since 2019) and Forecasted Estimates (Till 2035)
- 22.8. Wind Power Market for 500 KW to 1 MW: Historical Trends (Since 2019) and Forecasted Estimates (Till 2035)
- 22.9. Wind Power Market for 1MW to 3 MW: Historical Trends (Since 2019) and Forecasted Estimates (Till 2035)
- 22.10. Wind Power Market for > 3 MW: Historical Trends (Since 2019) and Forecasted Estimates (Till 2035)
- 22.11. Data Triangulation and Validation
- 22.11.1. Secondary Sources
- 22.11.2. Primary Sources
- 22.11.3. Statistical Modeling
23. MARKET OPPORTUNITIES BASED ON TYPE OF INVESTMENT
- 23.1. Chapter Overview
- 23.2. Key Assumptions and Methodology
- 23.3. Revenue Shift Analysis
- 23.4. Market Movement Analysis
- 23.5. Penetration-Growth (P-G) Matrix
- 23.6. Wind Power Market for Government-Funded Projects: Historical Trends (Since 2019) and Forecasted Estimates (Till 2035)
- 23.7. Wind Power Market for Private Sector Investments: Historical Trends (Since 2019) and Forecasted Estimates (Till 2035)
- 23.8. Wind Power Market for Public-Private Partnerships: Historical Trends (Since 2019) and Forecasted Estimates (Till 2035)
- 23.9. Data Triangulation and Validation
- 23.9.1. Secondary Sources
- 23.9.2. Primary Sources
- 23.9.3. Statistical Modeling
24. MARKET OPPORTUNITIES BASED ON TYPE OF ENTERPRISE
- 24.1. Chapter Overview
- 24.2. Key Assumptions and Methodology
- 24.3. Revenue Shift Analysis
- 24.4. Market Movement Analysis
- 24.5. Penetration-Growth (P-G) Matrix
- 24.6. Wind Power Market for Large: Historical Trends (Since 2019) and Forecasted Estimates (Till 2035)
- 24.7. Wind Power Market for Small and Medium Enterprise: Historical Trends (Since 2019) and Forecasted Estimates (Till 2035)
- 24.8. Data Triangulation and Validation
- 24.8.1. Secondary Sources
- 24.8.2. Primary Sources
- 24.8.3. Statistical Modeling
25. MARKET OPPORTUNITIES FOR WIND POWER IN NORTH AMERICA
- 25.1. Chapter Overview
- 25.2. Key Assumptions and Methodology
- 25.3. Revenue Shift Analysis
- 25.4. Market Movement Analysis
- 25.5. Penetration-Growth (P-G) Matrix
- 25.6. Wind Power Market in North America: Historical Trends (Since 2019) and Forecasted Estimates (Till 2035)
- 25.6.1. Wind Power Market in the US: Historical Trends (Since 2019) and Forecasted Estimates (Till 2035)
- 25.6.2. Wind Power Market in Canada: Historical Trends (Since 2019) and Forecasted Estimates (Till 2035)
- 25.6.3. Wind Power Market in Mexico: Historical Trends (Since 2019) and Forecasted Estimates (Till 2035)
- 25.6.4. Wind Power Market in Other North American Countries: Historical Trends (Since 2019) and Forecasted Estimates (Till 2035)
- 25.7. Data Triangulation and Validation
26. MARKET OPPORTUNITIES FOR WIND POWER IN EUROPE
- 26.1. Chapter Overview
- 26.2. Key Assumptions and Methodology
- 26.3. Revenue Shift Analysis
- 26.4. Market Movement Analysis
- 26.5. Penetration-Growth (P-G) Matrix
- 26.6. Wind Power Market in Europe: Historical Trends (Since 2019) and Forecasted Estimates (Till 2035)
- 26.6.1. Wind Power Market in Austria: Historical Trends (Since 2019) and Forecasted Estimates (Till 2035)
- 26.6.2. Wind Power Market in Belgium: Historical Trends (Since 2019) and Forecasted Estimates (Till 2035)
- 26.6.3. Wind Power Market in Denmark: Historical Trends (Since 2019) and Forecasted Estimates (Till 2035)
- 26.6.4. Wind Power Market in France: Historical Trends (Since 2019) and Forecasted Estimates (Till 2035)
- 26.6.5. Wind Power Market in Germany: Historical Trends (Since 2019) and Forecasted Estimates (Till 2035)
- 26.6.6. Wind Power Market in Ireland: Historical Trends (Since 2019) and Forecasted Estimates (Till 2035)
- 26.6.7. Wind Power Market in Italy: Historical Trends (Since 2019) and Forecasted Estimates (Till 2035)
- 26.6.8. Wind Power Market in Netherlands: Historical Trends (Since 2019) and Forecasted Estimates (Till 2035)
- 26.6.9. Wind Power Market in Norway: Historical Trends (Since 2019) and Forecasted Estimates (Till 2035)
- 26.6.10. Wind Power Market in Russia: Historical Trends (Since 2019) and Forecasted Estimates (Till 2035)
- 26.6.11. Wind Power Market in Spain: Historical Trends (Since 2019) and Forecasted Estimates (Till 2035)
- 26.6.12. Wind Power Market in Sweden: Historical Trends (Since 2019) and Forecasted Estimates (Till 2035)
- 26.6.13. Wind Power Market in Switzerland: Historical Trends (Since 2019) and Forecasted Estimates (Till 2035)
- 26.6.14. Wind Power Market in the UK: Historical Trends (Since 2019) and Forecasted Estimates (Till 2035)
- 26.6.15. Wind Power Market in Other European Countries: Historical Trends (Since 2019) and Forecasted Estimates (Till 2035)
- 26.7. Data Triangulation and Validation
27. MARKET OPPORTUNITIES FOR WIND POWER IN ASIA
- 27.1. Chapter Overview
- 27.2. Key Assumptions and Methodology
- 27.3. Revenue Shift Analysis
- 27.4. Market Movement Analysis
- 27.5. Penetration-Growth (P-G) Matrix
- 27.6. Wind Power Market in Asia: Historical Trends (Since 2019) and Forecasted Estimates (Till 2035)
- 27.6.1. Wind Power Market in China: Historical Trends (Since 2019) and Forecasted Estimates (Till 2035)
- 27.6.2. Wind Power Market in India: Historical Trends (Since 2019) and Forecasted Estimates (Till 2035)
- 27.6.3. Wind Power Market in Japan: Historical Trends (Since 2019) and Forecasted Estimates (Till 2035)
- 27.6.4. Wind Power Market in Singapore: Historical Trends (Since 2019) and Forecasted Estimates (Till 2035)
- 27.6.5. Wind Power Market in South Korea: Historical Trends (Since 2019) and Forecasted Estimates (Till 2035)
- 27.6.6. Wind Power Market in Other Asian Countries: Historical Trends (Since 2019) and Forecasted Estimates (Till 2035)
- 27.7. Data Triangulation and Validation
28. MARKET OPPORTUNITIES FOR WIND POWER IN MIDDLE EAST AND NORTH AFRICA (MENA)
- 28.1. Chapter Overview
- 28.2. Key Assumptions and Methodology
- 28.3. Revenue Shift Analysis
- 28.4. Market Movement Analysis
- 28.5. Penetration-Growth (P-G) Matrix
- 28.6. Wind Power Market in Middle East and North Africa (MENA): Historical Trends (Since 2019) and Forecasted Estimates (Till 2035)
- 28.6.1. Wind Power Market in Egypt: Historical Trends (Since 2019) and Forecasted Estimates (Till 205)
- 28.6.2. Wind Power Market in Iran: Historical Trends (Since 2019) and Forecasted Estimates (Till 2035)
- 28.6.3. Wind Power Market in Iraq: Historical Trends (Since 2019) and Forecasted Estimates (Till 2035)
- 28.6.4. Wind Power Market in Israel: Historical Trends (Since 2019) and Forecasted Estimates (Till 2035)
- 28.6.5. Wind Power Market in Kuwait: Historical Trends (Since 2019) and Forecasted Estimates (Till 2035)
- 28.6.6. Wind Power Market in Saudi Arabia: Historical Trends (Since 2019) and Forecasted Estimates (Till 2035)
- 28.6.7. Wind Power Market in United Arab Emirates (UAE): Historical Trends (Since 2019) and Forecasted Estimates (Till 2035)
- 28.6.8. Wind Power Market in Other MENA Countries: Historical Trends (Since 2019) and Forecasted Estimates (Till 2035)
- 28.7. Data Triangulation and Validation
29. MARKET OPPORTUNITIES FOR WIND POWER IN LATIN AMERICA
- 29.1. Chapter Overview
- 29.2. Key Assumptions and Methodology
- 29.3. Revenue Shift Analysis
- 29.4. Market Movement Analysis
- 29.5. Penetration-Growth (P-G) Matrix
- 29.6. Wind Power Market in Latin America: Historical Trends (Since 2019) and Forecasted Estimates (Till 2035)
- 29.6.1. Wind Power Market in Argentina: Historical Trends (Since 2019) and Forecasted Estimates (Till 2035)
- 29.6.2. Wind Power Market in Brazil: Historical Trends (Since 2019) and Forecasted Estimates (Till 2035)
- 29.6.3. Wind Power Market in Chile: Historical Trends (Since 2019) and Forecasted Estimates (Till 2035)
- 29.6.4. Wind Power Market in Colombia Historical Trends (Since 2019) and Forecasted Estimates (Till 2035)
- 29.6.5. Wind Power Market in Venezuela: Historical Trends (Since 2019) and Forecasted Estimates (Till 2035)
- 29.6.6. Wind Power Market in Other Latin American Countries: Historical Trends (Since 2019) and Forecasted Estimates (Till 2035)
- 29.7. Data Triangulation and Validation
30. MARKET OPPORTUNITIES FOR WIND POWER IN REST OF THE WORLD
- 30.1. Chapter Overview
- 30.2. Key Assumptions and Methodology
- 30.3. Revenue Shift Analysis
- 30.4. Market Movement Analysis
- 30.5. Penetration-Growth (P-G) Matrix
- 30.6. Wind Power Market in Rest of the World: Historical Trends (Since 2019) and Forecasted Estimates (Till 2035)
- 30.6.1. Wind Power Market in Australia: Historical Trends (Since 2019) and Forecasted Estimates (Till 2035)
- 30.6.2. Wind Power Market in New Zealand: Historical Trends (Since 2019) and Forecasted Estimates (Till 2035)
- 30.6.3. Wind Power Market in Other Countries
- 30.7. Data Triangulation and Validation
31. MARKET CONCENTRATION ANALYSIS: DISTRIBUTION BY LEADING PLAYERS
- 31.1. Leading Player 1
- 31.2. Leading Player 2
- 31.3. Leading Player 3
- 31.4. Leading Player 4
- 31.5. Leading Player 5
- 31.6. Leading Player 6
- 31.7. Leading Player 7
- 31.8. Leading Player 8
32. ADJACENT MARKET ANALYSIS
SECTION VII: STRATEGIC TOOLS
33. KEY WINNING STRATEGIES
34. PORTER'S FIVE FORCES ANALYSIS
35. SWOT ANALYSIS
36. VALUE CHAIN ANALYSIS
37. ROOTS STRATEGIC RECOMMENDATIONS
- 37.1. Chapter Overview
- 37.2. Key Business-related Strategies
- 37.2.1. Research & Development
- 37.2.2. Product Manufacturing
- 37.2.3. Commercialization / Go-to-Market
- 37.2.4. Sales and Marketing
- 37.3. Key Operations-related Strategies
- 37.3.1. Risk Management
- 37.3.2. Workforce
- 37.3.3. Finance
- 37.3.4. Others
SECTION VIII: OTHER EXCLUSIVE INSIGHTS
38. INSIGHTS FROM PRIMARY RESEARCH
39. REPORT CONCLUSION
SECTION IX: APPENDIX
40. TABULATED DATA
41. LIST OF COMPANIES AND ORGANIZATIONS
42. CUSTOMIZATION OPPORTUNITIES
43. ROOTS SUBSCRIPTION SERVICES
44. AUTHOR DETAILS
 风力发电市场:2026-2032年全球市场预测(依涡轮机类型、涡轮机尺寸、零件和应用划分)风力涡轮机控制器市场:控制器类型、产品、最终用户、涡轮机类型、连接方式-2026-2032年全球市场预测
 2026年全球分散式风电市场报告2026年全球风力发电市场报告
 日本风力发电市场:规模、份额、趋势和预测:按地区划分,2026-2034年风力发电机速度放大器市场:依产品类型、级数、应用、最终用户和销售管道,全球预测,2026-2032年
 中东和非洲风力发电:市场份额分析、行业趋势和统计数据、成长预测(2026-2031 年)
 无吊风力发电系统:全球市场份额和排名、总收入和需求预测(2025-2031 年)
 全球风力涡轮机市场
 2024-2040年欧盟氢动力卡车(H2 ICE)产业二氧化碳排放生命週期