


 |
市场调查报告书
商品编码
1849795
智慧材料的全球市场(~2035年):各材料类型,各用途类型,各终端用户类型,各地区,产业趋势,预测Smart Materials Market, Till 2035: Distribution by Type of Material, Type of Application, Type of End User, Geographical Regions: Industry Trends and Global Forecasts |
||||||
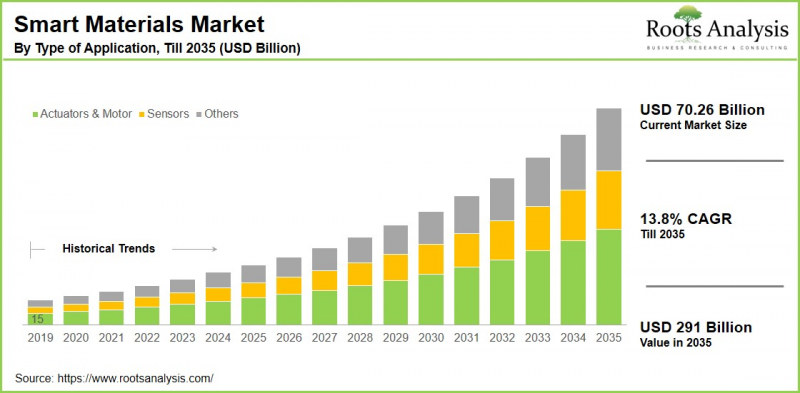
全球智慧材料市场预计将从目前的 702.6 亿美元成长到 2035 年的 2,910 亿美元,预测期内复合年增长率 (CAGR) 为 13.8%。
智慧材料市场:成长与趋势
智慧材料,也称为响应型或智慧材料,是一类先进材料,具有独特的性能,能够响应压力、温度、电场或磁场等外部刺激而改变自身特性。凭藉其独特的性能,智慧材料正被应用于各个产业,成为从航空到能源等各个领域的重要组成部分。
智慧材料能够根据环境因素改变自身特性,具有高度的适应性和多功能性,并拥有增强的感知能力,这使得它们在多种应用领域中用途广泛且极具价值。例如,压电材料需求量大,广泛应用于感测器、致动器和超音波换能器中,将机械能转换为电能。同样,磁流变液等智慧型流体则用于自适应避震器、离合器和阻尼器。
此外,智慧材料的优势,例如自修復能力、更高的耐久性和能源效率,正吸引企业和产业采用先进的技术和材料。同时,科技的快速发展也推动了更智慧、更有效率的材料研发,为智慧材料市场的成长开闢了新的途径。因此,越来越多的公司正在投入研发资源,利用尖端技术来满足医疗保健和建筑等领域对客製化解决方案日益增长的需求。考虑到这些因素,预计智慧材料市场在预测期内将显着成长。
本报告分析了全球智慧材料市场,并提供市场规模估算、机会分析、竞争格局和公司简介等资讯。
目录
第1章 序文
第2章 调查手法
第3章 经济考虑事项,其他的计划特有的考虑事项
第4章 宏观经济指标
第5章 摘要整理
第6章 简介
第7章 竞争情形
第8章 企业简介
- 章概要
- AMETEK
- APC International
- Arkema
- Cerametric
- CeramTech
- Channel Technologies
- Confluent Medical Technologies
- CTS
- Gentex
- Harris
- Huntsman
- Johnson Matthey
- Kyocera
- LORD
- Noliac A/S
- Piezo Kinetics
- QorTek
- SAGE Electrochromics
- Solvay
- TDK
- The Lubrizol
- Wright Medical Group
第9章 价值链的分析
第10章 SWOT的分析
第11章 全球智慧材料市场
第12章 市场机会:各材料类型
第13章 市场机会:各用途类型
第14章 市场机会:各终端用户类型
第15章 北美的智慧材料市场机会
第16章 欧洲的智慧材料市场机会
第17章 亚洲的智慧材料市场机会
第18章 中东·北非(MENA)的智慧材料市场机会
第19章 南美的智慧材料市场机会
第20章 其他地区的智慧材料市场机会
第21章 表格形式资料
第22章 企业·团体的清单
第23章 客制化的机会
第24章 Roots的订阅服务
第25章 着者详细内容
Smart Materials Market Overview
As per Roots Analysis, the global smart materials market size is estimated to grow from USD 70.26 billion in the current year USD 291 billion by 2035, at a CAGR of 13.8% during the forecast period, till 2035.
The opportunity for smart materials market has been distributed across the following segments:
Type of Material
- Electrochromic
- Electrostrictive
- Magnetostrictive
- Phase Change Material
- Piezoelectric
- Shape Memory Alloys
- Smart Fluids
Type of Application
- Actuators & Motor
- Sensors
- Structural Materials
- Transducers
- Others
Type of End User
- Aerospace & Defense
- Automotive
- Construction
- Consumer Electronics
- Healthcare
- Others
Geographical Regions
- North America
- US
- Canada
- Mexico
- Other North American countries
- Europe
- Austria
- Belgium
- Denmark
- France
- Germany
- Ireland
- Italy
- Netherlands
- Norway
- Russia
- Spain
- Sweden
- Switzerland
- UK
- Other European countries
- Asia
- China
- India
- Japan
- Singapore
- South Korea
- Other Asian countries
- Latin America
- Brazil
- Chile
- Colombia
- Venezuela
- Other Latin American countries
- Middle East and North Africa
- Egypt
- Iran
- Iraq
- Israel
- Kuwait
- Saudi Arabia
- UAE
- Other MENA countries
- Rest of the World
- Australia
- New Zealand
- Other countries
Smart Materials Market: Growth and Trends
Smart materials, referred to as responsive or intelligent materials, are a category of advanced materials that possess the unique ability to change their properties in reaction to external stimuli such as pressure, temperature, and electric or magnetic fields. Due to their distinctive characteristics, smart materials are increasingly being adopted in various industries, serving as essential components in sectors ranging from aviation to energy.
Their ability to alter their properties based on environmental factors, along with their adaptive multifunctionality and heightened sensory capabilities, render them highly versatile and valuable for multiple applications. For example, piezoelectric materials are in high demand and utilized in sensors, actuators, and ultrasonic transducers to transform mechanical energy into electrical energy. Similarly, smart fluids like magnetorheological fluids are employed in adaptive shock absorbers, clutches, and dampers.
Moreover, the benefits of smart materials, such as self-healing capabilities, improved durability, and energy efficiency, attract businesses and industries to adopt advanced technologies and materials. Additionally, rapid advancements in technology enables the creation of smarter, more efficient materials open up new avenues for the growth of the smart material market. Consequently, an increasing number of market players are dedicating resources to research and development in order to harness cutting-edge technologies and meet the rising demand for customized solutions in fields like healthcare, construction, and more. Considering these factors, the smart materials market is expected to grow significantly during the forecast period.
Smart Materials Market: Key Segments
Market Share by Type of Material
Based on type of material, the global smart materials market is segmented into electrochromic, electrostrictive, magnetostrictive, phase change material, piezoelectric, shape memory alloys, and smart fluids. According to our estimates, currently, the piezoelectric material segment captures the majority of the market share. This growth is primarily driven by its essential role as they are frequently utilized in sensors and actuators because of their responsiveness to mechanical stress.
Conversely, the shape memory alloys segment is expected to grow at a higher compound annual growth rate (CAGR) during the forecast period, fueled by the rising demand from the healthcare industry, where they are extensively employed in medical devices such as stents, guidewires, and orthodontic wires.
Market Share by Type of Application
Based on type of application, the global smart materials market is segmented into actuators & motors, sensors, structural materials, transducers, and others. According to our estimates, currently, the actuator application segment captures the majority of the market share. This is due to the extensive use of smart materials in actuators, which are crucial for transforming energy from one form to another and facilitating responsive and adaptive systems across different applications.
On the other hand, the sensor application segment is anticipated to grow at a higher CAGR during the forecast period. This growth can be attributed to the increasing demand in the automotive and aerospace sectors, where they are utilized in tire pressure monitoring and vibration control systems.
Market Share by Type of End User
Based on type of end user, the global smart materials market is segmented into aerospace & defense, automotive, construction, consumer electronics, healthcare, and others. According to our estimates, currently, the aerospace and defense industry captures the majority of the market share. This is due to the significant need for advanced materials that can endure harsh conditions like high temperatures, pressure variations, and mechanical stress.
On the other hand, the automotive industry is anticipated to grow at a higher CAGR during the forecast period. This is primarily due to the rising use of smart materials in actuators for seat adjustments and piezoelectric sensors in airbag systems for impact detection.
Market Share by Geographical Regions
Based on geographical regions, the smart materials market is segmented into North America, Europe, Asia, Latin America, Middle East and North Africa, and the rest of the world. According to our estimates, currently, North America captures the majority share of the market. Furthermore, the market in Asia is projected to experience a higher compound annual growth rate (CAGR) during the forecast period. This growth can be linked to the expansion of the electronic and automotive industries, coupled with a robust manufacturing base in Asian countries such as China, Taiwan, and South Korea.
Example Players in Smart Materials Market
- AMETEK
- APC International
- Arkema
- Cerametric
- CeramTech
- Channel Technologies
- Confluent Medical Technologies
- CTS
- Gentex
- Harris
- Huntsman
- Johnson Matthey
- Kyocera
- LORD
- Meggitt
- Noliac A/S
- Piezo Kinetics
- QorTek
- SAGE Electrochromics
- Solvay
- TDK
- The Lubrizol
- Wright Medical Group
Smart Materials Market: Research Coverage
The report on the smart materials market features insights on various sections, including:
- Market Sizing and Opportunity Analysis: An in-depth analysis of the smart materials market, focusing on key market segments, including [A] type of material, [B] type of application, [C] type of end user, [D] geographical regions.
- Competitive Landscape: A comprehensive analysis of the companies engaged in the smart materials market, based on several relevant parameters, such as [A] year of establishment, [B] company size, [C] location of headquarters and [D] ownership structure.
- Company Profiles: Elaborate profiles of prominent players engaged in the smart materials market, providing details on [A] location of headquarters, [B] company size, [C] company mission, [D] company footprint, [E] management team, [F] contact details, [G] financial information, [H] operating business segments, [I] smart materials portfolio, [J] moat analysis, [K] recent developments, and an informed future outlook.
- SWOT Analysis: An insightful SWOT framework, highlighting the strengths, weaknesses, opportunities and threats in the domain. Additionally, it provides Harvey ball analysis, highlighting the relative impact of each SWOT parameter.
- Value Chain Analysis: A comprehensive analysis of the value chain, providing information on the different phases and stakeholders involved in the smart materials market.
Key Questions Answered in this Report
- How many companies are currently engaged in smart materials market?
- Which are the leading companies in this market?
- What factors are likely to influence the evolution of this market?
- What is the current and future market size?
- What is the CAGR of this market?
- How is the current and future market opportunity likely to be distributed across key market segments?
Reasons to Buy this Report
- The report provides a comprehensive market analysis, offering detailed revenue projections of the overall market and its specific sub-segments. This information is valuable to both established market leaders and emerging entrants.
- Stakeholders can leverage the report to gain a deeper understanding of the competitive dynamics within the market. By analyzing the competitive landscape, businesses can make informed decisions to optimize their market positioning and develop effective go-to-market strategies.
- The report offers stakeholders a comprehensive overview of the market, including key drivers, barriers, opportunities, and challenges. This information empowers stakeholders to stay abreast of market trends and make data-driven decisions to capitalize on growth prospects.
Additional Benefits
- Complimentary Excel Data Packs for all Analytical Modules in the Report
- 15% Free Content Customization
- Detailed Report Walkthrough Session with Research Team
- Free Updated report if the report is 6-12 months old or older
TABLE OF CONTENTS
1. PREFACE
- 1.1. Introduction
- 1.2. Market Share Insights
- 1.3. Key Market Insights
- 1.4. Report Coverage
- 1.5. Key Questions Answered
- 1.6. Chapter Outlines
2. RESEARCH METHODOLOGY
- 2.1. Chapter Overview
- 2.2. Research Assumptions
- 2.3. Database Building
- 2.3.1. Data Collection
- 2.3.2. Data Validation
- 2.3.3. Data Analysis
- 2.4. Project Methodology
- 2.4.1. Secondary Research
- 2.4.1.1. Annual Reports
- 2.4.1.2. Academic Research Papers
- 2.4.1.3. Company Websites
- 2.4.1.4. Investor Presentations
- 2.4.1.5. Regulatory Filings
- 2.4.1.6. White Papers
- 2.4.1.7. Industry Publications
- 2.4.1.8. Conferences and Seminars
- 2.4.1.9. Government Portals
- 2.4.1.10. Media and Press Releases
- 2.4.1.11. Newsletters
- 2.4.1.12. Industry Databases
- 2.4.1.13. Roots Proprietary Databases
- 2.4.1.14. Paid Databases and Sources
- 2.4.1.15. Social Media Portals
- 2.4.1.16. Other Secondary Sources
- 2.4.2. Primary Research
- 2.4.2.1. Introduction
- 2.4.2.2. Types
- 2.4.2.2.1. Qualitative
- 2.4.2.2.2. Quantitative
- 2.4.2.3. Advantages
- 2.4.2.4. Techniques
- 2.4.2.4.1. Interviews
- 2.4.2.4.2. Surveys
- 2.4.2.4.3. Focus Groups
- 2.4.2.4.4. Observational Research
- 2.4.2.4.5. Social Media Interactions
- 2.4.2.5. Stakeholders
- 2.4.2.5.1. Company Executives (CXOs)
- 2.4.2.5.2. Board of Directors
- 2.4.2.5.3. Company Presidents and Vice Presidents
- 2.4.2.5.4. Key Opinion Leaders
- 2.4.2.5.5. Research and Development Heads
- 2.4.2.5.6. Technical Experts
- 2.4.2.5.7. Subject Matter Experts
- 2.4.2.5.8. Scientists
- 2.4.2.5.9. Doctors and Other Healthcare Providers
- 2.4.2.6. Ethics and Integrity
- 2.4.2.6.1. Research Ethics
- 2.4.2.6.2. Data Integrity
- 2.4.3. Analytical Tools and Databases
- 2.4.1. Secondary Research
3. ECONOMIC AND OTHER PROJECT SPECIFIC CONSIDERATIONS
- 3.1. Forecast Methodology
- 3.1.1. Top-Down Approach
- 3.1.2. Bottom-Up Approach
- 3.1.3. Hybrid Approach
- 3.2. Market Assessment Framework
- 3.2.1. Total Addressable Market (TAM)
- 3.2.2. Serviceable Addressable Market (SAM)
- 3.2.3. Serviceable Obtainable Market (SOM)
- 3.2.4. Currently Acquired Market (CAM)
- 3.3. Forecasting Tools and Techniques
- 3.3.1. Qualitative Forecasting
- 3.3.2. Correlation
- 3.3.3. Regression
- 3.3.4. Time Series Analysis
- 3.3.5. Extrapolation
- 3.3.6. Convergence
- 3.3.7. Forecast Error Analysis
- 3.3.8. Data Visualization
- 3.3.9. Scenario Planning
- 3.3.10. Sensitivity Analysis
- 3.4. Key Considerations
- 3.4.1. Demographics
- 3.4.2. Market Access
- 3.4.3. Reimbursement Scenarios
- 3.4.4. Industry Consolidation
- 3.5. Robust Quality Control
- 3.6. Key Market Segmentations
- 3.7. Limitations
4. MACRO-ECONOMIC INDICATORS
- 4.1. Chapter Overview
- 4.2. Market Dynamics
- 4.2.1. Time Period
- 4.2.1.1. Historical Trends
- 4.2.1.2. Current and Forecasted Estimates
- 4.2.1. Time Period
4.2.2. Currency Coverage
- 4.2.2.1. Overview of Major Currencies Affecting the Market
- 4.2.2.2. Impact of Currency Fluctuations on the Industry
- 4.2.3. Foreign Exchange Impact
- 4.2.3.1. Evaluation of Foreign Exchange Rates and Their Impact on Market
- 4.2.3.2. Strategies for Mitigating Foreign Exchange Risk
- 4.2.4. Recession
- 4.2.4.1. Historical Analysis of Past Recessions and Lessons Learnt
- 4.2.4.2. Assessment of Current Economic Conditions and Potential Impact on the Market
- 4.2.5. Inflation
- 4.2.5.1. Measurement and Analysis of Inflationary Pressures in the Economy
- 4.2.5.2. Potential Impact of Inflation on the Market Evolution
- 4.2.6. Interest Rates
- 4.2.6.1. Overview of Interest Rates and Their Impact on the Market
- 4.2.6.2. Strategies for Managing Interest Rate Risk
- 4.2.7. Commodity Flow Analysis
- 4.2.7.1. Type of Commodity
- 4.2.7.2. Origins and Destinations
- 4.2.7.3. Values and Weights
- 4.2.7.4. Modes of Transportation
- 4.2.8. Global Trade Dynamics
- 4.2.8.1. Import Scenario
- 4.2.8.2. Export Scenario
- 4.2.9. War Impact Analysis
- 4.2.9.1. Russian-Ukraine War
- 4.2.9.2. Israel-Hamas War
- 4.2.10. COVID Impact / Related Factors
- 4.2.10.1. Global Economic Impact
- 4.2.10.2. Industry-specific Impact
- 4.2.10.3. Government Response and Stimulus Measures
- 4.2.10.4. Future Outlook and Adaptation Strategies
- 4.2.11. Other Indicators
- 4.2.11.1. Fiscal Policy
- 4.2.11.2. Consumer Spending
- 4.2.11.3. Gross Domestic Product (GDP)
- 4.2.11.4. Employment
- 4.2.11.5. Taxes
- 4.2.11.6. R&D Innovation
- 4.2.11.7. Stock Market Performance
- 4.2.11.8. Supply Chain
- 4.2.11.9. Cross-Border Dynamics
5. EXECUTIVE SUMMARY
6. INTRODUCTION
- 6.1. Chapter Overview
- 6.2. Overview of Smart Materials Market
- 6.2.1. Type of Material
- 6.2.2. Type of Application
- 6.2.3. Type of End User
- 6.3. Future Perspective
7. COMPETITIVE LANDSCAPE
- 7.1. Chapter Overview
- 7.2. Smart Material: Overall Market Landscape
- 7.2.1. Analysis by Year of Establishment
- 7.2.2. Analysis by Company Size
- 7.2.3. Analysis by Location of Headquarters
- 7.2.4. Analysis by Ownership Structure
8. COMPANY PROFILES
- 8.1. Chapter Overview
- 8.2. AMETEK*
- 8.2.1. Company Overview
- 8.2.2. Company Mission
- 8.2.3. Company Footprint
- 8.2.4. Management Team
- 8.2.5. Contact Details
- 8.2.6. Financial Performance
- 8.2.7. Operating Business Segments
- 8.2.8. Service / Product Portfolio (project specific)
- 8.2.9. MOAT Analysis
- 8.2.10. Recent Developments and Future Outlook
- 8.3. APC International
- 8.4. Arkema
- 8.5. Cerametric
- 8.6. CeramTech
- 8.7. Channel Technologies
- 8.8. Confluent Medical Technologies
- 8.9. CTS
- 8.10. Gentex
- 8.11. Harris
- 8.12. Huntsman
- 8.13. Johnson Matthey
- 8.14. Kyocera
- 8.15. LORD
- 8.16. Noliac A/S
- 8.17. Piezo Kinetics
- 8.18. QorTek
- 8.19. SAGE Electrochromics
- 8.20. Solvay
- 8.21. TDK
- 8.22. The Lubrizol
- 8.23. Wright Medical Group
9. VALUE CHAIN ANALYSIS
10. SWOT ANALYSIS
11. GLOBAL SMART MATERIALS MARKET
- 11.1. Chapter Overview
- 11.2. Key Assumptions and Methodology
- 11.3. Trends Disruption Impacting Market
- 11.4. Global Smart Materials Market, Historical Trends (Since 2019) and Forecasted Estimates (Till 2035)
- 11.5. Multivariate Scenario Analysis
- 11.5.1. Conservative Scenario
- 11.5.2. Optimistic Scenario
- 11.6. Key Market Segmentations
12. MARKET OPPORTUNITIES BASED ON TYPE OF MATERIAL
- 12.1. Chapter Overview
- 12.2. Key Assumptions and Methodology
- 12.3. Revenue Shift Analysis
- 12.4. Market Movement Analysis
- 12.5. Penetration-Growth (P-G) Matrix
- 12.6. Smart Materials Market for Electrochromic: Historical Trends (Since 2019) and Forecasted Estimates (Till 2035)
- 12.7. Smart Materials Market for Electrostrictive: Historical Trends (Since 2019) and Forecasted Estimates (Till 2035)
- 12.8. Smart Materials Market for Magnetostrictive: Historical Trends (Since 2019) and Forecasted Estimates (Till 2035)
- 12.9. Smart Materials Market for Phase Change Material: Historical Trends (Since 2019) and Forecasted Estimates (Till 2035)
- 12.10. Smart Materials Market for Piezoelectric: Historical Trends (Since 2019) and Forecasted Estimates (Till 2035)
- 12.11. Smart Materials Market for Shape Memory Alloys: Historical Trends (Since 2019) and Forecasted Estimates (Till 2035)
- 12.12. Smart Materials Market for Smart Fluids: Historical Trends (Since 2019) and Forecasted Estimates (Till 2035)
- 12.13. Data Triangulation and Validation
13. MARKET OPPORTUNITIES BASED ON TYPE OF APPLICATION
- 13.1. Chapter Overview
- 13.2. Key Assumptions and Methodology
- 13.3. Revenue Shift Analysis
- 13.4. Market Movement Analysis
- 13.5. Penetration-Growth (P-G) Matrix
- 13.6. Smart Materials Market for Actuators & Motor: Historical Trends (Since 2019) and Forecasted Estimates (Till 2035)
- 13.7. Smart Materials Market for Sensors: Historical Trends (Since 2019) and Forecasted Estimates (Till 2035)
- 13.8. Smart Materials Market for Structural Materials: Historical Trends (Since 2019) and Forecasted Estimates (Till 2035)
- 13.9. Smart Materials Market for Transducers: Historical Trends (Since 2019) and Forecasted Estimates (Till 2035)
- 13.10. Smart Materials Market for Others: Historical Trends (Since 2019) and Forecasted Estimates (Till 2035)
- 13.11. Data Triangulation and Validation
14. MARKET OPPORTUNITIES BASED ON TYPE OF END USER
- 14.1. Chapter Overview
- 14.2. Key Assumptions and Methodology
- 14.3. Revenue Shift Analysis
- 14.4. Market Movement Analysis
- 14.5. Penetration-Growth (P-G) Matrix
- 14.6. Smart Materials Market for Aerospace & Defence: Historical Trends (Since 2019) and Forecasted Estimates (Till 2035)
- 14.7. Smart Materials Market for Automotive: Historical Trends (Since 2019) and Forecasted Estimates (Till 2035)
- 14.8. Smart Materials Market for Construction: Historical Trends (Since 2019) and Forecasted Estimates (Till 2035)
- 14.9. Smart Materials Market for Consumer Electronics: Historical Trends (Since 2019) and Forecasted Estimates (Till 2035)
- 14.10. Smart Materials Market for Healthcare: Historical Trends (Since 2019) and Forecasted Estimates (Till 2035)
- 14.11. Smart Materials Market for Others: Historical Trends (Since 2019) and Forecasted Estimates (Till 2035)
- 14.12. Data Triangulation and Validation
15. MARKET OPPORTUNITIES FOR SMART MATERIALS IN NORTH AMERICA
- 15.1. Chapter Overview
- 15.2. Key Assumptions and Methodology
- 15.3. Revenue Shift Analysis
- 15.4. Market Movement Analysis
- 15.5. Penetration-Growth (P-G) Matrix
- 15.6. Smart Materials Market in North America: Historical Trends (Since 2019) and Forecasted Estimates (Till 2035)
- 15.6.1. Smart Materials Market in the US: Historical Trends (Since 2019) and Forecasted Estimates (Till 2035)
- 15.6.2. Smart Materials Market in Canada: Historical Trends (Since 2019) and Forecasted Estimates (Till 2035)
- 15.6.3. Smart Materials Market in Mexico: Historical Trends (Since 2019) and Forecasted Estimates (Till 2035)
- 15.6.4. Smart Materials Market in Other North American Countries: Historical Trends (Since 2019) and Forecasted Estimates (Till 2035)
- 15.7. Data Triangulation and Validation
16. MARKET OPPORTUNITIES FOR SMART MATERIALS IN EUROPE
- 16.1. Chapter Overview
- 16.2. Key Assumptions and Methodology
- 16.3. Revenue Shift Analysis
- 16.4. Market Movement Analysis
- 16.5. Penetration-Growth (P-G) Matrix
- 16.6. Smart Materials Market in Europe: Historical Trends (Since 2019) and Forecasted Estimates (Till 2035)
- 16.6.1. Smart Materials Market in Austria: Historical Trends (Since 2019) and Forecasted Estimates (Till 2035)
- 16.6.2. Smart Materials Market in Belgium: Historical Trends (Since 2019) and Forecasted Estimates (Till 2035)
- 16.6.3. Smart Materials Market in Denmark: Historical Trends (Since 2019) and Forecasted Estimates (Till 2035)
- 16.6.4. Smart Materials Market in France: Historical Trends (Since 2019) and Forecasted Estimates (Till 2035)
- 16.6.5. Smart Materials Market in Germany: Historical Trends (Since 2019) and Forecasted Estimates (Till 2035)
- 16.6.6. Smart Materials Market in Ireland: Historical Trends (Since 2019) and Forecasted Estimates (Till 2035)
- 16.6.7. Smart Materials Market in Italy: Historical Trends (Since 2019) and Forecasted Estimates (Till 2035)
- 16.6.8. Smart Materials Market in Netherlands: Historical Trends (Since 2019) and Forecasted Estimates (Till 2035)
- 16.6.9. Smart Materials Market in Norway: Historical Trends (Since 2019) and Forecasted Estimates (Till 2035)
- 16.6.10. Smart Materials Market in Russia: Historical Trends (Since 2019) and Forecasted Estimates (Till 2035)
- 16.6.11. Smart Materials Market in Spain: Historical Trends (Since 2019) and Forecasted Estimates (Till 2035)
- 16.6.12. Smart Materials Market in Sweden: Historical Trends (Since 2019) and Forecasted Estimates (Till 2035)
- 16.6.13. Smart Materials Market in Switzerland: Historical Trends (Since 2019) and Forecasted Estimates (Till 2035)
- 16.6.14. Smart Materials Market in the UK: Historical Trends (Since 2019) and Forecasted Estimates (Till 2035)
- 16.6.15. Smart Materials Marketing Other European Countries: Historical Trends (Since 2019) and Forecasted Estimates (Till 2035)
- 16.7. Data Triangulation and Validation
17. MARKET OPPORTUNITIES FOR SMART MATERIALS IN ASIA
- 17.1. Chapter Overview
- 17.2. Key Assumptions and Methodology
- 17.3. Revenue Shift Analysis
- 17.4. Market Movement Analysis
- 17.5. Penetration-Growth (P-G) Matrix
- 17.6. Smart Materials Market in Asia: Historical Trends (Since 2019) and Forecasted Estimates (Till 2035)
- 17.6.1. Smart Materials Market in China: Historical Trends (Since 2019) and Forecasted Estimates (Till 2035)
- 17.6.2. Smart Materials Market in India: Historical Trends (Since 2019) and Forecasted Estimates (Till 2035)
- 17.6.3. Smart Materials Market in Japan: Historical Trends (Since 2019) and Forecasted Estimates (Till 2035)
- 17.6.4. Smart Materials Market in Singapore: Historical Trends (Since 2019) and Forecasted Estimates (Till 2035)
- 17.6.5. Smart Materials Market in South Korea: Historical Trends (Since 2019) and Forecasted Estimates (Till 2035)
- 17.6.6. Smart Materials Market in Other Asian Countries: Historical Trends (Since 2019) and Forecasted Estimates (Till 2035)
- 17.7. Data Triangulation and Validation
18. MARKET OPPORTUNITIES FOR SMART MATERIALS IN MIDDLE EAST AND NORTH AFRICA (MENA)
- 18.1. Chapter Overview
- 18.2. Key Assumptions and Methodology
- 18.3. Revenue Shift Analysis
- 18.4. Market Movement Analysis
- 18.5. Penetration-Growth (P-G) Matrix
- 18.6. Smart Materials Market in Middle East and North Africa (MENA): Historical Trends (Since 2019) and Forecasted Estimates (Till 2035)
- 18.6.1. Smart Materials Market in Egypt: Historical Trends (Since 2019) and Forecasted Estimates (Till 205)
- 18.6.2. Smart Materials Market in Iran: Historical Trends (Since 2019) and Forecasted Estimates (Till 2035)
- 18.6.3. Smart Materials Market in Iraq: Historical Trends (Since 2019) and Forecasted Estimates (Till 2035)
- 18.6.4. Smart Materials Market in Israel: Historical Trends (Since 2019) and Forecasted Estimates (Till 2035)
- 18.6.5. Smart Materials Market in Kuwait: Historical Trends (Since 2019) and Forecasted Estimates (Till 2035)
- 18.6.6. Smart Materials Market in Saudi Arabia: Historical Trends (Since 2019) and Forecasted Estimates (Till 2035)
- 18.6.7. Smart Materials Market in United Arab Emirates (UAE): Historical Trends (Since 2019) and Forecasted Estimates (Till 2035)
- 18.6.8. Smart Materials Market in Other MENA Countries: Historical Trends (Since 2019) and Forecasted Estimates (Till 2035)
- 18.7. Data Triangulation and Validation
19. MARKET OPPORTUNITIES FOR SMART MATERIALS IN LATIN AMERICA
- 19.1. Chapter Overview
- 19.2. Key Assumptions and Methodology
- 19.3. Revenue Shift Analysis
- 19.4. Market Movement Analysis
- 19.5. Penetration-Growth (P-G) Matrix
- 19.6. Smart Materials Market in Latin America: Historical Trends (Since 2019) and Forecasted Estimates (Till 2035)
- 19.6.1. Smart Materials Market in Argentina: Historical Trends (Since 2019) and Forecasted Estimates (Till 2035)
- 19.6.2. Smart Materials Market in Brazil: Historical Trends (Since 2019) and Forecasted Estimates (Till 2035)
- 19.6.3. Smart Materials Market in Chile: Historical Trends (Since 2019) and Forecasted Estimates (Till 2035)
- 19.6.4. Smart Materials Market in Colombia Historical Trends (Since 2019) and Forecasted Estimates (Till 2035)
- 19.6.5. Smart Materials Market in Venezuela: Historical Trends (Since 2019) and Forecasted Estimates (Till 2035)
- 19.6.6. Smart Materials Market in Other Latin American Countries: Historical Trends (Since 2019) and Forecasted Estimates (Till 2035)
- 19.7. Data Triangulation and Validation
20. MARKET OPPORTUNITIES FOR SMART MATERIALS IN REST OF THE WORLD
- 20.1. Chapter Overview
- 20.2. Key Assumptions and Methodology
- 20.3. Revenue Shift Analysis
- 20.4. Market Movement Analysis
- 20.5. Penetration-Growth (P-G) Matrix
- 20.6. Smart Materials Market in Rest of the World: Historical Trends (Since 2019) and Forecasted Estimates (Till 2035)
- 20.6.1. Smart Materials Market in Australia: Historical Trends (Since 2019) and Forecasted Estimates (Till 2035)
- 20.6.2. Smart Materials Market in New Zealand: Historical Trends (Since 2019) and Forecasted Estimates (Till 2035)
- 20.6.3. Smart Materials Market in Other Countries
- 20.7. Data Triangulation and Validation
21. TABULATED DATA
22. LIST OF COMPANIES AND ORGANIZATIONS
23. CUSTOMIZATION OPPORTUNITIES
24. ROOTS SUBSCRIPTION SERVICES
25. AUTHOR DETAIL
 磁致伸缩材料市场预测至2032年:按材料类型、产品形式、应用、最终用户和地区分類的全球分析
 智慧建筑材料市场规模、份额和趋势分析报告:按产品、最终用途、地区和细分市场预测(2025-2033 年)
 智慧材料市场机会、成长驱动因素、产业趋势分析及预测(2025-2034年)
 电致变阻材料市场:依材料类型、应用、终端用户产业、国家及地区划分 - 全球产业分析、市场规模、市场份额及2025-2032年预测
 智慧材料市场:2025-2032 年按材料类型和应用分類的全球预测2032 年智慧响应材料市场预测:按类型、刺激类型、形状、应用和地区进行的全球分析2032 年智慧材料市场预测:按类型、应用、最终用户和地区进行的全球分析
 智慧材料市场 - 预测 2025-2030磁致伸缩材料市场机会、成长动力、产业趋势分析及 2025 - 2034 年预测
 2025年智慧材料全球市场报告