


 |
市场调查报告书
商品编码
2015374
全球神经型态晶片市场(至2040年):产业趋势与预测Neuromorphic Chip Market, Till 2040: Industry Trends and Global Forecasts |
||||||
神经型态晶片市场展望
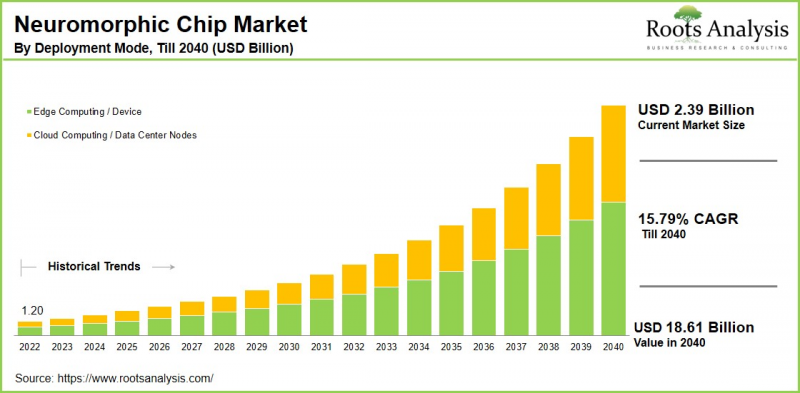
预计到 2040 年,全球神经型态晶片市场规模将达到 186.1 亿美元,高于目前的 23.9 亿美元,到 2040 年复合年增长率将达到 15.79%。
神经型态晶片是一种新型的先进处理器,旨在模拟人脑的结构和功能,为计算带来革命性的方法。与受冯·诺依曼瓶颈限制的传统架构不同,神经型态系统将运算和储存整合到人工神经元和突触中,从而实现高度并行化的事件驱动处理。
与传统GPU和CPU相比,这种架构创新显着降低了功耗,从而大幅提升了能源效率。全球人工智慧能源需求的激增进一步加速了这一发展趋势,迫切需要高性能推理解决方案,同时又不影响电网的稳定性。随着低功耗智慧运算在管理动态现实世界环境以及与边缘人工智慧框架无缝整合方面的重要性日益凸显,神经型态晶片市场在可预见的未来有望继续保持成长势头。
为高阶主管提供策略见解
神经型态晶片市场的主要成长驱动因素
神经型态晶片市场的主要驱动力是各行各业对节能高效、高效能人工智慧处理能力的激增需求。智慧摄影机和物联网感测器等边缘应用对即时设备端智慧的需求日益增长,加速了神经形态晶片的普及。神经型态架构无需依赖云端基础设施即可实现类脑低延迟运算。国防和机器人领域的持续投入进一步推动了市场成长,各国政府正投资于用于在动态环境中运作的自主无人机和机器人平台的自适应智慧系统。此外,资料中心能耗的不断增加促使企业寻求比传统处理器更节能的替代方案,而神经型态晶片被视为一种能够显着降低大规模的理想解决方案。神经科学研究的进步也提升了晶片设计能力,加速了更先进认知系统的商业化进程。自动驾驶汽车的快速普及也推动了市场发展,神经型态处理器能够提升感知能力、感测器融合能力和即时决策能力,从而实现更安全的驾驶。
神经型态晶片市场:产业内各公司的竞争格局
神经型态晶片市场竞争异常激烈,既有老牌跨国公司,也有新兴的专业技术公司参与其中。每家公司都在积极利用技术创新、策略性资金筹措、投资和合作伙伴关係来强化产品系列併扩大市场影响。例如,近年来,英特尔推出了Hala Point,这是目前全球最大的神经型态系统,部署在桑迪亚国家实验室,由其Loihi 2处理器驱动。与前代产品Pohoiki Springs相比,该系统的神经元容量提升了约10倍,效能提升了约12倍,并正在推动受大脑启发的永续人工智慧研究。
同样,IBM也在推进其双神经形态策略,旗下TrueNorth专为超低功耗的神经型态处理而设计,而NorthPole则旨在显着提升速度和能效,远超传统GPU,并大幅加速大型语言模型的推理。这项策略得到了DARPA资助的研究支持,目标是在2026年实现5nm製程的商业化流片。
本报告对全球神经型态晶片市场进行了分析,提供了市场规模估算、机会分析、竞争格局和公司简介等资讯。
目录
第一章:计划概述
第二章:调查方法
第三章 市场动态
第四章 宏观经济指标
第五章执行摘要
第六章:引言
第七章 监管情景
第八章:主要企业综合资料库
第九章 竞争情势
第十章:閒置频段分析
第十一章:企业竞争力分析
第十二章:Start-Ups生态系分析
第十三章:公司简介
- 章节概要
- Applied Brain Research
- BrainChip Holdings
- CEA-Leti
- Cerebras Systems
- Ceryx Medical
- General Vision
- Gyrfalcon Technology
- Hewlett Packard Labs(HPE)
- HRL Laboratories
- IBM
- Innatera Nanosystems
- Intel
- Knowm
- Koniku
- Lockheed Martin
- MemComputing
- Micron Technology
- Nepes
- Numenta
- NVIDIA
- Qualcomm
- Samsung Electronics
- SK Hynix
第十四章:分析大趋势
第十五章:未满足需求的分析
第十六章:专利分析
第十七章 最新进展
第十八章:全球神经型态晶片市场
第十九章 市场机会:依组件划分
第20章 市场机会:依神经型态晶片类型划分
第21章 市场机会:依建筑类型划分
第22章 市场机会:依部署方式划分
第23章 市场机会:依可塑性机制类型划分
第24章 市场机会:依整合类型划分
第25章 市场机会:依单域架构类型划分
第26章 市场机会:依应用领域划分
第27章 市场机会:依最终用途产业划分
第28章 北美神经型态晶片的市场机会
第29章 欧洲神经型态晶片的市场机会
第30章:亚太地区神经型态晶片的市场机会
第31章 拉丁美洲神经型态晶片的市场机会
第32章 中东和非洲神经型态晶片的市场机会
第33章 市场集中度分析:依主要企业划分
第34章 邻近市场分析
第35章:关键成功策略
第36章:波特五力分析
第37章 SWOT分析
第38章:价值链分析
第39章:鲁茨的战略建议
第40章:来自初步调查的见解
第四十一章:报告结论
第42章:表格形式数据
第43章 公司与组织列表
Neuromorphic Chip Market Outlook
As per Roots Analysis, the global neuromorphic chip market size is estimated to grow from USD 2.39 billion in current year to USD 18.61 billion by 2040, at a CAGR of 15.79% during the forecast period, till 2040.
Neuromorphic chips are an emerging class of advanced processors designed to emulate the structure and functioning of the human brain, offering a transformative approach to computing. Unlike conventional architectures constrained by the von Neumann bottleneck, neuromorphic systems integrate computation and memory within artificial neurons and synapses, enabling highly parallel, event-driven processing.
This architectural innovation significantly reduces power consumption compared to traditional GPUs and CPUs, delivering orders-of-magnitude improvements in energy efficiency. This evolution has been further accelerated by the sharp rise in global AI energy demand, which has created an urgent requirement for high-performance inference solutions that do not compromise power grid stability. With increasing emphasis on low-power intelligent computing and seamless integration with edge AI frameworks to manage dynamic, real-world environments, the neuromorphic chip market continues to gain momentum throughout the foreseeable future.
Strategic Insights for Senior Leaders
Key Drivers Propelling Growth of Neuromorphic Chip Market
The neuromorphic chip market is primarily driven by the surging demand for energy-efficient and high-performance AI processing across industries. The growing need for real-time, on-device intelligence in edge applications (such as smart cameras and IoT sensors), is accelerating adoption, as neuromorphic architectures enable low-latency, brain-inspired computing without reliance on cloud infrastructure. Expanding defense and robotics initiatives are further supporting market growth, with governments investing in adaptive intelligence systems for autonomous drones and robotic platforms operating in dynamic environments. Additionally, rising energy consumption in data centers is prompting enterprises to seek power-efficient alternatives to conventional processors, positioning neuromorphic chips as a viable solution for large-scale cost savings. Additionally, advances in neuroscience research are also strengthening chip design capabilities, facilitating the commercialization of more sophisticated cognitive systems. Moreover, the rapid expansion of autonomous vehicles is contributing to market momentum, as neuromorphic processors enhance perception, sensor fusion, and real-time decision-making for safer navigation.
Neuromorphic Chip Market: Competitive Landscape of Companies in this Industry
The neuromorphic chip market is characterized by intense competition, marked by the presence of both established multinational corporations and emerging specialized technology firms. Companies are actively leveraging technological innovation, strategic funding, investments, and collaborative partnerships to strengthen their product portfolios and expand market presence. For instance, recently, Intel introduced Hala Point, the world's largest neuromorphic system powered by Loihi 2 processors and deployed at Sandia National Laboratories. This is delivering nearly ten times greater neuron capacity and twelve times higher performance than its predecessor, Pohoiki Springs, to advance sustainable brain-inspired AI research.
Similarly, IBM is advancing a dual neuromorphic strategy through TrueNorth, which is designed for ultra-low-power sensory processing, and NorthPole, which is engineered to significantly accelerate large language model inference with substantial improvements in speed and energy efficiency over conventional GPUs. This initiative is supported by DARPA-backed research and is targeting a commercial-scale 5nm tape-out by 2026.
Key Technological Advancements and Emerging Trends in the Industry
The neuromorphic chip market is witnessing several transformative trends driven by advancements in connectivity, healthcare innovation, next-generation computing, and global manufacturing expansion. The rapid rollout of 5G networks is accelerating Edge AI deployment, enabling neuromorphic processors to power smart city infrastructure (such as traffic monitoring systems and connected wearables), thereby capturing opportunities within the rapidly expanding edge computing ecosystem.
Simultaneously, the development of neuro-inspired microcontrollers is supporting biometric monitoring in wearable devices, creating new avenues for personalized healthcare solutions, particularly for aging populations. Emerging research into quantum-hybrid architectures is gaining significant attention. Integrating neuromorphic systems with quantum computing platforms has the potential to solve highly complex simulations in areas such as drug discovery, thereby attracting pharmaceutical companies seeking to accelerate research and development timelines.
Regional Analysis of Neuromorphic Chip Market
In the evolving neuromorphic chip market, Europe holds a significant market share, largely driven by strong adoption across the industrial and automotive sectors. Regional growth is supported by stringent Vision Zero autonomous vehicle initiatives and the accelerating implementation of Industry 4.0 strategies. Meanwhile, the Middle East and Africa account for 10.70% of the market, positioning themselves as a strategic infrastructure-driven growth region. This expansion is underpinned by large-scale smart city developments, including Saudi Arabia's NEOM and major urban transformation initiatives in the UAE, where neuromorphic chips are deployed for grid optimization, intelligent surveillance, and sustainability-focused infrastructure management. In contrast, Latin America currently represents a smaller share but is projected to expand at a robust CAGR, emerging as a growing data and innovation hub.
Key Challenges in Neuromorphic Chip Market
The neuromorphic chip market faces several structural and technological challenges that may constrain its growth trajectory. High research and development costs associated with designing brain-inspired architectures limit broader participation. This enables only well-capitalized corporations to compete effectively while smaller firms struggle with commercialization and scalability. Additionally, existing semiconductor fabrication infrastructure remains inadequately optimized for neuromorphic designs, resulting in low production yields and operational inefficiencies that delay large-scale deployment. The market is further hindered by a limited software ecosystem, as the shortage of developers skilled in programming spiking neural networks restricts application development and slows adoption in comparison to established GPU-supported AI frameworks.
Neuromorphic Chip Market: Key Market Segmentation
Market Share by Component
- Hardware
- Processors
- Memory
- Sensors
- Software
- Development Frameworks & SDKs
- Mapping & Simulation Tools
- Algorithms & Libraries
- Services
- Consulting & Integration
- Support & Maintenance
Market Share by Type of Neuromorphic Chip
- Analog Neuromorphic Chips
- Digital Neuromorphic Chips
- Mixed-Signal Neuromorphic Chips
Market Share by Type of Architecture
- ASIC-based Neuromorphic Chips
- Deep Neural Networks (DNN) Accelerators
- FPGA-based Neuromorphic Chips
- Memristor-based Chips
- Spiking Neural Networks (SNN)
Market Share by Deployment Mode
- Edge Computing / Devices
- Cloud Computing / Data Center Nodes
Market Share by Type of Plasticity Mechanism
- Inference-Only Chips
- On-Chip Learning / Adaptive Chips
Market Share by Type of Integration
- Embedded Neuromorphic IP Cores
- Neuromorphic Sensing Units
- Standalone Neuromorphic Accelerators
Market Share by Type of Single Domain Architecture
- Hybrid Mixed-Signal
- Pure Digital (SNN)
- Sub-Threshold Analog
Market Share by Application Area
- Audio & Signal Processing
- Cybersecurity & Pattern Recognition
- Data Mining & Analytics
- Edge AI and IoT Devices
- Healthcare & Wearable
- Image & Video Processing
- Natural Language Processing (NLP)
- Object Detection & Recognition
- Sensor Fusion
Market Share by End Use Industry
- Automotive
- Aerospace & Defense
- Consumer Electronics
- Healthcare
- Industrial Automation
- IT & Telecommunications
Market Share by Geographical Regions
- North America
- US
- Canada
- Mexico
- Rest of North America
- Europe
- Austria
- Belgium
- Denmark
- France
- Germany
- Ireland
- Italy
- Netherlands
- Norway
- Russia
- Spain
- Sweden
- Switzerland
- UK
- Rest of Europe
- Asia-Pacific
- Australia
- China
- India
- Japan
- New-Zealand
- Singapore
- South Korea
- Rest of Asia-Pacific
- Latin America
- Brazil
- Chile
- Colombia
- Venezuela
- Rest of Latin America
- Middle East and Africa (MEA)
- Egypt
- Iran
- Iraq
- Israel
- Kuwait
- Saudi Arabia
- UAE
- Rest of MEA
Example Players in Neuromorphic Chip Market
- Applied Brain Research
- BrainChip Holdings
- CEA-Leti
- Cerebras Systems
- Ceryx Medical
- General Vision
- Gyrfalcon Technology
- Hewlett Packard Labs (HPE)
- HRL Laboratories
- IBM
- Innatera Nanosystems
- Intel
- Knowm
- Koniku
- Lockheed Martin
- MemComputing
- Micron Technology
- Nepes
- Numenta
- NVIDIA
- Qualcomm
- Samsung Electronics
- SK Hynix
neuromorphic Chip Market: Report Coverage
The report on the neuromorphic chip market features insights on various sections, including:
- Market Sizing and Opportunity Analysis: An in-depth analysis of the neuromorphic chip market, focusing on key market segments, including [A] component, [B] type of neuromorphic chip, [C] type of architecture, [D] type of plasticity mechanism, [E] type of integration, [F] type of single domain architecture, [G] deployment mode, [H] application area, [I] end use industry, [J] geographical regions, and [K] leading players.
- Competitive Landscape: A comprehensive analysis of the companies engaged in the neuromorphic chip market, based on several relevant parameters, such as [A] year of establishment, [B] company size, [C] location of headquarters and [D] ownership structure.
- Company Profiles: Elaborate profiles of prominent players engaged in the neuromorphic chip market, providing details on [A] location of headquarters, [B] company size, [C] company mission, [D] company footprint, [E] management team, [F] contact details, [G] financial information, [H] operating business segments, [I] product / technology portfolio, [J] recent developments, and an informed future outlook.
- Megatrends: An evaluation of ongoing megatrends in the neuromorphic chip industry.
- Patent Analysis: An insightful analysis of patents filed / granted in the neuromorphic chip domain, based on relevant parameters, including [A] type of patent, [B] patent publication year, [C] patent age and [D] leading players.
- Recent Developments: An overview of the recent developments made in the neuromorphic chip market, along with analysis based on relevant parameters, including [A] year of initiative, [B] type of initiative, [C] geographical distribution and [D] most active players.
- Porter's Five Forces Analysis: An analysis of five competitive forces prevailing in the neuromorphic chip market, including threats of new entrants, bargaining power of buyers, bargaining power of suppliers, threats of substitute products and rivalry among existing competitors.
- SWOT Analysis: An insightful SWOT framework, highlighting the strengths, weaknesses, opportunities and threats in the domain. Additionally, it provides Harvey ball analysis, highlighting the relative impact of each SWOT parameter.
Key Questions Answered in this Report
- What is the current and future market size?
- Who are the leading companies in this market?
- What are the growth drivers that are likely to influence the evolution of this market?
- What are the key partnership and funding trends shaping this industry?
- Which region is likely to grow at higher CAGR till 2040?
- How is the current and future market opportunity likely to be distributed across key market segments?
Reasons to Buy this Report
- Detailed Market Analysis: The report provides a comprehensive market analysis, offering detailed revenue projections of the overall market and its specific sub-segments. This information is valuable to both established market leaders and emerging entrants.
- In-depth Analysis of Trends: Stakeholders can leverage the report to gain a deeper understanding of the competitive dynamics within the market. Each report maps ecosystem activity across partnerships, funding, and patent landscapes to reveal growth hotspots and white spaces in the industry.
- Opinion of Industry Experts: The report features extensive interviews and surveys with key opinion leaders and industry experts to validate market trends mentioned in the report.
- Decision-ready Deliverables: The report offers stakeholders with strategic frameworks (Porter's Five Forces, value chain, SWOT), and complimentary Excel / slide packs with customization support.
Additional Benefits
- Complimentary Dynamic Excel Dashboards for Analytical Modules
- Exclusive 15% Free Content Customization
- Personalized Interactive Report Walkthrough with Our Expert Research Team
- Free Report Updates for Versions Older than 6-12 Months
TABLE OF CONTENTS
1. PROJECT OVERVIEW
- 1.1. Context
- 1.2. Project Objectives
2. RESEARCH METHODOLOGY
- 2.1. Chapter Overview
- 2.2. Research Assumptions
- 2.3. Database Building
- 2.3.1. Data Collection
- 2.3.2. Data Validation
- 2.3.3. Data Analysis
- 2.4. Project Methodology
- 2.4.1. Secondary Research
- 2.4.1.1. Annual Reports
- 2.4.1.2. Academic Research Papers
- 2.4.1.3. Company Websites
- 2.4.1.4. Investor Presentations
- 2.4.1.5. Regulatory Filings
- 2.4.1.6. White Papers
- 2.4.1.7. Industry Publications
- 2.4.1.8. Conferences and Seminars
- 2.4.1.9. Government Portals
- 2.4.1.10. Media and Press Releases
- 2.4.1.11. Newsletters
- 2.4.1.12. Industry Databases
- 2.4.1.13. Roots Proprietary Databases
- 2.4.1.14. Paid Databases and Sources
- 2.4.1.15. Social Media Portals
- 2.4.1.16. Other Secondary Sources
- 2.4.2. Primary Research
- 2.4.2.1. Introduction
- 2.4.2.2. Types
- 2.4.2.2.1. Qualitative
- 2.4.2.2.2. Quantitative
- 2.4.2.3. Advantages
- 2.4.2.4. Techniques
- 2.4.2.4.1. Interviews
- 2.4.2.4.2. Surveys
- 2.4.2.4.3. Focus Groups
- 2.4.2.4.4. Observational Research
- 2.4.2.4.5. Social Media Interactions
- 2.4.2.5. Stakeholders
- 2.4.2.5.1. Company Executives (CXOs)
- 2.4.2.5.2. Board of Directors
- 2.4.2.5.3. Company Presidents and Vice Presidents
- 2.4.2.5.4. Key Opinion Leaders
- 2.4.2.5.5. Research and Development Heads
- 2.4.2.5.6. Technical Experts
- 2.4.2.5.7. Subject Matter Experts
- 2.4.2.5.8. Scientists
- 2.4.2.5.9. Doctors and Other Healthcare Providers
- 2.4.2.6. Ethics and Integrity
- 2.4.2.6.1. Research Ethics
- 2.4.2.6.2. Data Integrity
- 2.4.3. Analytical Tools and Databases
- 2.4.1. Secondary Research
3. MARKET DYNAMICS
- 3.1. Forecast Methodology
- 3.1.1. Top-Down Approach
- 3.1.2. Bottom-Up Approach
- 3.1.3. Hybrid Approach
- 3.2. Market Assessment Framework
- 3.2.1. Total Addressable Market (TAM)
- 3.2.2. Serviceable Addressable Market (SAM)
- 3.2.3. Serviceable Obtainable Market (SOM)
- 3.2.4. Currently Acquired Market (CAM)
- 3.3. Forecasting Tools and Techniques
- 3.3.1. Qualitative Forecasting
- 3.3.2. Correlation
- 3.3.3. Regression
- 3.3.4. Time Series Analysis
- 3.3.5. Extrapolation
- 3.3.6. Convergence
- 3.3.7. Forecast Error Analysis
- 3.3.8. Data Visualization
- 3.3.9. Scenario Planning
- 3.3.10. Sensitivity Analysis
- 3.4. Key Considerations
- 3.4.1. Demographics
- 3.4.2. Market Access
- 3.4.3. Reimbursement Scenarios
- 3.4.4. Industry Consolidation
- 3.5. Robust Quality Control
- 3.6. Key Market Segmentations
- 3.7. Limitations
4. MACRO-ECONOMIC INDICATORS
- 4.1. Chapter Overview
- 4.2. Market Dynamics
- 4.2.1. Time Period
- 4.2.1.1. Historical Trends
- 4.2.1.2. Current and Forecasted Estimates
- 4.2.2. Currency Coverage
- 4.2.2.1. Overview of Major Currencies Affecting the Market
- 4.2.2.2. Impact of Currency Fluctuations on the Industry
- 4.2.3. Foreign Exchange Impact
- 4.2.3.1. Evaluation of Foreign Exchange Rates and Their Impact on Market
- 4.2.3.2. Strategies for Mitigating Foreign Exchange Risk
- 4.2.4. Recession
- 4.2.4.1. Historical Analysis of Past Recessions and Lessons Learnt
- 4.2.4.2. Assessment of Current Economic Conditions and Potential Impact on the Market
- 4.2.5. Inflation
- 4.2.5.1. Measurement and Analysis of Inflationary Pressures in the Economy
- 4.2.5.2. Potential Impact of Inflation on the Market Evolution
- 4.2.6. Interest Rates
- 4.2.6.1. Overview of Interest Rates and Their Impact on the Market
- 4.2.6.2. Strategies for Managing Interest Rate Risk
- 4.2.7. Commodity Flow Analysis
- 4.2.7.1. Type of Commodity
- 4.2.7.2. Origins and Destinations
- 4.2.7.3. Values and Weights
- 4.2.7.4. Modes of Transportation
- 4.2.8. Global Trade Dynamics
- 4.2.8.1. Import Scenario
- 4.2.8.2. Export Scenario
- 4.2.9. War Impact Analysis
- 4.2.9.1. Russian-Ukraine War
- 4.2.9.2. Israel-Hamas War
- 4.2.10. COVID Impact / Related Factors
- 4.2.10.1. Global Economic Impact
- 4.2.10.2. Industry-specific Impact
- 4.2.10.3. Government Response and Stimulus Measures
- 4.2.10.4. Future Outlook and Adaptation Strategies
- 4.2.11. Other Indicators
- 4.2.11.1. Fiscal Policy
- 4.2.11.2. Consumer Spending
- 4.2.11.3. Gross Domestic Product (GDP)
- 4.2.11.4. Employment
- 4.2.11.5. Taxes
- 4.2.11.6. R&D Innovation
- 4.2.11.7. Stock Market Performance
- 4.2.11.8. Supply Chain
- 4.2.11.9. Cross-Border Dynamics
- 4.2.1. Time Period
- 4.3. Concluding Remarks
5. EXECUTIVE SUMMARY
6. INTRODUCTION
- 6.1. Chapter Overview
- 6.2. Overview of Neuromorphic Chip Market
- 6.2.1. Type of Component
- 6.2.2. Type of Neuromorphic Chip
- 6.2.3. Type of Architecture
- 6.2.4. Type of Deployment
- 6.2.5. Type of Plasticity Mechanism
- 6.2.6. Type of Integration
- 6.2.7. Type of Single Domain Architecture
- 6.2.8. Application Area
- 6.2.9. End Use Industry
- 6.3. Future Perspective
7. REGULATORY SCENARIO
8. COMPREHENSIVE DATABASE OF LEADING PLAYERS
9. COMPETITIVE LANDSCAPE
- 9.1. Chapter Overview
- 9.2. Neuromorphic Chip Market: Overall Market Landscape
- 9.2.1. Analysis by Year of Establishment
- 9.2.2. Analysis by Company Size
- 9.2.3. Analysis by Location of Headquarters
- 9.2.4. Analysis by Type of Company
- 9.3. Key Findings
10. WHITE SPACE ANALYSIS
11. COMPANY COMPETITIVENESS ANALYSIS
12. STARTUP ECOSYSTEM ANALYSIS
- 12.1. Neuromorphic Chip Market: Startup Ecosystem Analysis
- 12.1.1. Analysis by Year of Establishment
- 12.1.2. Analysis by Company Size
- 12.1.3. Analysis by Location of Headquarters
- 12.1.4. Analysis by Ownership Type
- 12.2. Key Findings
13. COMPANY PROFILES
- 13.1. Chapter Overview
- 13.2. Applied Brain Research
- 13.2.1. Company Overview
- 13.2.2. Company Mission
- 13.2.3. Company Footprint
- 13.2.4. Management Team
- 13.2.5. Contact Details
- 13.2.6. Financial Performance
- 13.2.7. Operating Business Segments
- 13.2.8. Service / Product Portfolio (project specific)
- 13.2.9. MOAT Analysis
- 13.2.10. Recent Developments and Future Outlook
- Similar details are presented for other companies mentioned below (based on information in the public domain)
- 13.3. BrainChip Holdings
- 13.4. CEA-Leti
- 13.5. Cerebras Systems
- 13.6. Ceryx Medical
- 13.7. General Vision
- 13.8. Gyrfalcon Technology
- 13.9. Hewlett Packard Labs (HPE)
- 13.10. HRL Laboratories
- 13.11. IBM
- 13.12. Innatera Nanosystems
- 13.13. Intel
- 13.14. Knowm
- 13.15. Koniku
- 13.16. Lockheed Martin
- 13.17. MemComputing
- 13.18. Micron Technology
- 13.19. Nepes
- 13.20. Numenta
- 13.21. NVIDIA
- 13.22. Qualcomm
- 13.23. Samsung Electronics
- 13.24. SK Hynix
14. MEGA TRENDS ANALYSIS
15. UNMET NEED ANALYSIS
16. PATENT ANALYSIS
17. RECENT DEVELOPMENTS
- 17.1. Chapter Overview
- 17.2. Recent Funding
- 17.3. Recent Partnerships
- 17.4. Other Recent Initiatives
18. GLOBAL NEUROMORPHIC CHIP MARKET
- 18.1. Chapter Overview
- 18.2. Key Assumptions and Methodology
- 18.3. Trends Disruption Impacting Market
- 18.4. Demand Side Trends
- 18.5. Supply Side Trends
- 18.6. Global Neuromorphic Chip Market: Historical Trends (Since 2022) and Forecasted Estimates (Till 2040)
- 18.7. Multivariate Scenario Analysis
- 18.7.1. Conservative Scenario
- 18.7.2. Optimistic Scenario
- 18.8. Investment Feasibility Index
- 18.9. Key Market Segmentations
19. MARKET OPPORTUNITIES BASED ON COMPONENT
- 19.1. Chapter Overview
- 19.2. Key Assumptions and Methodology
- 19.3. Revenue Shift Analysis
- 19.4. Market Movement Analysis
- 19.5. Penetration-Growth (P-G) Matrix
- 19.6. Neuromorphic Chip Market for Hardware: Historical Trends (Since 2022) and Forecasted Estimates (Till 2040)
- 19.6.1. Neuromorphic Chip Hardware Market for Processors: Historical Trends (Since 2022) and Forecasted Estimates (Till 2040)
- 19.6.2. Neuromorphic Chip Hardware Market for Memory: Historical Trends (Since 2022) and Forecasted Estimates (Till 2040)
- 19.6.3. Neuromorphic Chip Hardware Market for Sensors: Historical Trends (Since 2022) and Forecasted Estimates (Till 2040)
- 19.7. Neuromorphic Chip Market for Software: Historical Trends (Since 2022) and Forecasted Estimates (Till 2040)
- 19.7.1. Neuromorphic Chip Software Market for Development Frameworks & SDKs: Historical Trends (Since 2022) and Forecasted Estimates (Till 2040)
- 19.7.2. Neuromorphic Chip Software Market for Mapping & Simulation Tools: Historical Trends (Since 2022) and Forecasted Estimates (Till 2040)
- 19.7.3. Neuromorphic Chip Software Market for Algorithms & Libraries: Historical Trends (Since 2022) and Forecasted Estimates (Till 2040)
- 19.8. Neuromorphic Chip Market for Services: Historical Trends (Since 2022) and Forecasted Estimates (Till 2040)
- 19.8.1. Neuromorphic Chip Services Market for Consulting & Integration: Historical Trends (Since 2022) and Forecasted Estimates (Till 2040)
- 19.8.2. Neuromorphic Chip Services Market for Support & Maintenance: Historical Trends (Since 2022) and Forecasted Estimates (Till 2040)
- 19.9. Data Triangulation and Validation
- 19.9.1. Secondary Sources
- 19.9.2. Primary Sources
- 19.9.3. Statistical Modeling
20. MARKET OPPORTUNITIES BASED ON TYPE OF NEUROMORPHIC CHIP
- 20.1. Chapter Overview
- 20.2. Key Assumptions and Methodology
- 20.3. Revenue Shift Analysis
- 20.4. Market Movement Analysis
- 20.5. Penetration-Growth (P-G) Matrix
- 20.6. Neuromorphic Chip Market for Analog Neuromorphic Chips: Historical Trends (Since 2022) and Forecasted Estimates (Till 2040)
- 20.7. Neuromorphic Chip Market for Digital Neuromorphic Chips: Historical Trends (Since 2022) and Forecasted Estimates (Till 2040)
- 20.8. Neuromorphic Chip Market for Mixed-Signal Neuromorphic Chips: Historical Trends (Since 2022) and Forecasted Estimates (Till 2040)
- 20.9. Data Triangulation and Validation
- 20.9.1. Secondary Sources
- 20.9.2. Primary Sources
- 20.9.3. Statistical Modeling
21. MARKET OPPORTUNITIES BASED ON TYPE OF ARCHITECTURE
- 21.1. Chapter Overview
- 21.2. Key Assumptions and Methodology
- 21.3. Revenue Shift Analysis
- 21.4. Market Movement Analysis
- 21.5. Penetration-Growth (P-G) Matrix
- 21.6. Neuromorphic Chip Market for ASIC-based Neuromorphic Chips: Historical Trends (Since 2022) and Forecasted Estimates (Till 2040)
- 21.7. Neuromorphic Chip Market for Deep Neural Networks (DNN) Accelerators: Historical Trends (Since 2022) and Forecasted Estimates (Till 2040)
- 21.8. Neuromorphic Chip Market for FPGA-based Neuromorphic Chips: Historical Trends (Since 2022) and Forecasted Estimates (Till 2040)
- 21.9. Neuromorphic Chip Market for Memristor-based Chips: Historical Trends (Since 2022) and Forecasted Estimates (Till 2040)
- 21.10. Neuromorphic Chip Market for Spiking Neural Networks (SNN): Historical Trends (Since 2022) and Forecasted Estimates (Till 2040)
- 21.11. Data Triangulation and Validation
- 21.11.1. Secondary Sources
- 21.11.2. Primary Sources
- 21.11.3. Statistical Modeling
22. MARKET OPPORTUNITIES BASED ON DEPLOYMENT MODE
- 22.1. Chapter Overview
- 22.2. Key Assumptions and Methodology
- 22.3. Revenue Shift Analysis
- 22.4. Market Movement Analysis
- 22.5. Penetration-Growth (P-G) Matrix
- 22.6. Neuromorphic Chip Market for Edge Computing / Devices: Historical Trends (Since 2022) and Forecasted Estimates (Till 2040)
- 22.7. Neuromorphic Chip Market for Cloud Computing / Data Center Nodes: Historical Trends (Since 2022) and Forecasted Estimates (Till 2040)
- 22.8. Data Triangulation and Validation
- 22.8.1. Secondary Sources
- 22.8.2. Primary Sources
- 22.8.3. Statistical Modeling
23. MARKET OPPORTUNITIES BASED ON TYPE OF PLASTICITY MECHANISM
- 23.1. Chapter Overview
- 23.2. Key Assumptions and Methodology
- 23.3. Revenue Shift Analysis
- 23.4. Market Movement Analysis
- 23.5. Penetration-Growth (P-G) Matrix
- 23.6. Neuromorphic Chip Market for Inference-Only Chips: Historical Trends (Since 2022) and Forecasted Estimates (Till 2040)
- 23.7. Neuromorphic Chip Market for On-Chip Learning / Adaptive Chips: Historical Trends (Since 2022) and Forecasted Estimates (Till 2040)
- 23.8. Data Triangulation and Validation
- 23.8.1. Secondary Sources
- 23.8.2. Primary Sources
- 23.8.3. Statistical Modeling
24. MARKET OPPORTUNITIES BASED ON TYPE OF INTEGRATION
- 24.1. Chapter Overview
- 24.2. Key Assumptions and Methodology
- 24.3. Revenue Shift Analysis
- 24.4. Market Movement Analysis
- 24.5. Penetration-Growth (P-G) Matrix
- 24.6. Neuromorphic Chip Market for Embedded Neuromorphic IP Cores: Historical Trends (Since 2022) and Forecasted Estimates (Till 2040)
- 24.7. Neuromorphic Chip Market for Neuromorphic Sensing Units: Historical Trends (Since 2022) and Forecasted Estimates (Till 2040)
- 24.8. Neuromorphic Chip Market for Standalone Neuromorphic Accelerators: Historical Trends (Since 2022) and Forecasted Estimates (Till 2040)
- 24.9. Data Triangulation and Validation
- 24.9.1. Secondary Sources
- 24.9.2. Primary Sources
- 24.9.3. Statistical Modeling
25. MARKET OPPORTUNITIES BASED ON TYPE OF SINGLE DOMAIN ARCHITECTURE
- 25.1. Chapter Overview
- 25.2. Key Assumptions and Methodology
- 25.3. Revenue Shift Analysis
- 25.4. Market Movement Analysis
- 25.5. Penetration-Growth (P-G) Matrix
- 25.6. Neuromorphic Chip Market for Hybrid Mixed-Signal: Historical Trends (Since 2022) and Forecasted Estimates (Till 2040)
- 25.7. Neuromorphic Chip Market for Pure Digital (SNN): Historical Trends (Since 2022) and Forecasted Estimates (Till 2040)
- 25.8. Neuromorphic Chip Market for Sub-Threshold Analog: Historical Trends (Since 2022) and Forecasted Estimates (Till 2040)
- 25.9. Data Triangulation and Validation
- 25.9.1. Secondary Sources
- 25.9.2. Primary Sources
- 25.9.3. Statistical Modeling
26. MARKET OPPORTUNITIES BASED ON APPLICATION AREA
- 26.1. Chapter Overview
- 26.2. Key Assumptions and Methodology
- 26.3. Revenue Shift Analysis
- 26.4. Market Movement Analysis
- 26.5. Penetration-Growth (P-G) Matrix
- 26.6. Neuromorphic Chip Market for Audio & Signal Processing: Historical Trends (Since 2022) and Forecasted Estimates (Till 2040)
- 26.7. Neuromorphic Chip Market for Cybersecurity & Pattern Recognition: Historical Trends (Since 2022) and Forecasted Estimates (Till 2040)
- 26.8. Neuromorphic Chip Market for Data Mining & Analytics: Historical Trends (Since 2022) and Forecasted Estimates (Till 2040)
- 26.9. Neuromorphic Chip Market for Edge AI and IoT Devices: Historical Trends (Since 2022) and Forecasted Estimates (Till 2040)
- 26.10. Neuromorphic Chip Market for Healthcare & Wearable: Historical Trends (Since 2022) and Forecasted Estimates (Till 2040)
- 26.11. Neuromorphic Chip Market for Image & Video Processing: Historical Trends (Since 2022) and Forecasted Estimates (Till 2040)
- 26.12. Neuromorphic Chip Market for Natural Language Processing (NLP): Historical Trends (Since 2022) and Forecasted Estimates (Till 2040)
- 26.13. Neuromorphic Chip Market for Object Detection & Recognition: Historical Trends (Since 2022) and Forecasted Estimates (Till 2040)
- 26.14. Neuromorphic Chip Market for Sensor Fusion: Historical Trends (Since 2022) and Forecasted Estimates (Till 2040)
- 26.15. Data Triangulation and Validation
- 26.15.1. Secondary Sources
- 26.15.2. Primary Sources
- 26.15.3. Statistical Modeling
27. MARKET OPPORTUNITIES BASED ON END USE INDUSTRY
- 27.1. Chapter Overview
- 27.2. Key Assumptions and Methodology
- 27.3. Revenue Shift Analysis
- 27.4. Market Movement Analysis
- 27.5. Penetration-Growth (P-G) Matrix
- 27.6. Neuromorphic Chip Market for Automotive: Historical Trends (Since 2022) and Forecasted Estimates (Till 2040)
- 27.7. Neuromorphic Chip Market for Aerospace & Defense: Historical Trends (Since 2022) and Forecasted Estimates (Till 2040)
- 27.8. Neuromorphic Chip Market for Consumer Electronics: Historical Trends (Since 2022) and Forecasted Estimates (Till 2040)
- 27.9. Neuromorphic Chip Market for Healthcare: Historical Trends (Since 2022) and Forecasted Estimates (Till 2040)
- 27.9. Neuromorphic Chip Market for Industrial Automation: Historical Trends (Since 2022) and Forecasted Estimates (Till 2040)
- 27.10. Neuromorphic Chip Market for IT & Telecommunications: Historical Trends (Since 2022) and Forecasted Estimates (Till 2040)
- 26.11. Data Triangulation and Validation
- 26.11.1. Secondary Sources
- 26.11.2. Primary Sources
- 26.11.3. Statistical Modeling
28. MARKET OPPORTUNITIES FOR NEUROMORPHIC CHIP IN NORTH AMERICA
- 28.1. Chapter Overview
- 28.2. Key Assumptions and Methodology
- 28.3. Revenue Shift Analysis
- 28.4. Market Movement Analysis
- 28.5. Penetration-Growth (P-G) Matrix
- 28.6. Neuromorphic Chip Market in North America: Historical Trends (Since 2022) and Forecasted Estimates (Till 2040)
- 28.6.1. Neuromorphic Chip Market in the US: Historical Trends (Since 2022) and Forecasted Estimates (Till 2040)
- 28.6.2. Neuromorphic Chip Market in Canada: Historical Trends (Since 2022) and Forecasted Estimates (Till 2040)
- 28.6.3. Neuromorphic Chip Market in Mexico: Historical Trends (Since 2022) and Forecasted Estimates (Till 2040)
- 28.6.4. Neuromorphic Chip Market in Other North American Countries: Historical Trends (Since 2022) and Forecasted Estimates (Till 2040)
- 28.7. Data Triangulation and Validation
29. MARKET OPPORTUNITIES FOR NEUROMORPHIC CHIP IN EUROPE
- 29.1. Chapter Overview
- 29.2. Key Assumptions and Methodology
- 29.3. Revenue Shift Analysis
- 29.4. Market Movement Analysis
- 29.5. Penetration-Growth (P-G) Matrix
- 29.6. Neuromorphic Chip Market in Europe: Historical Trends (Since 2022) and Forecasted Estimates (Till 2040)
- 29.6.1. Neuromorphic Chip Market in Austria: Historical Trends (Since 2022) and Forecasted Estimates (Till 2040)
- 29.6.2. Neuromorphic Chip Market in Belgium: Historical Trends (Since 2022) and Forecasted Estimates (Till 2040)
- 29.6.3. Neuromorphic Chip Market in Denmark: Historical Trends (Since 2022) and Forecasted Estimates (Till 2040)
- 29.6.4. Neuromorphic Chip Market in France: Historical Trends (Since 2022) and Forecasted Estimates (Till 2040)
- 29.6.5. Neuromorphic Chip Market in Germany: Historical Trends (Since 2022) and Forecasted Estimates (Till 2040)
- 29.6.6. Neuromorphic Chip Market in Ireland: Historical Trends (Since 2022) and Forecasted Estimates (Till 2040)
- 29.6.7. Neuromorphic Chip Market in Italy: Historical Trends (Since 2022) and Forecasted Estimates (Till 2040)
- 29.6.8. Neuromorphic Chip Market in the Netherlands: Historical Trends (Since 2022) and Forecasted Estimates (Till 2040)
- 29.6.9. Neuromorphic Chip Market in Norway: Historical Trends (Since 2022) and Forecasted Estimates (Till 2040)
- 29.6.10. Neuromorphic Chip Market in Russia: Historical Trends (Since 2022) and Forecasted Estimates (Till 2040)
- 29.6.11. Neuromorphic Chip Market in Spain: Historical Trends (Since 2022) and Forecasted Estimates (Till 2040)
- 29.6.12. Neuromorphic Chip Market in Sweden: Historical Trends (Since 2022) and Forecasted Estimates (Till 2040)
- 29.6.13. Neuromorphic Chip Market in Switzerland: Historical Trends (Since 2022) and Forecasted Estimates (Till 2040)
- 29.6.14. Neuromorphic Chip Market in the UK: Historical Trends (Since 2022) and Forecasted Estimates (Till 2040)
- 29.6.15. Neuromorphic Chip Market in Other European Countries: Historical Trends (Since 2022) and Forecasted Estimates (Till 2040)
- 29.7. Data Triangulation and Validation
30. MARKET OPPORTUNITIES FOR NEUROMORPHIC CHIP IN ASIA-PACIFIC
- 30.1. Chapter Overview
- 30.2. Key Assumptions and Methodology
- 30.3. Revenue Shift Analysis
- 30.4. Market Movement Analysis
- 30.5. Penetration-Growth (P-G) Matrix
- 30.6. Neuromorphic Chip Market in Asia-Pacific: Historical Trends (Since 2022) and Forecasted Estimates (Till 2040)
- 30.6.1. Neuromorphic Chip Market in China: Historical Trends (Since 2022) and Forecasted Estimates (Till 2040)
- 30.6.2. Neuromorphic Chip Market in India: Historical Trends (Since 2022) and Forecasted Estimates (Till 2040)
- 30.6.3. Neuromorphic Chip Market in Japan: Historical Trends (Since 2022) and Forecasted Estimates (Till 2040)
- 30.6.4. Neuromorphic Chip Market in Singapore: Historical Trends (Since 2022) and Forecasted Estimates (Till 2040)
- 30.6.5. Neuromorphic Chip Market in South Korea: Historical Trends (Since 2022) and Forecasted Estimates (Till 2040)
- 30.6.6. Neuromorphic Chip Market in Other Asian Countries: Historical Trends (Since 2022) and Forecasted Estimates (Till 2040)
- 30.7. Data Triangulation and Validation
31. MARKET OPPORTUNITIES FOR NEUROMORPHIC CHIP IN LATIN AMERICA
- 31.1. Chapter Overview
- 31.2. Key Assumptions and Methodology
- 31.3. Revenue Shift Analysis
- 31.4. Market Movement Analysis
- 31.5. Penetration-Growth (P-G) Matrix
- 31.6. Neuromorphic Chip Market in Latin America: Historical Trends (Since 2022) and Forecasted Estimates (Till 2040)
- 31.6.1. Neuromorphic Chip Market in Argentina: Historical Trends (Since 2022) and Forecasted Estimates (Till 2040)
- 31.6.2. Neuromorphic Chip Market in Brazil: Historical Trends (Since 2022) and Forecasted Estimates (Till 2040)
- 31.6.3. Neuromorphic Chip Market in Chile: Historical Trends (Since 2022) and Forecasted Estimates (Till 2040)
- 31.6.4. Neuromorphic Chip Market in Colombia Historical Trends (Since 2022) and Forecasted Estimates (Till 2040)
- 31.6.5. Neuromorphic Chip Market in Venezuela: Historical Trends (Since 2022) and Forecasted Estimates (Till 2040)
- 31.6.6. Neuromorphic Chip Market in Other Latin American Countries: Historical Trends (Since 2022) and Forecasted Estimates (Till 2040)
- 31.7. Data Triangulation and Validation
32. MARKET OPPORTUNITIES FOR NEUROMORPHIC CHIP IN MIDDLE EAST AND AFRICA (MEA)
- 32.1. Chapter Overview
- 32.2. Key Assumptions and Methodology
- 32.3. Revenue Shift Analysis
- 32.4. Market Movement Analysis
- 32.5. Penetration-Growth (P-G) Matrix
- 32.6. Neuromorphic Chip Market in Middle East and Africa (MEA): Historical Trends (Since 2022) and Forecasted Estimates (Till 2040)
- 32.6.1. Neuromorphic Chip Market in Egypt: Historical Trends (Since 2022) and Forecasted Estimates (Till 205)
- 32.6.2. Neuromorphic Chip Market in Iran: Historical Trends (Since 2022) and Forecasted Estimates (Till 2040)
- 32.6.3. Neuromorphic Chip Market in Iraq: Historical Trends (Since 2022) and Forecasted Estimates (Till 2040)
- 32.6.4. Neuromorphic Chip Market in Israel: Historical Trends (Since 2022) and Forecasted Estimates (Till 2040)
- 32.6.5. Neuromorphic Chip Market in Kuwait: Historical Trends (Since 2022) and Forecasted Estimates (Till 2040)
- 32.6.6. Neuromorphic Chip Market in Saudi Arabia: Historical Trends (Since 2022) and Forecasted Estimates (Till 2040)
- 32.6.7. Neuromorphic Chip Market in United Arab Emirates (UAE): Historical Trends (Since 2022) and Forecasted Estimates (Till 2040)
- 32.6.8. Neuromorphic Chip Market in Other MEA Countries: Historical Trends (Since 2022) and Forecasted Estimates (Till 2040)
- 32.7. Data Triangulation and Validation
33. MARKET CONCENTRATION ANALYSIS: DISTRIBUTION BY LEADING PLAYERS
34. ADJACENT MARKET ANALYSIS
35. KEY WINNING STRATEGIES
36. PORTER'S FIVE FORCES ANALYSIS
37. SWOT ANALYSIS
38. VALUE CHAIN ANALYSIS
39. ROOTS STRATEGIC RECOMMENDATIONS
- 39.1. Chapter Overview
- 39.2. Key Business-related Strategies
- 39.2.1. Research & Development
- 39.2.2. Product Manufacturing
- 39.2.3. Commercialization / Go-to-Market
- 39.2.4. Sales and Marketing
- 39.3. Key Operations-related Strategies
- 39.3.1. Risk Management
- 39.3.2. Workforce
- 39.3.3. Finance
- 39.3.4. Others
40. INSIGHTS FROM PRIMARY RESEARCH
41. REPORT CONCLUSION
42. TABULATED DATA
43. LIST OF COMPANIES AND ORGANIZATIONS
 全球神经形态计算与感测市场(2026-2036 年)
 神经形态半导体晶片市场分析及预测(至2035年):类型、产品、技术、组件、应用、材料类型、装置、最终用户、功能、安装模式全球神经形态晶片市场规模、份额、趋势和成长分析报告(2026-2034)
 日本神经形态晶片市场规模、份额、趋势及预测(依供应类型、应用、最终用户产业及地区划分,2026-2034年)
 2026年全球神经形态晶片市场报告神经形态晶片市场-2026-2031年预测
 神经型态晶片:市场占有率分析、产业趋势与统计、成长预测(2026-2031)
 用于自动驾驶汽车的神经形态晶片市场机会、成长驱动因素、产业趋势分析及预测(2025-2034年)
 神经形态晶片市场,按产品、应用、类型、最终用户、国家和地区 - 2025 年至 2032 年全球行业分析、市场规模、市场份额和预测拉丁美洲的神经型态晶片:市场占有率分析、行业趋势和成长预测(2025-2030)