


 |
市场调查报告书
商品编码
1414994
ITSM 市场:按配置、功能、部署型态、公司规模和最终用户:2023-2032 年全球市场机会分析和产业预测ITSM Market By Component, By Function, By Deployment Mode, By Enterprise Size, By End User : Global Opportunity Analysis and Industry Forecast, 2023-2032 |
||||||
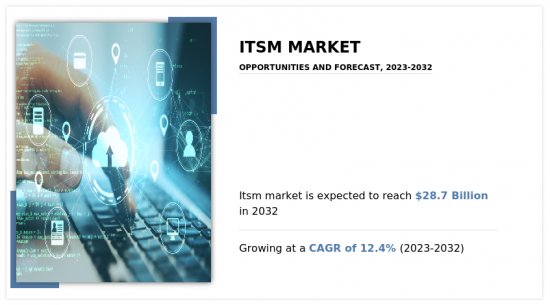
2022年ITSM市场规模为91亿美元,预计2032年将达287亿美元,2023年至2032年复合年增长率为12.4%。
IT 服务支援存取资讯和流程,以实现重要的业务目标或提供其他价值。 IT服务包括企业应用程式(例如Exchange Server)的部署和支持, IT基础设施(例如储存、网路和云端资源)的架构和最佳化,以及流程建立和最佳化(例如帮助台支援和故障排除程序),其中包括管理等。透过采用 ITSM 原则,组织可以透过提供可靠且反应迅速的 IT 服务来提高效率、降低成本并提高客户满意度。 ITSM 的持续改进方面强调随着时间的推移不断完善服务的迭代过程,使组织能够适应不断变化的业务需求和技术进步。
人工智慧 (AI) 和自动化在 IT 服务管理 (ITSM) 流程中的整合是一种日益增长的趋势,有可能改变 IT 服务的交付、管理和支援方式。人工智慧驱动的聊天机器人和虚拟助理被用来加速问题解决、增强自助服务选项并改善用户体验。另一个趋势是在 ITSM 中采用 DevOps 实践,以强调开发和营运团队之间的协作、简化服务提供并培养更敏捷和响应迅速的 IT 环境。云端基础的ITSM 解决方案也越来越受欢迎,使组织能够利用扩充性且弹性的平台进行服务管理。
目录
第一章简介
第 2 章执行摘要
第三章市场概况
- 市场定义和范围
- 主要发现
- 影响因素
- 主要投资机会
- 波特五力分析
- 市场动态
- 促进因素
- 最终用户产业的IT基础设施采用率有所提高
- 数位化业务转型快速崛起
- 对统一平台的需求不断增长
- 抑制因素
- 缺乏服务水准实施和品质标准
- 机会
- 需要改善 IT服务提供
- 促进因素
第 4 章 ITSM 市场:按构成
- 概述
- 解决方案
- 服务
第五章 ITSM 市场:依功能
- 概述
- 网路管理
- 绩效管理
- 配置管理
- 资料库管理系统
第 6 章 ITSM 市场:按部署
- 概述
- 本地
- 云
第 7 章 ITSM 市场:依公司规模
- 概述
- 大公司
- 中小企业
第 8 章 ITSM 市场:依最终使用者划分
- 概述
- BFSI
- 卫生保健
- 零售/电子商务
- 资讯科技/通讯
- 製造业
- 其他的
第 9 章 ITSM 市场:按地区
- 概述
- 北美洲
- 美国
- 加拿大
- 欧洲
- 英国
- 德国
- 法国
- 义大利
- 西班牙
- 其他的
- 亚太地区
- 中国
- 日本
- 印度
- 澳洲
- 韩国
- 其他的
- 拉丁美洲/中东/非洲
- 拉丁美洲
- 中东
- 非洲
第10章竞争形势
- 介绍
- 关键成功策略
- 10家主要企业产品图谱
- 竞争对手仪表板
- 竞争热图
- 2022年主要企业定位
第十一章 公司简介
- Atlassian
- BMC Software, Inc.
- Broadcom
- Cloud Software Group, Inc.
- Freshworks Inc.
- Hewlett Packard Enterprise Development LP
- IBM Corporation
- Ivanti, Inc.
- Open Text Corporation.
- ServiceNow, Inc.
According to a new report published by Allied Market Research, titled, "ITSM Market," The itsm market was valued at $9.1 billion in 2022, and is estimated to reach $28.7 billion by 2032, growing at a CAGR of 12.4% from 2023 to 2032.
An IT service enables access to information and processes to accomplish important business goals or otherwise provide value. IT services include the deployment and support of enterprise applications, such as Exchange Server; architecting and optimizing IT infrastructure such as storage, networking, and cloud resources; and the creation and management of processes such as help desk support and troubleshooting procedures. By adopting ITSM principles, organizations enhance efficiency, reduce costs, and improve customer satisfaction by delivering reliable and responsive IT services. The continual improvement aspect of ITSM emphasizes an iterative process of refining services over time, allowing organizations to adapt to changing business needs and technological advancements.
The integration of artificial intelligence (AI) and automation in IT Service Management (ITSM) processes is a growing trend that has the potential to transform how IT services are delivered, managed, and supported. AI-powered chatbots and virtual assistants are employed for quicker issue resolution, enhanced self-service options, and improved user experiences. Another trend involves the adoption of DevOps practices within ITSM, emphasizing collaboration between development and operations teams to streamline service delivery and promote a more agile and responsive IT environment. Cloud-based ITSM solutions are also gaining prominence, allowing organizations to leverage scalable and flexible platforms for service management.
The ITSM market is segmented on the basis of component, function, deployment mode, enterprise size, end user, and region. On the basis of component, the market is categorized into solution and services. On the basis of function, the market is divided into configuration management, performance management, network management, and database management system. By deployment mode, it is divided into on-premise and cloud. On the basis of enterprise size, the market is classified into large enterprise and small & medium-sized enterprise. On the basis of end user, the market is segregated into BFSI, healthcare, retail & e-commerce, IT & telecom, manufacturing, and others. By region, the market is analyzed across North America, Europe, Asia-Pacific, and LAMEA.
The global ITSM market is dominated by key players such as Atlassian, BMC Software, Inc., Broadcom, Cloud Software Group, Inc., Freshworks Inc., Hewlett Packard Enterprise Development LP, IBM Corporation, Ivanti, Inc., Open Text Corporation, and ServiceNow, Inc.
Key Benefits For Stakeholders
- This report provides a quantitative analysis of the market segments, current trends, estimations, and dynamics of the itsm market analysis from 2022 to 2032 to identify the prevailing itsm market opportunities.
- The market research is offered along with information related to key drivers, restraints, and opportunities.
- Porter's five forces analysis highlights the potency of buyers and suppliers to enable stakeholders make profit-oriented business decisions and strengthen their supplier-buyer network.
- In-depth analysis of the itsm market segmentation assists to determine the prevailing market opportunities.
- Major countries in each region are mapped according to their revenue contribution to the global market.
- Market player positioning facilitates benchmarking and provides a clear understanding of the present position of the market players.
- The report includes the analysis of the regional as well as global itsm market trends, key players, market segments, application areas, and market growth strategies.
Additional benefits you will get with this purchase are:
- Quarterly Update and* (only available with a corporate license, on listed price)
- 5 additional Company Profile of client Choice pre- or Post-purchase, as a free update.
- Free Upcoming Version on the Purchase of Five and Enterprise User License.
- 16 analyst hours of support* (post-purchase, if you find additional data requirements upon review of the report, you may receive support amounting to 16 analyst hours to solve questions, and post-sale queries)
- 15% Free Customization* (in case the scope or segment of the report does not match your requirements, 15% is equivalent to 3 working days of free work, applicable once)
- Free data Pack on the Five and Enterprise User License. (Excel version of the report)
- Free Updated report if the report is 6-12 months old or older.
- 24-hour priority response*
- Free Industry updates and white papers.
Possible Customization with this report (with additional cost and timeline, please talk to the sales executive to know more)
- Senario Analysis & Growth Trend Comparision
- Regulatory Guidelines
- Additional company profiles with specific to client's interest
- Additional country or region analysis- market size and forecast
- Expanded list for Company Profiles
- Historic market data
- Key player details (including location, contact details, supplier/vendor network etc. in excel format)
- Market share analysis of players at global/region/country level
- SWOT Analysis
Key Market Segments
By Component
- Solution
- Services
By Function
- Network Management
- Performance Management
- Configuration Management
- Database Management System
By Deployment Mode
- On-premise
- Cloud
By Enterprise Size
- Large Enterprise
- Small and Medium-sized Enterprise
By End User
- BFSI
- Healthcare
- Retail and E-commerce
- IT and Telecom
- Manufacturing
- Others
By Region
- North America
- U.S.
- Canada
- Europe
- UK
- Germany
- France
- Italy
- Spain
- Rest of Europe
- Asia-Pacific
- China
- Japan
- India
- Australia
- South Korea
- Rest of Asia-Pacific
- LAMEA
- Latin America
- Middle East
- Africa
Key Market Players:
- Atlassian
- Broadcom
- Freshworks Inc.
- IBM Corporation
- Ivanti, Inc.
- ServiceNow, Inc.
- Cloud Software Group, Inc.
- BMC Software, Inc.
- Hewlett Packard Enterprise Development LP
- Open Text Corporation.
TABLE OF CONTENTS
CHAPTER 1: INTRODUCTION
- 1.1. Report description
- 1.2. Key market segments
- 1.3. Key benefits to the stakeholders
- 1.4. Research methodology
- 1.4.1. Primary research
- 1.4.2. Secondary research
- 1.4.3. Analyst tools and models
CHAPTER 2: EXECUTIVE SUMMARY
- 2.1. CXO Perspective
CHAPTER 3: MARKET OVERVIEW
- 3.1. Market definition and scope
- 3.2. Key findings
- 3.2.1. Top impacting factors
- 3.2.2. Top investment pockets
- 3.3. Porter's five forces analysis
- 3.3.1. Low bargaining power of suppliers
- 3.3.2. Low threat of new entrants
- 3.3.3. Low threat of substitutes
- 3.3.4. Low intensity of rivalry
- 3.3.5. Low bargaining power of buyers
- 3.4. Market dynamics
- 3.4.1. Drivers
- 3.4.1.1. Rising adoption of IT infrastructure across the end user Industries
- 3.4.1.2. Surge in digital business transformation
- 3.4.1.3. Increasing demand for a unified platform
- 3.4.2. Restraints
- 3.4.2.1. Implementation and lack of quality standards in service-level
- 3.4.3. Opportunities
- 3.4.3.1. Need for improved IT service delivery
- 3.4.1. Drivers
CHAPTER 4: ITSM MARKET, BY COMPONENT
- 4.1. Overview
- 4.1.1. Market size and forecast
- 4.2. Solution
- 4.2.1. Key market trends, growth factors and opportunities
- 4.2.2. Market size and forecast, by region
- 4.2.3. Market share analysis by country
- 4.3. Services
- 4.3.1. Key market trends, growth factors and opportunities
- 4.3.2. Market size and forecast, by region
- 4.3.3. Market share analysis by country
CHAPTER 5: ITSM MARKET, BY FUNCTION
- 5.1. Overview
- 5.1.1. Market size and forecast
- 5.2. Network Management
- 5.2.1. Key market trends, growth factors and opportunities
- 5.2.2. Market size and forecast, by region
- 5.2.3. Market share analysis by country
- 5.3. Performance Management
- 5.3.1. Key market trends, growth factors and opportunities
- 5.3.2. Market size and forecast, by region
- 5.3.3. Market share analysis by country
- 5.4. Configuration Management
- 5.4.1. Key market trends, growth factors and opportunities
- 5.4.2. Market size and forecast, by region
- 5.4.3. Market share analysis by country
- 5.5. Database Management System
- 5.5.1. Key market trends, growth factors and opportunities
- 5.5.2. Market size and forecast, by region
- 5.5.3. Market share analysis by country
CHAPTER 6: ITSM MARKET, BY DEPLOYMENT MODE
- 6.1. Overview
- 6.1.1. Market size and forecast
- 6.2. On-premise
- 6.2.1. Key market trends, growth factors and opportunities
- 6.2.2. Market size and forecast, by region
- 6.2.3. Market share analysis by country
- 6.3. Cloud
- 6.3.1. Key market trends, growth factors and opportunities
- 6.3.2. Market size and forecast, by region
- 6.3.3. Market share analysis by country
CHAPTER 7: ITSM MARKET, BY ENTERPRISE SIZE
- 7.1. Overview
- 7.1.1. Market size and forecast
- 7.2. Large Enterprise
- 7.2.1. Key market trends, growth factors and opportunities
- 7.2.2. Market size and forecast, by region
- 7.2.3. Market share analysis by country
- 7.3. Small and Medium-sized Enterprise
- 7.3.1. Key market trends, growth factors and opportunities
- 7.3.2. Market size and forecast, by region
- 7.3.3. Market share analysis by country
CHAPTER 8: ITSM MARKET, BY END USER
- 8.1. Overview
- 8.1.1. Market size and forecast
- 8.2. BFSI
- 8.2.1. Key market trends, growth factors and opportunities
- 8.2.2. Market size and forecast, by region
- 8.2.3. Market share analysis by country
- 8.3. Healthcare
- 8.3.1. Key market trends, growth factors and opportunities
- 8.3.2. Market size and forecast, by region
- 8.3.3. Market share analysis by country
- 8.4. Retail and E-commerce
- 8.4.1. Key market trends, growth factors and opportunities
- 8.4.2. Market size and forecast, by region
- 8.4.3. Market share analysis by country
- 8.5. IT and Telecom
- 8.5.1. Key market trends, growth factors and opportunities
- 8.5.2. Market size and forecast, by region
- 8.5.3. Market share analysis by country
- 8.6. Manufacturing
- 8.6.1. Key market trends, growth factors and opportunities
- 8.6.2. Market size and forecast, by region
- 8.6.3. Market share analysis by country
- 8.7. Others
- 8.7.1. Key market trends, growth factors and opportunities
- 8.7.2. Market size and forecast, by region
- 8.7.3. Market share analysis by country
CHAPTER 9: ITSM MARKET, BY REGION
- 9.1. Overview
- 9.1.1. Market size and forecast By Region
- 9.2. North America
- 9.2.1. Key market trends, growth factors and opportunities
- 9.2.2. Market size and forecast, by Component
- 9.2.3. Market size and forecast, by Function
- 9.2.4. Market size and forecast, by Deployment Mode
- 9.2.5. Market size and forecast, by Enterprise Size
- 9.2.6. Market size and forecast, by End User
- 9.2.7. Market size and forecast, by country
- 9.2.7.1. U.S.
- 9.2.7.1.1. Market size and forecast, by Component
- 9.2.7.1.2. Market size and forecast, by Function
- 9.2.7.1.3. Market size and forecast, by Deployment Mode
- 9.2.7.1.4. Market size and forecast, by Enterprise Size
- 9.2.7.1.5. Market size and forecast, by End User
- 9.2.7.2. Canada
- 9.2.7.2.1. Market size and forecast, by Component
- 9.2.7.2.2. Market size and forecast, by Function
- 9.2.7.2.3. Market size and forecast, by Deployment Mode
- 9.2.7.2.4. Market size and forecast, by Enterprise Size
- 9.2.7.2.5. Market size and forecast, by End User
- 9.3. Europe
- 9.3.1. Key market trends, growth factors and opportunities
- 9.3.2. Market size and forecast, by Component
- 9.3.3. Market size and forecast, by Function
- 9.3.4. Market size and forecast, by Deployment Mode
- 9.3.5. Market size and forecast, by Enterprise Size
- 9.3.6. Market size and forecast, by End User
- 9.3.7. Market size and forecast, by country
- 9.3.7.1. UK
- 9.3.7.1.1. Market size and forecast, by Component
- 9.3.7.1.2. Market size and forecast, by Function
- 9.3.7.1.3. Market size and forecast, by Deployment Mode
- 9.3.7.1.4. Market size and forecast, by Enterprise Size
- 9.3.7.1.5. Market size and forecast, by End User
- 9.3.7.2. Germany
- 9.3.7.2.1. Market size and forecast, by Component
- 9.3.7.2.2. Market size and forecast, by Function
- 9.3.7.2.3. Market size and forecast, by Deployment Mode
- 9.3.7.2.4. Market size and forecast, by Enterprise Size
- 9.3.7.2.5. Market size and forecast, by End User
- 9.3.7.3. France
- 9.3.7.3.1. Market size and forecast, by Component
- 9.3.7.3.2. Market size and forecast, by Function
- 9.3.7.3.3. Market size and forecast, by Deployment Mode
- 9.3.7.3.4. Market size and forecast, by Enterprise Size
- 9.3.7.3.5. Market size and forecast, by End User
- 9.3.7.4. Italy
- 9.3.7.4.1. Market size and forecast, by Component
- 9.3.7.4.2. Market size and forecast, by Function
- 9.3.7.4.3. Market size and forecast, by Deployment Mode
- 9.3.7.4.4. Market size and forecast, by Enterprise Size
- 9.3.7.4.5. Market size and forecast, by End User
- 9.3.7.5. Spain
- 9.3.7.5.1. Market size and forecast, by Component
- 9.3.7.5.2. Market size and forecast, by Function
- 9.3.7.5.3. Market size and forecast, by Deployment Mode
- 9.3.7.5.4. Market size and forecast, by Enterprise Size
- 9.3.7.5.5. Market size and forecast, by End User
- 9.3.7.6. Rest of Europe
- 9.3.7.6.1. Market size and forecast, by Component
- 9.3.7.6.2. Market size and forecast, by Function
- 9.3.7.6.3. Market size and forecast, by Deployment Mode
- 9.3.7.6.4. Market size and forecast, by Enterprise Size
- 9.3.7.6.5. Market size and forecast, by End User
- 9.4. Asia-Pacific
- 9.4.1. Key market trends, growth factors and opportunities
- 9.4.2. Market size and forecast, by Component
- 9.4.3. Market size and forecast, by Function
- 9.4.4. Market size and forecast, by Deployment Mode
- 9.4.5. Market size and forecast, by Enterprise Size
- 9.4.6. Market size and forecast, by End User
- 9.4.7. Market size and forecast, by country
- 9.4.7.1. China
- 9.4.7.1.1. Market size and forecast, by Component
- 9.4.7.1.2. Market size and forecast, by Function
- 9.4.7.1.3. Market size and forecast, by Deployment Mode
- 9.4.7.1.4. Market size and forecast, by Enterprise Size
- 9.4.7.1.5. Market size and forecast, by End User
- 9.4.7.2. Japan
- 9.4.7.2.1. Market size and forecast, by Component
- 9.4.7.2.2. Market size and forecast, by Function
- 9.4.7.2.3. Market size and forecast, by Deployment Mode
- 9.4.7.2.4. Market size and forecast, by Enterprise Size
- 9.4.7.2.5. Market size and forecast, by End User
- 9.4.7.3. India
- 9.4.7.3.1. Market size and forecast, by Component
- 9.4.7.3.2. Market size and forecast, by Function
- 9.4.7.3.3. Market size and forecast, by Deployment Mode
- 9.4.7.3.4. Market size and forecast, by Enterprise Size
- 9.4.7.3.5. Market size and forecast, by End User
- 9.4.7.4. Australia
- 9.4.7.4.1. Market size and forecast, by Component
- 9.4.7.4.2. Market size and forecast, by Function
- 9.4.7.4.3. Market size and forecast, by Deployment Mode
- 9.4.7.4.4. Market size and forecast, by Enterprise Size
- 9.4.7.4.5. Market size and forecast, by End User
- 9.4.7.5. South Korea
- 9.4.7.5.1. Market size and forecast, by Component
- 9.4.7.5.2. Market size and forecast, by Function
- 9.4.7.5.3. Market size and forecast, by Deployment Mode
- 9.4.7.5.4. Market size and forecast, by Enterprise Size
- 9.4.7.5.5. Market size and forecast, by End User
- 9.4.7.6. Rest of Asia-Pacific
- 9.4.7.6.1. Market size and forecast, by Component
- 9.4.7.6.2. Market size and forecast, by Function
- 9.4.7.6.3. Market size and forecast, by Deployment Mode
- 9.4.7.6.4. Market size and forecast, by Enterprise Size
- 9.4.7.6.5. Market size and forecast, by End User
- 9.5. LAMEA
- 9.5.1. Key market trends, growth factors and opportunities
- 9.5.2. Market size and forecast, by Component
- 9.5.3. Market size and forecast, by Function
- 9.5.4. Market size and forecast, by Deployment Mode
- 9.5.5. Market size and forecast, by Enterprise Size
- 9.5.6. Market size and forecast, by End User
- 9.5.7. Market size and forecast, by country
- 9.5.7.1. Latin America
- 9.5.7.1.1. Market size and forecast, by Component
- 9.5.7.1.2. Market size and forecast, by Function
- 9.5.7.1.3. Market size and forecast, by Deployment Mode
- 9.5.7.1.4. Market size and forecast, by Enterprise Size
- 9.5.7.1.5. Market size and forecast, by End User
- 9.5.7.2. Middle East
- 9.5.7.2.1. Market size and forecast, by Component
- 9.5.7.2.2. Market size and forecast, by Function
- 9.5.7.2.3. Market size and forecast, by Deployment Mode
- 9.5.7.2.4. Market size and forecast, by Enterprise Size
- 9.5.7.2.5. Market size and forecast, by End User
- 9.5.7.3. Africa
- 9.5.7.3.1. Market size and forecast, by Component
- 9.5.7.3.2. Market size and forecast, by Function
- 9.5.7.3.3. Market size and forecast, by Deployment Mode
- 9.5.7.3.4. Market size and forecast, by Enterprise Size
- 9.5.7.3.5. Market size and forecast, by End User
CHAPTER 10: COMPETITIVE LANDSCAPE
- 10.1. Introduction
- 10.2. Top winning strategies
- 10.3. Product mapping of top 10 player
- 10.4. Competitive dashboard
- 10.5. Competitive heatmap
- 10.6. Top player positioning, 2022
CHAPTER 11: COMPANY PROFILES
- 11.1. Atlassian
- 11.1.1. Company overview
- 11.1.2. Key executives
- 11.1.3. Company snapshot
- 11.1.4. Operating business segments
- 11.1.5. Product portfolio
- 11.1.6. Business performance
- 11.1.7. Key strategic moves and developments
- 11.2. BMC Software, Inc.
- 11.2.1. Company overview
- 11.2.2. Key executives
- 11.2.3. Company snapshot
- 11.2.4. Operating business segments
- 11.2.5. Product portfolio
- 11.2.6. Key strategic moves and developments
- 11.3. Broadcom
- 11.3.1. Company overview
- 11.3.2. Key executives
- 11.3.3. Company snapshot
- 11.3.4. Operating business segments
- 11.3.5. Product portfolio
- 11.3.6. Business performance
- 11.4. Cloud Software Group, Inc.
- 11.4.1. Company overview
- 11.4.2. Key executives
- 11.4.3. Company snapshot
- 11.4.4. Operating business segments
- 11.4.5. Product portfolio
- 11.4.6. Key strategic moves and developments
- 11.5. Freshworks Inc.
- 11.5.1. Company overview
- 11.5.2. Key executives
- 11.5.3. Company snapshot
- 11.5.4. Operating business segments
- 11.5.5. Product portfolio
- 11.5.6. Business performance
- 11.5.7. Key strategic moves and developments
- 11.6. Hewlett Packard Enterprise Development LP
- 11.6.1. Company overview
- 11.6.2. Key executives
- 11.6.3. Company snapshot
- 11.6.4. Operating business segments
- 11.6.5. Product portfolio
- 11.6.6. Business performance
- 11.7. IBM Corporation
- 11.7.1. Company overview
- 11.7.2. Key executives
- 11.7.3. Company snapshot
- 11.7.4. Operating business segments
- 11.7.5. Product portfolio
- 11.7.6. Business performance
- 11.7.7. Key strategic moves and developments
- 11.8. Ivanti, Inc.
- 11.8.1. Company overview
- 11.8.2. Key executives
- 11.8.3. Company snapshot
- 11.8.4. Operating business segments
- 11.8.5. Product portfolio
- 11.8.6. Key strategic moves and developments
- 11.9. Open Text Corporation.
- 11.9.1. Company overview
- 11.9.2. Key executives
- 11.9.3. Company snapshot
- 11.9.4. Operating business segments
- 11.9.5. Product portfolio
- 11.9.6. Business performance
- 11.10. ServiceNow, Inc.
- 11.10.1. Company overview
- 11.10.2. Key executives
- 11.10.3. Company snapshot
- 11.10.4. Operating business segments
- 11.10.5. Product portfolio
- 11.10.6. Business performance
- 11.10.7. Key strategic moves and developments
LIST OF TABLES
- TABLE 01. GLOBAL ITSM MARKET, BY COMPONENT, 2022-2032 ($MILLION)
- TABLE 02. ITSM MARKET FOR SOLUTION, BY REGION, 2022-2032 ($MILLION)
- TABLE 03. ITSM MARKET FOR SERVICES, BY REGION, 2022-2032 ($MILLION)
- TABLE 04. GLOBAL ITSM MARKET, BY FUNCTION, 2022-2032 ($MILLION)
- TABLE 05. ITSM MARKET FOR NETWORK MANAGEMENT, BY REGION, 2022-2032 ($MILLION)
- TABLE 06. ITSM MARKET FOR PERFORMANCE MANAGEMENT, BY REGION, 2022-2032 ($MILLION)
- TABLE 07. ITSM MARKET FOR CONFIGURATION MANAGEMENT, BY REGION, 2022-2032 ($MILLION)
- TABLE 08. ITSM MARKET FOR DATABASE MANAGEMENT SYSTEM, BY REGION, 2022-2032 ($MILLION)
- TABLE 09. GLOBAL ITSM MARKET, BY DEPLOYMENT MODE, 2022-2032 ($MILLION)
- TABLE 10. ITSM MARKET FOR ON-PREMISE, BY REGION, 2022-2032 ($MILLION)
- TABLE 11. ITSM MARKET FOR CLOUD, BY REGION, 2022-2032 ($MILLION)
- TABLE 12. GLOBAL ITSM MARKET, BY ENTERPRISE SIZE, 2022-2032 ($MILLION)
- TABLE 13. ITSM MARKET FOR LARGE ENTERPRISE, BY REGION, 2022-2032 ($MILLION)
- TABLE 14. ITSM MARKET FOR SMALL AND MEDIUM-SIZED ENTERPRISE, BY REGION, 2022-2032 ($MILLION)
- TABLE 15. GLOBAL ITSM MARKET, BY END USER, 2022-2032 ($MILLION)
- TABLE 16. ITSM MARKET FOR BFSI, BY REGION, 2022-2032 ($MILLION)
- TABLE 17. ITSM MARKET FOR HEALTHCARE, BY REGION, 2022-2032 ($MILLION)
- TABLE 18. ITSM MARKET FOR RETAIL AND E-COMMERCE, BY REGION, 2022-2032 ($MILLION)
- TABLE 19. ITSM MARKET FOR IT AND TELECOM, BY REGION, 2022-2032 ($MILLION)
- TABLE 20. ITSM MARKET FOR MANUFACTURING, BY REGION, 2022-2032 ($MILLION)
- TABLE 21. ITSM MARKET FOR OTHERS, BY REGION, 2022-2032 ($MILLION)
- TABLE 22. ITSM MARKET, BY REGION, 2022-2032 ($MILLION)
- TABLE 23. NORTH AMERICA ITSM MARKET, BY COMPONENT, 2022-2032 ($MILLION)
- TABLE 24. NORTH AMERICA ITSM MARKET, BY FUNCTION, 2022-2032 ($MILLION)
- TABLE 25. NORTH AMERICA ITSM MARKET, BY DEPLOYMENT MODE, 2022-2032 ($MILLION)
- TABLE 26. NORTH AMERICA ITSM MARKET, BY ENTERPRISE SIZE, 2022-2032 ($MILLION)
- TABLE 27. NORTH AMERICA ITSM MARKET, BY END USER, 2022-2032 ($MILLION)
- TABLE 28. NORTH AMERICA ITSM MARKET, BY COUNTRY, 2022-2032 ($MILLION)
- TABLE 29. U.S. ITSM MARKET, BY COMPONENT, 2022-2032 ($MILLION)
- TABLE 30. U.S. ITSM MARKET, BY FUNCTION, 2022-2032 ($MILLION)
- TABLE 31. U.S. ITSM MARKET, BY DEPLOYMENT MODE, 2022-2032 ($MILLION)
- TABLE 32. U.S. ITSM MARKET, BY ENTERPRISE SIZE, 2022-2032 ($MILLION)
- TABLE 33. U.S. ITSM MARKET, BY END USER, 2022-2032 ($MILLION)
- TABLE 34. CANADA ITSM MARKET, BY COMPONENT, 2022-2032 ($MILLION)
- TABLE 35. CANADA ITSM MARKET, BY FUNCTION, 2022-2032 ($MILLION)
- TABLE 36. CANADA ITSM MARKET, BY DEPLOYMENT MODE, 2022-2032 ($MILLION)
- TABLE 37. CANADA ITSM MARKET, BY ENTERPRISE SIZE, 2022-2032 ($MILLION)
- TABLE 38. CANADA ITSM MARKET, BY END USER, 2022-2032 ($MILLION)
- TABLE 39. EUROPE ITSM MARKET, BY COMPONENT, 2022-2032 ($MILLION)
- TABLE 40. EUROPE ITSM MARKET, BY FUNCTION, 2022-2032 ($MILLION)
- TABLE 41. EUROPE ITSM MARKET, BY DEPLOYMENT MODE, 2022-2032 ($MILLION)
- TABLE 42. EUROPE ITSM MARKET, BY ENTERPRISE SIZE, 2022-2032 ($MILLION)
- TABLE 43. EUROPE ITSM MARKET, BY END USER, 2022-2032 ($MILLION)
- TABLE 44. EUROPE ITSM MARKET, BY COUNTRY, 2022-2032 ($MILLION)
- TABLE 45. UK ITSM MARKET, BY COMPONENT, 2022-2032 ($MILLION)
- TABLE 46. UK ITSM MARKET, BY FUNCTION, 2022-2032 ($MILLION)
- TABLE 47. UK ITSM MARKET, BY DEPLOYMENT MODE, 2022-2032 ($MILLION)
- TABLE 48. UK ITSM MARKET, BY ENTERPRISE SIZE, 2022-2032 ($MILLION)
- TABLE 49. UK ITSM MARKET, BY END USER, 2022-2032 ($MILLION)
- TABLE 50. GERMANY ITSM MARKET, BY COMPONENT, 2022-2032 ($MILLION)
- TABLE 51. GERMANY ITSM MARKET, BY FUNCTION, 2022-2032 ($MILLION)
- TABLE 52. GERMANY ITSM MARKET, BY DEPLOYMENT MODE, 2022-2032 ($MILLION)
- TABLE 53. GERMANY ITSM MARKET, BY ENTERPRISE SIZE, 2022-2032 ($MILLION)
- TABLE 54. GERMANY ITSM MARKET, BY END USER, 2022-2032 ($MILLION)
- TABLE 55. FRANCE ITSM MARKET, BY COMPONENT, 2022-2032 ($MILLION)
- TABLE 56. FRANCE ITSM MARKET, BY FUNCTION, 2022-2032 ($MILLION)
- TABLE 57. FRANCE ITSM MARKET, BY DEPLOYMENT MODE, 2022-2032 ($MILLION)
- TABLE 58. FRANCE ITSM MARKET, BY ENTERPRISE SIZE, 2022-2032 ($MILLION)
- TABLE 59. FRANCE ITSM MARKET, BY END USER, 2022-2032 ($MILLION)
- TABLE 60. ITALY ITSM MARKET, BY COMPONENT, 2022-2032 ($MILLION)
- TABLE 61. ITALY ITSM MARKET, BY FUNCTION, 2022-2032 ($MILLION)
- TABLE 62. ITALY ITSM MARKET, BY DEPLOYMENT MODE, 2022-2032 ($MILLION)
- TABLE 63. ITALY ITSM MARKET, BY ENTERPRISE SIZE, 2022-2032 ($MILLION)
- TABLE 64. ITALY ITSM MARKET, BY END USER, 2022-2032 ($MILLION)
- TABLE 65. SPAIN ITSM MARKET, BY COMPONENT, 2022-2032 ($MILLION)
- TABLE 66. SPAIN ITSM MARKET, BY FUNCTION, 2022-2032 ($MILLION)
- TABLE 67. SPAIN ITSM MARKET, BY DEPLOYMENT MODE, 2022-2032 ($MILLION)
- TABLE 68. SPAIN ITSM MARKET, BY ENTERPRISE SIZE, 2022-2032 ($MILLION)
- TABLE 69. SPAIN ITSM MARKET, BY END USER, 2022-2032 ($MILLION)
- TABLE 70. REST OF EUROPE ITSM MARKET, BY COMPONENT, 2022-2032 ($MILLION)
- TABLE 71. REST OF EUROPE ITSM MARKET, BY FUNCTION, 2022-2032 ($MILLION)
- TABLE 72. REST OF EUROPE ITSM MARKET, BY DEPLOYMENT MODE, 2022-2032 ($MILLION)
- TABLE 73. REST OF EUROPE ITSM MARKET, BY ENTERPRISE SIZE, 2022-2032 ($MILLION)
- TABLE 74. REST OF EUROPE ITSM MARKET, BY END USER, 2022-2032 ($MILLION)
- TABLE 75. ASIA-PACIFIC ITSM MARKET, BY COMPONENT, 2022-2032 ($MILLION)
- TABLE 76. ASIA-PACIFIC ITSM MARKET, BY FUNCTION, 2022-2032 ($MILLION)
- TABLE 77. ASIA-PACIFIC ITSM MARKET, BY DEPLOYMENT MODE, 2022-2032 ($MILLION)
- TABLE 78. ASIA-PACIFIC ITSM MARKET, BY ENTERPRISE SIZE, 2022-2032 ($MILLION)
- TABLE 79. ASIA-PACIFIC ITSM MARKET, BY END USER, 2022-2032 ($MILLION)
- TABLE 80. ASIA-PACIFIC ITSM MARKET, BY COUNTRY, 2022-2032 ($MILLION)
- TABLE 81. CHINA ITSM MARKET, BY COMPONENT, 2022-2032 ($MILLION)
- TABLE 82. CHINA ITSM MARKET, BY FUNCTION, 2022-2032 ($MILLION)
- TABLE 83. CHINA ITSM MARKET, BY DEPLOYMENT MODE, 2022-2032 ($MILLION)
- TABLE 84. CHINA ITSM MARKET, BY ENTERPRISE SIZE, 2022-2032 ($MILLION)
- TABLE 85. CHINA ITSM MARKET, BY END USER, 2022-2032 ($MILLION)
- TABLE 86. JAPAN ITSM MARKET, BY COMPONENT, 2022-2032 ($MILLION)
- TABLE 87. JAPAN ITSM MARKET, BY FUNCTION, 2022-2032 ($MILLION)
- TABLE 88. JAPAN ITSM MARKET, BY DEPLOYMENT MODE, 2022-2032 ($MILLION)
- TABLE 89. JAPAN ITSM MARKET, BY ENTERPRISE SIZE, 2022-2032 ($MILLION)
- TABLE 90. JAPAN ITSM MARKET, BY END USER, 2022-2032 ($MILLION)
- TABLE 91. INDIA ITSM MARKET, BY COMPONENT, 2022-2032 ($MILLION)
- TABLE 92. INDIA ITSM MARKET, BY FUNCTION, 2022-2032 ($MILLION)
- TABLE 93. INDIA ITSM MARKET, BY DEPLOYMENT MODE, 2022-2032 ($MILLION)
- TABLE 94. INDIA ITSM MARKET, BY ENTERPRISE SIZE, 2022-2032 ($MILLION)
- TABLE 95. INDIA ITSM MARKET, BY END USER, 2022-2032 ($MILLION)
- TABLE 96. AUSTRALIA ITSM MARKET, BY COMPONENT, 2022-2032 ($MILLION)
- TABLE 97. AUSTRALIA ITSM MARKET, BY FUNCTION, 2022-2032 ($MILLION)
- TABLE 98. AUSTRALIA ITSM MARKET, BY DEPLOYMENT MODE, 2022-2032 ($MILLION)
- TABLE 99. AUSTRALIA ITSM MARKET, BY ENTERPRISE SIZE, 2022-2032 ($MILLION)
- TABLE 100. AUSTRALIA ITSM MARKET, BY END USER, 2022-2032 ($MILLION)
- TABLE 101. SOUTH KOREA ITSM MARKET, BY COMPONENT, 2022-2032 ($MILLION)
- TABLE 102. SOUTH KOREA ITSM MARKET, BY FUNCTION, 2022-2032 ($MILLION)
- TABLE 103. SOUTH KOREA ITSM MARKET, BY DEPLOYMENT MODE, 2022-2032 ($MILLION)
- TABLE 104. SOUTH KOREA ITSM MARKET, BY ENTERPRISE SIZE, 2022-2032 ($MILLION)
- TABLE 105. SOUTH KOREA ITSM MARKET, BY END USER, 2022-2032 ($MILLION)
- TABLE 106. REST OF ASIA-PACIFIC ITSM MARKET, BY COMPONENT, 2022-2032 ($MILLION)
- TABLE 107. REST OF ASIA-PACIFIC ITSM MARKET, BY FUNCTION, 2022-2032 ($MILLION)
- TABLE 108. REST OF ASIA-PACIFIC ITSM MARKET, BY DEPLOYMENT MODE, 2022-2032 ($MILLION)
- TABLE 109. REST OF ASIA-PACIFIC ITSM MARKET, BY ENTERPRISE SIZE, 2022-2032 ($MILLION)
- TABLE 110. REST OF ASIA-PACIFIC ITSM MARKET, BY END USER, 2022-2032 ($MILLION)
- TABLE 111. LAMEA ITSM MARKET, BY COMPONENT, 2022-2032 ($MILLION)
- TABLE 112. LAMEA ITSM MARKET, BY FUNCTION, 2022-2032 ($MILLION)
- TABLE 113. LAMEA ITSM MARKET, BY DEPLOYMENT MODE, 2022-2032 ($MILLION)
- TABLE 114. LAMEA ITSM MARKET, BY ENTERPRISE SIZE, 2022-2032 ($MILLION)
- TABLE 115. LAMEA ITSM MARKET, BY END USER, 2022-2032 ($MILLION)
- TABLE 116. LAMEA ITSM MARKET, BY COUNTRY, 2022-2032 ($MILLION)
- TABLE 117. LATIN AMERICA ITSM MARKET, BY COMPONENT, 2022-2032 ($MILLION)
- TABLE 118. LATIN AMERICA ITSM MARKET, BY FUNCTION, 2022-2032 ($MILLION)
- TABLE 119. LATIN AMERICA ITSM MARKET, BY DEPLOYMENT MODE, 2022-2032 ($MILLION)
- TABLE 120. LATIN AMERICA ITSM MARKET, BY ENTERPRISE SIZE, 2022-2032 ($MILLION)
- TABLE 121. LATIN AMERICA ITSM MARKET, BY END USER, 2022-2032 ($MILLION)
- TABLE 122. MIDDLE EAST ITSM MARKET, BY COMPONENT, 2022-2032 ($MILLION)
- TABLE 123. MIDDLE EAST ITSM MARKET, BY FUNCTION, 2022-2032 ($MILLION)
- TABLE 124. MIDDLE EAST ITSM MARKET, BY DEPLOYMENT MODE, 2022-2032 ($MILLION)
- TABLE 125. MIDDLE EAST ITSM MARKET, BY ENTERPRISE SIZE, 2022-2032 ($MILLION)
- TABLE 126. MIDDLE EAST ITSM MARKET, BY END USER, 2022-2032 ($MILLION)
- TABLE 127. AFRICA ITSM MARKET, BY COMPONENT, 2022-2032 ($MILLION)
- TABLE 128. AFRICA ITSM MARKET, BY FUNCTION, 2022-2032 ($MILLION)
- TABLE 129. AFRICA ITSM MARKET, BY DEPLOYMENT MODE, 2022-2032 ($MILLION)
- TABLE 130. AFRICA ITSM MARKET, BY ENTERPRISE SIZE, 2022-2032 ($MILLION)
- TABLE 131. AFRICA ITSM MARKET, BY END USER, 2022-2032 ($MILLION)
- TABLE 132. ATLASSIAN: KEY EXECUTIVES
- TABLE 133. ATLASSIAN: COMPANY SNAPSHOT
- TABLE 134. ATLASSIAN: SERVICE SEGMENTS
- TABLE 135. ATLASSIAN: PRODUCT PORTFOLIO
- TABLE 136. ATLASSIAN: KEY STRATERGIES
- TABLE 137. BMC SOFTWARE, INC.: KEY EXECUTIVES
- TABLE 138. BMC SOFTWARE, INC.: COMPANY SNAPSHOT
- TABLE 139. BMC SOFTWARE, INC.: PRODUCT SEGMENTS
- TABLE 140. BMC SOFTWARE, INC.: PRODUCT PORTFOLIO
- TABLE 141. BMC SOFTWARE, INC.: KEY STRATERGIES
- TABLE 142. BROADCOM: KEY EXECUTIVES
- TABLE 143. BROADCOM: COMPANY SNAPSHOT
- TABLE 144. BROADCOM: PRODUCT SEGMENTS
- TABLE 145. BROADCOM: PRODUCT PORTFOLIO
- TABLE 146. CLOUD SOFTWARE GROUP, INC.: KEY EXECUTIVES
- TABLE 147. CLOUD SOFTWARE GROUP, INC.: COMPANY SNAPSHOT
- TABLE 148. CLOUD SOFTWARE GROUP, INC.: SERVICE SEGMENTS
- TABLE 149. CLOUD SOFTWARE GROUP, INC.: PRODUCT PORTFOLIO
- TABLE 150. CLOUD SOFTWARE GROUP, INC.: KEY STRATERGIES
- TABLE 151. FRESHWORKS INC.: KEY EXECUTIVES
- TABLE 152. FRESHWORKS INC.: COMPANY SNAPSHOT
- TABLE 153. FRESHWORKS INC.: SERVICE SEGMENTS
- TABLE 154. FRESHWORKS INC.: PRODUCT PORTFOLIO
- TABLE 155. FRESHWORKS INC.: KEY STRATERGIES
- TABLE 156. HEWLETT PACKARD ENTERPRISE DEVELOPMENT LP: KEY EXECUTIVES
- TABLE 157. HEWLETT PACKARD ENTERPRISE DEVELOPMENT LP: COMPANY SNAPSHOT
- TABLE 158. HEWLETT PACKARD ENTERPRISE DEVELOPMENT LP: SERVICE SEGMENTS
- TABLE 159. HEWLETT PACKARD ENTERPRISE DEVELOPMENT LP: PRODUCT PORTFOLIO
- TABLE 160. IBM CORPORATION: KEY EXECUTIVES
- TABLE 161. IBM CORPORATION: COMPANY SNAPSHOT
- TABLE 162. IBM CORPORATION: PRODUCT SEGMENTS
- TABLE 163. IBM CORPORATION: PRODUCT PORTFOLIO
- TABLE 164. IBM CORPORATION: KEY STRATERGIES
- TABLE 165. IVANTI, INC.: KEY EXECUTIVES
- TABLE 166. IVANTI, INC.: COMPANY SNAPSHOT
- TABLE 167. IVANTI, INC.: SERVICE SEGMENTS
- TABLE 168. IVANTI, INC.: PRODUCT PORTFOLIO
- TABLE 169. IVANTI, INC.: KEY STRATERGIES
- TABLE 170. OPEN TEXT CORPORATION.: KEY EXECUTIVES
- TABLE 171. OPEN TEXT CORPORATION.: COMPANY SNAPSHOT
- TABLE 172. OPEN TEXT CORPORATION.: SERVICE SEGMENTS
- TABLE 173. OPEN TEXT CORPORATION.: PRODUCT PORTFOLIO
- TABLE 174. SERVICENOW, INC.: KEY EXECUTIVES
- TABLE 175. SERVICENOW, INC.: COMPANY SNAPSHOT
- TABLE 176. SERVICENOW, INC.: PRODUCT SEGMENTS
- TABLE 177. SERVICENOW, INC.: PRODUCT PORTFOLIO
- TABLE 178. SERVICENOW, INC.: KEY STRATERGIES
LIST OF FIGURES
- FIGURE 01. ITSM MARKET, 2022-2032
- FIGURE 02. SEGMENTATION OF ITSM MARKET,2022-2032
- FIGURE 03. TOP IMPACTING FACTORS IN ITSM MARKET (2022 TO 2032)
- FIGURE 04. TOP INVESTMENT POCKETS IN ITSM MARKET (2023-2032)
- FIGURE 05. LOW BARGAINING POWER OF SUPPLIERS
- FIGURE 06. LOW THREAT OF NEW ENTRANTS
- FIGURE 07. LOW THREAT OF SUBSTITUTES
- FIGURE 08. LOW INTENSITY OF RIVALRY
- FIGURE 09. LOW BARGAINING POWER OF BUYERS
- FIGURE 10. GLOBAL ITSM MARKET:DRIVERS, RESTRAINTS AND OPPORTUNITIES
- FIGURE 11. ITSM MARKET, BY COMPONENT, 2022 AND 2032(%)
- FIGURE 12. COMPARATIVE SHARE ANALYSIS OF ITSM MARKET FOR SOLUTION, BY COUNTRY 2022 AND 2032(%)
- FIGURE 13. COMPARATIVE SHARE ANALYSIS OF ITSM MARKET FOR SERVICES, BY COUNTRY 2022 AND 2032(%)
- FIGURE 14. ITSM MARKET, BY FUNCTION, 2022 AND 2032(%)
- FIGURE 15. COMPARATIVE SHARE ANALYSIS OF ITSM MARKET FOR NETWORK MANAGEMENT, BY COUNTRY 2022 AND 2032(%)
- FIGURE 16. COMPARATIVE SHARE ANALYSIS OF ITSM MARKET FOR PERFORMANCE MANAGEMENT, BY COUNTRY 2022 AND 2032(%)
- FIGURE 17. COMPARATIVE SHARE ANALYSIS OF ITSM MARKET FOR CONFIGURATION MANAGEMENT, BY COUNTRY 2022 AND 2032(%)
- FIGURE 18. COMPARATIVE SHARE ANALYSIS OF ITSM MARKET FOR DATABASE MANAGEMENT SYSTEM, BY COUNTRY 2022 AND 2032(%)
- FIGURE 19. ITSM MARKET, BY DEPLOYMENT MODE, 2022 AND 2032(%)
- FIGURE 20. COMPARATIVE SHARE ANALYSIS OF ITSM MARKET FOR ON-PREMISE, BY COUNTRY 2022 AND 2032(%)
- FIGURE 21. COMPARATIVE SHARE ANALYSIS OF ITSM MARKET FOR CLOUD, BY COUNTRY 2022 AND 2032(%)
- FIGURE 22. ITSM MARKET, BY ENTERPRISE SIZE, 2022 AND 2032(%)
- FIGURE 23. COMPARATIVE SHARE ANALYSIS OF ITSM MARKET FOR LARGE ENTERPRISE, BY COUNTRY 2022 AND 2032(%)
- FIGURE 24. COMPARATIVE SHARE ANALYSIS OF ITSM MARKET FOR SMALL AND MEDIUM-SIZED ENTERPRISE, BY COUNTRY 2022 AND 2032(%)
- FIGURE 25. ITSM MARKET, BY END USER, 2022 AND 2032(%)
- FIGURE 26. COMPARATIVE SHARE ANALYSIS OF ITSM MARKET FOR BFSI, BY COUNTRY 2022 AND 2032(%)
- FIGURE 27. COMPARATIVE SHARE ANALYSIS OF ITSM MARKET FOR HEALTHCARE, BY COUNTRY 2022 AND 2032(%)
- FIGURE 28. COMPARATIVE SHARE ANALYSIS OF ITSM MARKET FOR RETAIL AND E-COMMERCE, BY COUNTRY 2022 AND 2032(%)
- FIGURE 29. COMPARATIVE SHARE ANALYSIS OF ITSM MARKET FOR IT AND TELECOM, BY COUNTRY 2022 AND 2032(%)
- FIGURE 30. COMPARATIVE SHARE ANALYSIS OF ITSM MARKET FOR MANUFACTURING, BY COUNTRY 2022 AND 2032(%)
- FIGURE 31. COMPARATIVE SHARE ANALYSIS OF ITSM MARKET FOR OTHERS, BY COUNTRY 2022 AND 2032(%)
- FIGURE 32. ITSM MARKET BY REGION, 2022 AND 2032(%)
- FIGURE 33. U.S. ITSM MARKET, 2022-2032 ($MILLION)
- FIGURE 34. CANADA ITSM MARKET, 2022-2032 ($MILLION)
- FIGURE 35. UK ITSM MARKET, 2022-2032 ($MILLION)
- FIGURE 36. GERMANY ITSM MARKET, 2022-2032 ($MILLION)
- FIGURE 37. FRANCE ITSM MARKET, 2022-2032 ($MILLION)
- FIGURE 38. ITALY ITSM MARKET, 2022-2032 ($MILLION)
- FIGURE 39. SPAIN ITSM MARKET, 2022-2032 ($MILLION)
- FIGURE 40. REST OF EUROPE ITSM MARKET, 2022-2032 ($MILLION)
- FIGURE 41. CHINA ITSM MARKET, 2022-2032 ($MILLION)
- FIGURE 42. JAPAN ITSM MARKET, 2022-2032 ($MILLION)
- FIGURE 43. INDIA ITSM MARKET, 2022-2032 ($MILLION)
- FIGURE 44. AUSTRALIA ITSM MARKET, 2022-2032 ($MILLION)
- FIGURE 45. SOUTH KOREA ITSM MARKET, 2022-2032 ($MILLION)
- FIGURE 46. REST OF ASIA-PACIFIC ITSM MARKET, 2022-2032 ($MILLION)
- FIGURE 47. LATIN AMERICA ITSM MARKET, 2022-2032 ($MILLION)
- FIGURE 48. MIDDLE EAST ITSM MARKET, 2022-2032 ($MILLION)
- FIGURE 49. AFRICA ITSM MARKET, 2022-2032 ($MILLION)
- FIGURE 50. TOP WINNING STRATEGIES, BY YEAR (2020-2023)
- FIGURE 51. TOP WINNING STRATEGIES, BY DEVELOPMENT (2020-2023)
- FIGURE 52. TOP WINNING STRATEGIES, BY COMPANY (2020-2023)
- FIGURE 53. PRODUCT MAPPING OF TOP 10 PLAYERS
- FIGURE 54. COMPETITIVE DASHBOARD
- FIGURE 55. COMPETITIVE HEATMAP: ITSM MARKET
- FIGURE 56. TOP PLAYER POSITIONING, 2022
- FIGURE 57. ATLASSIAN: NET REVENUE, 2020-2022 ($MILLION)
- FIGURE 58. ATLASSIAN: RESEARCH & DEVELOPMENT EXPENDITURE, 2020-2022 ($MILLION)
- FIGURE 59. ATLASSIAN: REVENUE SHARE BY SEGMENT, 2022 (%)
- FIGURE 60. ATLASSIAN: REVENUE SHARE BY REGION, 2022 (%)
- FIGURE 61. BROADCOM: NET SALES, 2020-2022 ($MILLION)
- FIGURE 62. BROADCOM: RESEARCH & DEVELOPMENT EXPENDITURE, 2020-2022 ($MILLION)
- FIGURE 63. BROADCOM: REVENUE SHARE BY SEGMENT, 2022 (%)
- FIGURE 64. BROADCOM: REVENUE SHARE BY REGION, 2022 (%)
- FIGURE 65. FRESHWORKS INC.: NET REVENUE, 2020-2022 ($MILLION)
- FIGURE 66. FRESHWORKS INC.: RESEARCH & DEVELOPMENT EXPENDITURE, 2020-2022 ($MILLION)
- FIGURE 67. FRESHWORKS INC.: REVENUE SHARE BY REGION, 2022 (%)
- FIGURE 68. HEWLETT PACKARD ENTERPRISE DEVELOPMENT LP: NET REVENUE, 2020-2022 ($MILLION)
- FIGURE 69. HEWLETT PACKARD ENTERPRISE DEVELOPMENT LP: RESEARCH & DEVELOPMENT EXPENDITURE, 2020-2022 ($MILLION)
- FIGURE 70. HEWLETT PACKARD ENTERPRISE DEVELOPMENT LP: REVENUE SHARE BY SEGMENT, 2022 (%)
- FIGURE 71. HEWLETT PACKARD ENTERPRISE DEVELOPMENT LP: REVENUE SHARE BY REGION, 2022 (%)
- FIGURE 72. IBM CORPORATION: NET REVENUE, 2020-2022 ($MILLION)
- FIGURE 73. IBM CORPORATION: RESEARCH & DEVELOPMENT EXPENDITURE, 2020-2022 ($MILLION)
- FIGURE 74. IBM CORPORATION: REVENUE SHARE BY SEGMENT, 2022 (%)
- FIGURE 75. IBM CORPORATION: REVENUE SHARE BY REGION, 2022 (%)
- FIGURE 76. OPEN TEXT CORPORATION.: NET REVENUE, 2020-2022 ($MILLION)
- FIGURE 77. OPEN TEXT CORPORATION.: RESEARCH & DEVELOPMENT EXPENDITURE, 2020-2022 ($MILLION)
- FIGURE 78. OPEN TEXT CORPORATION.: REVENUE SHARE BY REGION, 2022 (%)
- FIGURE 79. OPEN TEXT CORPORATION.: REVENUE SHARE BY SEGMENT, 2022 (%)
- FIGURE 80. SERVICENOW, INC.: NET REVENUE, 2020-2022 ($MILLION)
- FIGURE 81. SERVICENOW, INC.: RESEARCH & DEVELOPMENT EXPENDITURE, 2020-2022 ($MILLION)
- FIGURE 82. SERVICENOW, INC.: REVENUE SHARE BY REGION, 2022 (%)
 全球人工智慧IT服务成长机会
 ITSM:市场占有率分析、产业趋势和统计数据、成长预测(2025-2030 年)
 全球资讯科技服务管理市场
 IT服务管理工具的全球市场:产业分析,规模,占有率,成长,趋势,预测(2024年~2033年)资讯科技服务管理市场规模、份额、趋势分析报告:2025-2030 年按组件、技术、部署、公司规模、产业、地区和细分市场预测全球资讯科技 (IT) 服务市场
 服务管理与编排:全球市场预测(2023-2028)
 全球 ITSM 市场:趋势、预测、竞争分析(~2030 年)资讯科技服务管理市场、份额、规模、趋势、产业分析报告:按技术、按组件、按部署、按公司规模、按最终用户、按地区、按细分市场、预测,2023-2032 年
 资讯科技服务管理市场规模 - 按技术、按组件、企业规模、部署模型和预测 2023 - 2032