


 |
市场调查报告书
商品编码
1513320
食品服务设备市场:依产品、最终用途:2024-2035 年全球机会分析与产业预测Food Service Equipment Market By Product, By End Use : Global Opportunity Analysis and Industry Forecast, 2024-2035 |
||||||
价格
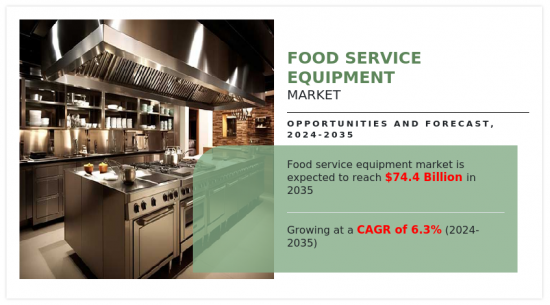
2023年,食品服务设备市场价值为358亿美元,预计2024年至2035年复合年增长率为6.3%,到2035年将达到744亿美元。
 食品服务设备除了确保商务用厨房的食品安全之外,还有助于食物准备。来自领先公司的冰箱/冷冻库、陈列架、刀叉餐具、麵包烤箱/烤箱和其他产品保证了高品质和低维护成本。此外,这些设备也是商业厨房(包括餐厅、饭店和快餐店)提供餐饮服务的必备设备。全球食品服务设备市场按产品类型、最终用户和使用区域细分。依产品类型分为烹饪设备、储存和处理设备、食品和饮料製备设备、清洗设备和服务设备。依用途分为全服务餐厅及饭店、速食服务餐厅、餐饮服务。按地区划分,我们有北美(美国、加拿大、墨西哥)、欧洲(德国、法国、英国、义大利、西班牙其他欧洲国家地区)、亚太地区(中国、印度、澳洲、日本等亚洲地区) -太平洋地区)和拉丁美洲- 在南美洲(巴西、南美洲阿联酋和其他南美国家)进行分析。此设备广泛应用于宾馆、饭店、商业场所、廉价饭店等烹饪、保存各种菜餚。商务旅行的增加以及酒店和餐厅等餐饮场所数量的增加正在推动餐旅服务业的成长,从而推动对食品服务设备的需求。对冷藏食品的需求不断增长以及对垃圾食品的偏好正在推动全球食品服务设备的采用。此外,向具有先进功能的模组化厨房的转变也推动了对烹饪食品服务设备的需求。此外,咖啡馆和餐厅数量的增加以及对多功能、节省空间和时间的设备的需求激增也推动了食品服务设备市场的成长。近年来,政府针对冷媒洩漏和排放实施了更严格的法规,随着企业用新的节能设备取代现有设备,推动市场进一步走向产品更新换代。然而,与这些设备的使用相关的高资本投资和复杂性限制了市场的成长。话虽如此,机器人等技术进步可能会在预测期内为食品服务设备市场创造新的机会。此外,供应链中断导致交货延误、成本增加、库存短缺、品管挑战和客户不满,对食品服务设备市场构成重大限制。运输延误、港口拥堵和原材料短缺可能会阻碍製造商按时履行订单的能力,导致客户不满意和收益损失。此外,与采购原材料、加急运输和替代物流解决方案相关的成本增加可能会压缩利润率并导致最终用户的价格上涨。库存短缺和品管问题可能会进一步限制产品可用性并影响设备可靠性。最终,这种破坏损害了设备製造商和供应商的声誉,并阻碍了食品服务者推出和扩展业务的能力。为了应对这些挑战,相关人员必须采取积极主动的措施,例如供应商多元化、维持安全存量基准以及投资供应链弹性技术。此外,整个供应链中的密切协作和沟通对于识别和有效解决潜在风险至关重要。对简化营运和环保实践的需求不断增长,推动了对优化能源使用、减少废弃物和提高整体生产力的创新解决方案的需求。透过将物联网 (IoT) 技术、人工智慧 (AI) 和资料分析融入食品服务设备,製造商可以提供能够实现远端监控、预测性维护和效能优化的智慧设备。例如,配备物联网感测器的智慧烤箱可以根据即时资料调整烹饪温度和时间,减少能耗,同时确保烹饪效果一致。同样,人工智慧驱动的冷却系统可以分析使用模式,以优化冷却设定并最大限度地减少食品腐败。透过以这种方式利用技术,食品服务设备製造商不仅可以满足市场不断变化的需求,还可以透过增强功能、永续性和业务效率来使他们的产品脱颖而出。这为行业的成长和创新提供了诱人的机会。
相关人员的主要利益
- 本报告定量分析了 2023 年至 2035 年食品服务设备市场分析的细分市场、当前趋势、估计和趋势以及动态,以确定通用食品服务设备市场的机会。
- 我们提供市场研究以及与市场驱动因素、市场限制和市场机会相关的资讯。
- 波特的五力分析强调了买家和供应商的潜力,使相关人员能够做出以利润为导向的商业决策并加强供应商和买家网络。
- 食品服务设备市场细分的详细分析有助于确定当前的市场机会。
- 每个地区的主要国家都根据其对全球市场的收益贡献绘製了地图。
- 市场参与者定位有助于基准化分析,并提供对市场参与者当前位置的清晰了解。
- 该报告包括对区域和全球食品服务设备市场趋势、主要企业、细分市场、应用领域和市场成长策略的分析:
- 每季更新*(仅适用于公司许可证,以标价提供)
- 在购买之前或之后免费更新您选择的 5 个额外公司简介。
- 购买 5 个用户和企业用户授权即可免费获得下一个版本。
- 16 小时分析师支援*(购买后,如果您的报表审查发现额外的资料需求,您将获得 16 小时分析师支持,以解决任何问题或售后查询)
- 15% 免费自订*(如果报告的范围或部分不符合您的要求,15% 相当于 3 个工作日的免费工作。)
- 5 个用户许可证和企业用户许可证的免费资料包。 (Excel版报告)
- 如果您的报告超过 6-12 个月,我们将免费提供更新的报告。
- 24 小时优先回应*。
- 可以自订此报告(需要额外费用和时间表,请联络您的销售负责人以了解详细资讯)
- 产品基准/产品规格及应用
- 消费者偏好和产品规格
- 按产品/细分市场分類的市场占有率分析
- 新产品开发/主要厂商产品矩阵
- 根据客户兴趣新增其他公司简介
- 按国家或地区进行的附加分析 – 市场规模和预测
- 品牌占有率分析
- 十字交叉细分市场分析—市场规模与预测
- 历史市场资料
目录
第一章简介
第 2 章执行摘要
第三章市场概况
- 市场定义和范围
- 主要发现
- 影响因素
- 主要投资机会
- 波特五力分析
- 市场动态
- 促进因素
- 抑制因素
- 机会
- 价值链分析
第四章食品服务设备市场:副产品
- 概述
- 烹饪设备
- 储存和搬运设备
- 清洗设备
- 食品和饮料烹饪设备
- 服务设备
第五章食品服务设备市场:依最终用户分类
- 概述
- 全方位服务的餐厅和饭店
- 快速服务餐厅和酒吧
- 餐饮
第六章食品服务设备市场:依地区
- 概述
- 北美洲
- 美国
- 加拿大
- 墨西哥
- 欧洲
- 德国
- 英国
- 法国
- 义大利
- 西班牙
- 其他的
- 亚太地区
- 中国
- 日本
- 印度
- 澳洲
- 其他的
- 拉丁美洲
- 巴西
- 阿根廷
- 其他拉丁美洲
- 中东/非洲
- 阿拉伯聯合大公国
- 南非
- 其他中东和非洲
第七章 竞争格局
- 介绍
- 关键成功策略
- 10家主要企业产品图谱
- 竞争对手仪表板
- 竞争热图
- 2023年主要企业定位
第八章 公司简介
- ALI GROUP SRL A SOCIO UNICO
- ALTO-SHAAM, INC
- CAMBRO MANUFACTURING CO. INC.
- COMSTOCK-CASTLE STOVE CO., INC.
- Dover Corporation
- DUKE MANUFACTURING CO. INC.
- ELECTROLUX
- ILLINOIS TOOL WORKS(ITW), INC.
- MIDDLEBY CORPORATION
- Welbilt, Inc.
Product Code: A01272
The food service equipment market was valued at $35.8 billion in 2023 and is estimated to reach $74.4 billion by 2035, growing at a CAGR of 6.3% from 2024 to 2035. Key Benefits For Stakeholders
- This report provides a quantitative analysis of the market segments, current trends, estimations, and dynamics of the food service equipment market analysis from 2023 to 2035 to identify the prevailing food service equipment market opportunities.
- The market research is offered along with information related to key drivers, restraints, and opportunities.
- Porter's five forces analysis highlights the potency of buyers and suppliers to enable stakeholders make profit-oriented business decisions and strengthen their supplier-buyer network.
- In-depth analysis of the food service equipment market segmentation assists to determine the prevailing market opportunities.
- Major countries in each region are mapped according to their revenue contribution to the global market.
- Market player positioning facilitates benchmarking and provides a clear understanding of the present position of the market players.
- The report includes the analysis of the regional as well as global food service equipment market trends, key players, market segments, application areas, and market growth strategies.Additional benefits you will get with this purchase are:
- Quarterly Update and* (only available with a corporate license, on listed price)
- 5 additional Company Profile of client Choice pre- or Post-purchase, as a free update.
- Free Upcoming Version on the Purchase of Five and Enterprise User License.
- 16 analyst hours of support* (post-purchase, if you find additional data requirements upon review of the report, you may receive support amounting to 16 analyst hours to solve questions, and post-sale queries)
- 15% Free Customization* (in case the scope or segment of the report does not match your requirements, 15% is equivalent to 3 working days of free work, applicable once)
- Free data Pack on the Five and Enterprise User License. (Excel version of the report)
- Free Updated report if the report is 6-12 months old or older.
- 24-hour priority response*
- Free Industry updates and white papers.Possible Customization with this report (with additional cost and timeline, please talk to the sales executive to know more)
- Product Benchmarking / Product specification and applications
- Consumer Preference and Product Specifications
- Market share analysis of players by products/segments
- New Product Development/ Product Matrix of Key Players
- Additional company profiles with specific to client's interest
- Additional country or region analysis- market size and forecast
- Brands Share Analysis
- Criss-cross segment analysis- market size and forecast
- Historic market data
Key Market Segments
By End Use
- Full-service Restaurants and Hotels
- Quick-service Restaurants and Pubs
- Catering
By Product
- Cooking Equipment
- Storage and Handling Equipment
- Ware washing Equipment
- Food and Beverage Preparation Equipment
- Serving Equipment
By Region
- North America
- U.S.
- Canada
- Mexico
- Europe
- Germany
- UK
- France
- Italy
- Spain
- Rest of Europe
- Asia-Pacific
- China
- Japan
- India
- Australia
- Rest of Asia-Pacific
- Latin America
- Brazil
- Argentina
- Rest of Latin America
- Middle East and Africa
- UAE
- South Africa
- Rest of Middle East And Africa
Key Market Players:
- ALI GROUP S.R.L. A SOCI
O UNICO
- ALTO-SHAAM, INC
- CAMBR
O MANUFACTURING CO. INC.
- COMSTOCK-CASTLE STOVE CO., INC.
- Dover Corporation
- DUKE MANUFACTURING CO. INC.
- ELECTROLUX
- ILLINOIS TOOL WORKS (ITW), INC.
- MIDDLEBY CORPORATION
- Welbilt, Inc.
TABLE OF CONTENTS
CHAPTER 1: INTRODUCTION
- 1.1. Report description
- 1.2. Key market segments
- 1.3. Key benefits to the stakeholders
- 1.4. Research methodology
- 1.4.1. Primary research
- 1.4.2. Secondary research
- 1.4.3. Analyst tools and models
CHAPTER 2: EXECUTIVE SUMMARY
- 2.1. CXO perspective
CHAPTER 3: MARKET OVERVIEW
- 3.1. Market definition and scope
- 3.2. Key findings
- 3.2.1. Top impacting factors
- 3.2.2. Top investment pockets
- 3.3. Porter's five forces analysis
- 3.4. Market dynamics
- 3.4.1. Drivers
- 3.4.2. Restraints
- 3.4.3. Opportunities
- 3.5. Value Chain Analysis
CHAPTER 4: FOOD SERVICE EQUIPMENT MARKET, BY PRODUCT
- 4.1. Overview
- 4.1.1. Market size and forecast
- 4.2. Cooking Equipment
- 4.2.1. Key market trends, growth factors and opportunities
- 4.2.2. Market size and forecast, by region
- 4.2.3. Market share analysis by country
- 4.3. Storage and Handling Equipment
- 4.3.1. Key market trends, growth factors and opportunities
- 4.3.2. Market size and forecast, by region
- 4.3.3. Market share analysis by country
- 4.4. Warewashing Equipment
- 4.4.1. Key market trends, growth factors and opportunities
- 4.4.2. Market size and forecast, by region
- 4.4.3. Market share analysis by country
- 4.5. Food and Beverage Preparation Equipment
- 4.5.1. Key market trends, growth factors and opportunities
- 4.5.2. Market size and forecast, by region
- 4.5.3. Market share analysis by country
- 4.6. Serving Equipment
- 4.6.1. Key market trends, growth factors and opportunities
- 4.6.2. Market size and forecast, by region
- 4.6.3. Market share analysis by country
CHAPTER 5: FOOD SERVICE EQUIPMENT MARKET, BY END USE
- 5.1. Overview
- 5.1.1. Market size and forecast
- 5.2. Full-service Restaurants and Hotels
- 5.2.1. Key market trends, growth factors and opportunities
- 5.2.2. Market size and forecast, by region
- 5.2.3. Market share analysis by country
- 5.3. Quick-service Restaurants and Pubs
- 5.3.1. Key market trends, growth factors and opportunities
- 5.3.2. Market size and forecast, by region
- 5.3.3. Market share analysis by country
- 5.4. Catering
- 5.4.1. Key market trends, growth factors and opportunities
- 5.4.2. Market size and forecast, by region
- 5.4.3. Market share analysis by country
CHAPTER 6: FOOD SERVICE EQUIPMENT MARKET, BY REGION
- 6.1. Overview
- 6.1.1. Market size and forecast By Region
- 6.2. North America
- 6.2.1. Key market trends, growth factors and opportunities
- 6.2.2. Market size and forecast, by Product
- 6.2.3. Market size and forecast, by End Use
- 6.2.4. Market size and forecast, by country
- 6.2.4.1. U.S.
- 6.2.4.1.1. Market size and forecast, by Product
- 6.2.4.1.2. Market size and forecast, by End Use
- 6.2.4.2. Canada
- 6.2.4.2.1. Market size and forecast, by Product
- 6.2.4.2.2. Market size and forecast, by End Use
- 6.2.4.3. Mexico
- 6.2.4.3.1. Market size and forecast, by Product
- 6.2.4.3.2. Market size and forecast, by End Use
- 6.3. Europe
- 6.3.1. Key market trends, growth factors and opportunities
- 6.3.2. Market size and forecast, by Product
- 6.3.3. Market size and forecast, by End Use
- 6.3.4. Market size and forecast, by country
- 6.3.4.1. Germany
- 6.3.4.1.1. Market size and forecast, by Product
- 6.3.4.1.2. Market size and forecast, by End Use
- 6.3.4.2. UK
- 6.3.4.2.1. Market size and forecast, by Product
- 6.3.4.2.2. Market size and forecast, by End Use
- 6.3.4.3. France
- 6.3.4.3.1. Market size and forecast, by Product
- 6.3.4.3.2. Market size and forecast, by End Use
- 6.3.4.4. Italy
- 6.3.4.4.1. Market size and forecast, by Product
- 6.3.4.4.2. Market size and forecast, by End Use
- 6.3.4.5. Spain
- 6.3.4.5.1. Market size and forecast, by Product
- 6.3.4.5.2. Market size and forecast, by End Use
- 6.3.4.6. Rest of Europe
- 6.3.4.6.1. Market size and forecast, by Product
- 6.3.4.6.2. Market size and forecast, by End Use
- 6.4. Asia-Pacific
- 6.4.1. Key market trends, growth factors and opportunities
- 6.4.2. Market size and forecast, by Product
- 6.4.3. Market size and forecast, by End Use
- 6.4.4. Market size and forecast, by country
- 6.4.4.1. China
- 6.4.4.1.1. Market size and forecast, by Product
- 6.4.4.1.2. Market size and forecast, by End Use
- 6.4.4.2. Japan
- 6.4.4.2.1. Market size and forecast, by Product
- 6.4.4.2.2. Market size and forecast, by End Use
- 6.4.4.3. India
- 6.4.4.3.1. Market size and forecast, by Product
- 6.4.4.3.2. Market size and forecast, by End Use
- 6.4.4.4. Australia
- 6.4.4.4.1. Market size and forecast, by Product
- 6.4.4.4.2. Market size and forecast, by End Use
- 6.4.4.5. Rest of Asia-Pacific
- 6.4.4.5.1. Market size and forecast, by Product
- 6.4.4.5.2. Market size and forecast, by End Use
- 6.5. Latin America
- 6.5.1. Key market trends, growth factors and opportunities
- 6.5.2. Market size and forecast, by Product
- 6.5.3. Market size and forecast, by End Use
- 6.5.4. Market size and forecast, by country
- 6.5.4.1. Brazil
- 6.5.4.1.1. Market size and forecast, by Product
- 6.5.4.1.2. Market size and forecast, by End Use
- 6.5.4.2. Argentina
- 6.5.4.2.1. Market size and forecast, by Product
- 6.5.4.2.2. Market size and forecast, by End Use
- 6.5.4.3. Rest of Latin America
- 6.5.4.3.1. Market size and forecast, by Product
- 6.5.4.3.2. Market size and forecast, by End Use
- 6.6. Middle East and Africa
- 6.6.1. Key market trends, growth factors and opportunities
- 6.6.2. Market size and forecast, by Product
- 6.6.3. Market size and forecast, by End Use
- 6.6.4. Market size and forecast, by country
- 6.6.4.1. UAE
- 6.6.4.1.1. Market size and forecast, by Product
- 6.6.4.1.2. Market size and forecast, by End Use
- 6.6.4.2. South Africa
- 6.6.4.2.1. Market size and forecast, by Product
- 6.6.4.2.2. Market size and forecast, by End Use
- 6.6.4.3. Rest of Middle East And Africa
- 6.6.4.3.1. Market size and forecast, by Product
- 6.6.4.3.2. Market size and forecast, by End Use
CHAPTER 7: COMPETITIVE LANDSCAPE
- 7.1. Introduction
- 7.2. Top winning strategies
- 7.3. Product mapping of top 10 player
- 7.4. Competitive dashboard
- 7.5. Competitive heatmap
- 7.6. Top player positioning, 2023
CHAPTER 8: COMPANY PROFILES
- 8.1. ALI GROUP S.R.L. A SOCIO UNICO
- 8.1.1. Company overview
- 8.1.2. Key executives
- 8.1.3. Company snapshot
- 8.1.4. Operating business segments
- 8.1.5. Product portfolio
- 8.1.6. Business performance
- 8.1.7. Key strategic moves and developments
- 8.2. ALTO-SHAAM, INC
- 8.2.1. Company overview
- 8.2.2. Key executives
- 8.2.3. Company snapshot
- 8.2.4. Operating business segments
- 8.2.5. Product portfolio
- 8.2.6. Business performance
- 8.2.7. Key strategic moves and developments
- 8.3. CAMBRO MANUFACTURING CO. INC.
- 8.3.1. Company overview
- 8.3.2. Key executives
- 8.3.3. Company snapshot
- 8.3.4. Operating business segments
- 8.3.5. Product portfolio
- 8.3.6. Business performance
- 8.3.7. Key strategic moves and developments
- 8.4. COMSTOCK-CASTLE STOVE CO., INC.
- 8.4.1. Company overview
- 8.4.2. Key executives
- 8.4.3. Company snapshot
- 8.4.4. Operating business segments
- 8.4.5. Product portfolio
- 8.4.6. Business performance
- 8.4.7. Key strategic moves and developments
- 8.5. Dover Corporation
- 8.5.1. Company overview
- 8.5.2. Key executives
- 8.5.3. Company snapshot
- 8.5.4. Operating business segments
- 8.5.5. Product portfolio
- 8.5.6. Business performance
- 8.5.7. Key strategic moves and developments
- 8.6. DUKE MANUFACTURING CO. INC.
- 8.6.1. Company overview
- 8.6.2. Key executives
- 8.6.3. Company snapshot
- 8.6.4. Operating business segments
- 8.6.5. Product portfolio
- 8.6.6. Business performance
- 8.6.7. Key strategic moves and developments
- 8.7. ELECTROLUX
- 8.7.1. Company overview
- 8.7.2. Key executives
- 8.7.3. Company snapshot
- 8.7.4. Operating business segments
- 8.7.5. Product portfolio
- 8.7.6. Business performance
- 8.7.7. Key strategic moves and developments
- 8.8. ILLINOIS TOOL WORKS (ITW), INC.
- 8.8.1. Company overview
- 8.8.2. Key executives
- 8.8.3. Company snapshot
- 8.8.4. Operating business segments
- 8.8.5. Product portfolio
- 8.8.6. Business performance
- 8.8.7. Key strategic moves and developments
- 8.9. MIDDLEBY CORPORATION
- 8.9.1. Company overview
- 8.9.2. Key executives
- 8.9.3. Company snapshot
- 8.9.4. Operating business segments
- 8.9.5. Product portfolio
- 8.9.6. Business performance
- 8.9.7. Key strategic moves and developments
- 8.10. Welbilt, Inc.
- 8.10.1. Company overview
- 8.10.2. Key executives
- 8.10.3. Company snapshot
- 8.10.4. Operating business segments
- 8.10.5. Product portfolio
- 8.10.6. Business performance
- 8.10.7. Key strategic moves and developments
LIST OF TABLES
- TABLE 01. GLOBAL FOOD SERVICE EQUIPMENT MARKET, BY PRODUCT, 2023-2035 ($MILLION)
- TABLE 02. FOOD SERVICE EQUIPMENT MARKET FOR COOKING EQUIPMENT, BY REGION, 2023-2035 ($MILLION)
- TABLE 03. FOOD SERVICE EQUIPMENT MARKET FOR STORAGE AND HANDLING EQUIPMENT, BY REGION, 2023-2035 ($MILLION)
- TABLE 04. FOOD SERVICE EQUIPMENT MARKET FOR WAREWASHING EQUIPMENT, BY REGION, 2023-2035 ($MILLION)
- TABLE 05. FOOD SERVICE EQUIPMENT MARKET FOR FOOD AND BEVERAGE PREPARATION EQUIPMENT, BY REGION, 2023-2035 ($MILLION)
- TABLE 06. FOOD SERVICE EQUIPMENT MARKET FOR SERVING EQUIPMENT, BY REGION, 2023-2035 ($MILLION)
- TABLE 07. GLOBAL FOOD SERVICE EQUIPMENT MARKET, BY END USE, 2023-2035 ($MILLION)
- TABLE 08. FOOD SERVICE EQUIPMENT MARKET FOR FULL-SERVICE RESTAURANTS AND HOTELS, BY REGION, 2023-2035 ($MILLION)
- TABLE 09. FOOD SERVICE EQUIPMENT MARKET FOR QUICK-SERVICE RESTAURANTS AND PUBS, BY REGION, 2023-2035 ($MILLION)
- TABLE 10. FOOD SERVICE EQUIPMENT MARKET FOR CATERING, BY REGION, 2023-2035 ($MILLION)
- TABLE 11. FOOD SERVICE EQUIPMENT MARKET, BY REGION, 2023-2035 ($MILLION)
- TABLE 12. NORTH AMERICA FOOD SERVICE EQUIPMENT MARKET, BY PRODUCT, 2023-2035 ($MILLION)
- TABLE 13. NORTH AMERICA FOOD SERVICE EQUIPMENT MARKET, BY END USE, 2023-2035 ($MILLION)
- TABLE 14. NORTH AMERICA FOOD SERVICE EQUIPMENT MARKET, BY COUNTRY, 2023-2035 ($MILLION)
- TABLE 15. U.S. FOOD SERVICE EQUIPMENT MARKET, BY PRODUCT, 2023-2035 ($MILLION)
- TABLE 16. U.S. FOOD SERVICE EQUIPMENT MARKET, BY END USE, 2023-2035 ($MILLION)
- TABLE 17. CANADA FOOD SERVICE EQUIPMENT MARKET, BY PRODUCT, 2023-2035 ($MILLION)
- TABLE 18. CANADA FOOD SERVICE EQUIPMENT MARKET, BY END USE, 2023-2035 ($MILLION)
- TABLE 19. MEXICO FOOD SERVICE EQUIPMENT MARKET, BY PRODUCT, 2023-2035 ($MILLION)
- TABLE 20. MEXICO FOOD SERVICE EQUIPMENT MARKET, BY END USE, 2023-2035 ($MILLION)
- TABLE 21. EUROPE FOOD SERVICE EQUIPMENT MARKET, BY PRODUCT, 2023-2035 ($MILLION)
- TABLE 22. EUROPE FOOD SERVICE EQUIPMENT MARKET, BY END USE, 2023-2035 ($MILLION)
- TABLE 23. EUROPE FOOD SERVICE EQUIPMENT MARKET, BY COUNTRY, 2023-2035 ($MILLION)
- TABLE 24. GERMANY FOOD SERVICE EQUIPMENT MARKET, BY PRODUCT, 2023-2035 ($MILLION)
- TABLE 25. GERMANY FOOD SERVICE EQUIPMENT MARKET, BY END USE, 2023-2035 ($MILLION)
- TABLE 26. UK FOOD SERVICE EQUIPMENT MARKET, BY PRODUCT, 2023-2035 ($MILLION)
- TABLE 27. UK FOOD SERVICE EQUIPMENT MARKET, BY END USE, 2023-2035 ($MILLION)
- TABLE 28. FRANCE FOOD SERVICE EQUIPMENT MARKET, BY PRODUCT, 2023-2035 ($MILLION)
- TABLE 29. FRANCE FOOD SERVICE EQUIPMENT MARKET, BY END USE, 2023-2035 ($MILLION)
- TABLE 30. ITALY FOOD SERVICE EQUIPMENT MARKET, BY PRODUCT, 2023-2035 ($MILLION)
- TABLE 31. ITALY FOOD SERVICE EQUIPMENT MARKET, BY END USE, 2023-2035 ($MILLION)
- TABLE 32. SPAIN FOOD SERVICE EQUIPMENT MARKET, BY PRODUCT, 2023-2035 ($MILLION)
- TABLE 33. SPAIN FOOD SERVICE EQUIPMENT MARKET, BY END USE, 2023-2035 ($MILLION)
- TABLE 34. REST OF EUROPE FOOD SERVICE EQUIPMENT MARKET, BY PRODUCT, 2023-2035 ($MILLION)
- TABLE 35. REST OF EUROPE FOOD SERVICE EQUIPMENT MARKET, BY END USE, 2023-2035 ($MILLION)
- TABLE 36. ASIA-PACIFIC FOOD SERVICE EQUIPMENT MARKET, BY PRODUCT, 2023-2035 ($MILLION)
- TABLE 37. ASIA-PACIFIC FOOD SERVICE EQUIPMENT MARKET, BY END USE, 2023-2035 ($MILLION)
- TABLE 38. ASIA-PACIFIC FOOD SERVICE EQUIPMENT MARKET, BY COUNTRY, 2023-2035 ($MILLION)
- TABLE 39. CHINA FOOD SERVICE EQUIPMENT MARKET, BY PRODUCT, 2023-2035 ($MILLION)
- TABLE 40. CHINA FOOD SERVICE EQUIPMENT MARKET, BY END USE, 2023-2035 ($MILLION)
- TABLE 41. JAPAN FOOD SERVICE EQUIPMENT MARKET, BY PRODUCT, 2023-2035 ($MILLION)
- TABLE 42. JAPAN FOOD SERVICE EQUIPMENT MARKET, BY END USE, 2023-2035 ($MILLION)
- TABLE 43. INDIA FOOD SERVICE EQUIPMENT MARKET, BY PRODUCT, 2023-2035 ($MILLION)
- TABLE 44. INDIA FOOD SERVICE EQUIPMENT MARKET, BY END USE, 2023-2035 ($MILLION)
- TABLE 45. AUSTRALIA FOOD SERVICE EQUIPMENT MARKET, BY PRODUCT, 2023-2035 ($MILLION)
- TABLE 46. AUSTRALIA FOOD SERVICE EQUIPMENT MARKET, BY END USE, 2023-2035 ($MILLION)
- TABLE 47. REST OF ASIA-PACIFIC FOOD SERVICE EQUIPMENT MARKET, BY PRODUCT, 2023-2035 ($MILLION)
- TABLE 48. REST OF ASIA-PACIFIC FOOD SERVICE EQUIPMENT MARKET, BY END USE, 2023-2035 ($MILLION)
- TABLE 49. LATIN AMERICA FOOD SERVICE EQUIPMENT MARKET, BY PRODUCT, 2023-2035 ($MILLION)
- TABLE 50. LATIN AMERICA FOOD SERVICE EQUIPMENT MARKET, BY END USE, 2023-2035 ($MILLION)
- TABLE 51. LATIN AMERICA FOOD SERVICE EQUIPMENT MARKET, BY COUNTRY, 2023-2035 ($MILLION)
- TABLE 52. BRAZIL FOOD SERVICE EQUIPMENT MARKET, BY PRODUCT, 2023-2035 ($MILLION)
- TABLE 53. BRAZIL FOOD SERVICE EQUIPMENT MARKET, BY END USE, 2023-2035 ($MILLION)
- TABLE 54. ARGENTINA FOOD SERVICE EQUIPMENT MARKET, BY PRODUCT, 2023-2035 ($MILLION)
- TABLE 55. ARGENTINA FOOD SERVICE EQUIPMENT MARKET, BY END USE, 2023-2035 ($MILLION)
- TABLE 56. REST OF LATIN AMERICA FOOD SERVICE EQUIPMENT MARKET, BY PRODUCT, 2023-2035 ($MILLION)
- TABLE 57. REST OF LATIN AMERICA FOOD SERVICE EQUIPMENT MARKET, BY END USE, 2023-2035 ($MILLION)
- TABLE 58. MIDDLE EAST AND AFRICA FOOD SERVICE EQUIPMENT MARKET, BY PRODUCT, 2023-2035 ($MILLION)
- TABLE 59. MIDDLE EAST AND AFRICA FOOD SERVICE EQUIPMENT MARKET, BY END USE, 2023-2035 ($MILLION)
- TABLE 60. MIDDLE EAST AND AFRICA FOOD SERVICE EQUIPMENT MARKET, BY COUNTRY, 2023-2035 ($MILLION)
- TABLE 61. UAE FOOD SERVICE EQUIPMENT MARKET, BY PRODUCT, 2023-2035 ($MILLION)
- TABLE 62. UAE FOOD SERVICE EQUIPMENT MARKET, BY END USE, 2023-2035 ($MILLION)
- TABLE 63. SOUTH AFRICA FOOD SERVICE EQUIPMENT MARKET, BY PRODUCT, 2023-2035 ($MILLION)
- TABLE 64. SOUTH AFRICA FOOD SERVICE EQUIPMENT MARKET, BY END USE, 2023-2035 ($MILLION)
- TABLE 65. REST OF MIDDLE EAST AND AFRICA FOOD SERVICE EQUIPMENT MARKET, BY PRODUCT, 2023-2035 ($MILLION)
- TABLE 66. REST OF MIDDLE EAST AND AFRICA FOOD SERVICE EQUIPMENT MARKET, BY END USE, 2023-2035 ($MILLION)
- TABLE 67. ALI GROUP S.R.L. A SOCIO UNICO: KEY EXECUTIVES
- TABLE 68. ALI GROUP S.R.L. A SOCIO UNICO: COMPANY SNAPSHOT
- TABLE 69. ALI GROUP S.R.L. A SOCIO UNICO: PRODUCT SEGMENTS
- TABLE 70. ALI GROUP S.R.L. A SOCIO UNICO: SERVICE SEGMENTS
- TABLE 71. ALI GROUP S.R.L. A SOCIO UNICO: PRODUCT PORTFOLIO
- TABLE 72. ALI GROUP S.R.L. A SOCIO UNICO: KEY STRATEGIES
- TABLE 73. ALTO-SHAAM, INC: KEY EXECUTIVES
- TABLE 74. ALTO-SHAAM, INC: COMPANY SNAPSHOT
- TABLE 75. ALTO-SHAAM, INC: PRODUCT SEGMENTS
- TABLE 76. ALTO-SHAAM, INC: SERVICE SEGMENTS
- TABLE 77. ALTO-SHAAM, INC: PRODUCT PORTFOLIO
- TABLE 78. ALTO-SHAAM, INC: KEY STRATEGIES
- TABLE 79. CAMBRO MANUFACTURING CO. INC.: KEY EXECUTIVES
- TABLE 80. CAMBRO MANUFACTURING CO. INC.: COMPANY SNAPSHOT
- TABLE 81. CAMBRO MANUFACTURING CO. INC.: PRODUCT SEGMENTS
- TABLE 82. CAMBRO MANUFACTURING CO. INC.: SERVICE SEGMENTS
- TABLE 83. CAMBRO MANUFACTURING CO. INC.: PRODUCT PORTFOLIO
- TABLE 84. CAMBRO MANUFACTURING CO. INC.: KEY STRATEGIES
- TABLE 85. COMSTOCK-CASTLE STOVE CO., INC.: KEY EXECUTIVES
- TABLE 86. COMSTOCK-CASTLE STOVE CO., INC.: COMPANY SNAPSHOT
- TABLE 87. COMSTOCK-CASTLE STOVE CO., INC.: PRODUCT SEGMENTS
- TABLE 88. COMSTOCK-CASTLE STOVE CO., INC.: SERVICE SEGMENTS
- TABLE 89. COMSTOCK-CASTLE STOVE CO., INC.: PRODUCT PORTFOLIO
- TABLE 90. COMSTOCK-CASTLE STOVE CO., INC.: KEY STRATEGIES
- TABLE 91. DOVER CORPORATION: KEY EXECUTIVES
- TABLE 92. DOVER CORPORATION: COMPANY SNAPSHOT
- TABLE 93. DOVER CORPORATION: PRODUCT SEGMENTS
- TABLE 94. DOVER CORPORATION: SERVICE SEGMENTS
- TABLE 95. DOVER CORPORATION: PRODUCT PORTFOLIO
- TABLE 96. DOVER CORPORATION: KEY STRATEGIES
- TABLE 97. DUKE MANUFACTURING CO. INC.: KEY EXECUTIVES
- TABLE 98. DUKE MANUFACTURING CO. INC.: COMPANY SNAPSHOT
- TABLE 99. DUKE MANUFACTURING CO. INC.: PRODUCT SEGMENTS
- TABLE 100. DUKE MANUFACTURING CO. INC.: SERVICE SEGMENTS
- TABLE 101. DUKE MANUFACTURING CO. INC.: PRODUCT PORTFOLIO
- TABLE 102. DUKE MANUFACTURING CO. INC.: KEY STRATEGIES
- TABLE 103. ELECTROLUX: KEY EXECUTIVES
- TABLE 104. ELECTROLUX: COMPANY SNAPSHOT
- TABLE 105. ELECTROLUX: PRODUCT SEGMENTS
- TABLE 106. ELECTROLUX: SERVICE SEGMENTS
- TABLE 107. ELECTROLUX: PRODUCT PORTFOLIO
- TABLE 108. ELECTROLUX: KEY STRATEGIES
- TABLE 109. ILLINOIS TOOL WORKS (ITW), INC.: KEY EXECUTIVES
- TABLE 110. ILLINOIS TOOL WORKS (ITW), INC.: COMPANY SNAPSHOT
- TABLE 111. ILLINOIS TOOL WORKS (ITW), INC.: PRODUCT SEGMENTS
- TABLE 112. ILLINOIS TOOL WORKS (ITW), INC.: SERVICE SEGMENTS
- TABLE 113. ILLINOIS TOOL WORKS (ITW), INC.: PRODUCT PORTFOLIO
- TABLE 114. ILLINOIS TOOL WORKS (ITW), INC.: KEY STRATEGIES
- TABLE 115. MIDDLEBY CORPORATION: KEY EXECUTIVES
- TABLE 116. MIDDLEBY CORPORATION: COMPANY SNAPSHOT
- TABLE 117. MIDDLEBY CORPORATION: PRODUCT SEGMENTS
- TABLE 118. MIDDLEBY CORPORATION: SERVICE SEGMENTS
- TABLE 119. MIDDLEBY CORPORATION: PRODUCT PORTFOLIO
- TABLE 120. MIDDLEBY CORPORATION: KEY STRATEGIES
- TABLE 121. WELBILT, INC.: KEY EXECUTIVES
- TABLE 122. WELBILT, INC.: COMPANY SNAPSHOT
- TABLE 123. WELBILT, INC.: PRODUCT SEGMENTS
- TABLE 124. WELBILT, INC.: SERVICE SEGMENTS
- TABLE 125. WELBILT, INC.: PRODUCT PORTFOLIO
- TABLE 126. WELBILT, INC.: KEY STRATEGIES
LIST OF FIGURES
- FIGURE 01. FOOD SERVICE EQUIPMENT MARKET, 2023-2035
- FIGURE 02. SEGMENTATION OF FOOD SERVICE EQUIPMENT MARKET,2023-2035
- FIGURE 03. TOP IMPACTING FACTORS IN FOOD SERVICE EQUIPMENT MARKET
- FIGURE 04. TOP INVESTMENT POCKETS IN FOOD SERVICE EQUIPMENT MARKET (2024-2035)
- FIGURE 05. BARGAINING POWER OF SUPPLIERS
- FIGURE 06. BARGAINING POWER OF BUYERS
- FIGURE 07. THREAT OF SUBSTITUTION
- FIGURE 08. THREAT OF SUBSTITUTION
- FIGURE 09. COMPETITIVE RIVALRY
- FIGURE 10. GLOBAL FOOD SERVICE EQUIPMENT MARKET:DRIVERS, RESTRAINTS AND OPPORTUNITIES
- FIGURE 11. FOOD SERVICE EQUIPMENT MARKET, BY PRODUCT, 2023 AND 2035(%)
- FIGURE 12. COMPARATIVE SHARE ANALYSIS OF FOOD SERVICE EQUIPMENT MARKET FOR COOKING EQUIPMENT, BY COUNTRY 2023 AND 2035(%)
- FIGURE 13. COMPARATIVE SHARE ANALYSIS OF FOOD SERVICE EQUIPMENT MARKET FOR STORAGE AND HANDLING EQUIPMENT, BY COUNTRY 2023 AND 2035(%)
- FIGURE 14. COMPARATIVE SHARE ANALYSIS OF FOOD SERVICE EQUIPMENT MARKET FOR WAREWASHING EQUIPMENT, BY COUNTRY 2023 AND 2035(%)
- FIGURE 15. COMPARATIVE SHARE ANALYSIS OF FOOD SERVICE EQUIPMENT MARKET FOR FOOD AND BEVERAGE PREPARATION EQUIPMENT, BY COUNTRY 2023 AND 2035(%)
- FIGURE 16. COMPARATIVE SHARE ANALYSIS OF FOOD SERVICE EQUIPMENT MARKET FOR SERVING EQUIPMENT, BY COUNTRY 2023 AND 2035(%)
- FIGURE 17. FOOD SERVICE EQUIPMENT MARKET, BY END USE, 2023 AND 2035(%)
- FIGURE 18. COMPARATIVE SHARE ANALYSIS OF FOOD SERVICE EQUIPMENT MARKET FOR FULL-SERVICE RESTAURANTS AND HOTELS, BY COUNTRY 2023 AND 2035(%)
- FIGURE 19. COMPARATIVE SHARE ANALYSIS OF FOOD SERVICE EQUIPMENT MARKET FOR QUICK-SERVICE RESTAURANTS AND PUBS, BY COUNTRY 2023 AND 2035(%)
- FIGURE 20. COMPARATIVE SHARE ANALYSIS OF FOOD SERVICE EQUIPMENT MARKET FOR CATERING, BY COUNTRY 2023 AND 2035(%)
- FIGURE 21. FOOD SERVICE EQUIPMENT MARKET BY REGION, 2023 AND 2035(%)
- FIGURE 22. U.S. FOOD SERVICE EQUIPMENT MARKET, 2023-2035 ($MILLION)
- FIGURE 23. CANADA FOOD SERVICE EQUIPMENT MARKET, 2023-2035 ($MILLION)
- FIGURE 24. MEXICO FOOD SERVICE EQUIPMENT MARKET, 2023-2035 ($MILLION)
- FIGURE 25. GERMANY FOOD SERVICE EQUIPMENT MARKET, 2023-2035 ($MILLION)
- FIGURE 26. UK FOOD SERVICE EQUIPMENT MARKET, 2023-2035 ($MILLION)
- FIGURE 27. FRANCE FOOD SERVICE EQUIPMENT MARKET, 2023-2035 ($MILLION)
- FIGURE 28. ITALY FOOD SERVICE EQUIPMENT MARKET, 2023-2035 ($MILLION)
- FIGURE 29. SPAIN FOOD SERVICE EQUIPMENT MARKET, 2023-2035 ($MILLION)
- FIGURE 30. REST OF EUROPE FOOD SERVICE EQUIPMENT MARKET, 2023-2035 ($MILLION)
- FIGURE 31. CHINA FOOD SERVICE EQUIPMENT MARKET, 2023-2035 ($MILLION)
- FIGURE 32. JAPAN FOOD SERVICE EQUIPMENT MARKET, 2023-2035 ($MILLION)
- FIGURE 33. INDIA FOOD SERVICE EQUIPMENT MARKET, 2023-2035 ($MILLION)
- FIGURE 34. AUSTRALIA FOOD SERVICE EQUIPMENT MARKET, 2023-2035 ($MILLION)
- FIGURE 35. REST OF ASIA-PACIFIC FOOD SERVICE EQUIPMENT MARKET, 2023-2035 ($MILLION)
- FIGURE 36. BRAZIL FOOD SERVICE EQUIPMENT MARKET, 2023-2035 ($MILLION)
- FIGURE 37. ARGENTINA FOOD SERVICE EQUIPMENT MARKET, 2023-2035 ($MILLION)
- FIGURE 38. REST OF LATIN AMERICA FOOD SERVICE EQUIPMENT MARKET, 2023-2035 ($MILLION)
- FIGURE 39. UAE FOOD SERVICE EQUIPMENT MARKET, 2023-2035 ($MILLION)
- FIGURE 40. SOUTH AFRICA FOOD SERVICE EQUIPMENT MARKET, 2023-2035 ($MILLION)
- FIGURE 41. REST OF MIDDLE EAST AND AFRICA FOOD SERVICE EQUIPMENT MARKET, 2023-2035 ($MILLION)
- FIGURE 42. TOP WINNING STRATEGIES, BY YEAR
- FIGURE 43. TOP WINNING STRATEGIES, BY DEVELOPMENT
- FIGURE 44. TOP WINNING STRATEGIES, BY COMPANY
- FIGURE 45. PRODUCT MAPPING OF TOP 10 PLAYERS
- FIGURE 46. COMPETITIVE DASHBOARD
- FIGURE 47. COMPETITIVE HEATMAP: FOOD SERVICE EQUIPMENT MARKET
- FIGURE 48. TOP PLAYER POSITIONING, 2023


