


 |
市场调查报告书
商品编码
1513342
逆向物流市场:依退货类型、最终用户划分:2023-2032 年全球机会分析与产业预测Reverse Logistics Market By Return Type, By End User : Global Opportunity Analysis and Industry Forecast, 2023-2032 |
||||||
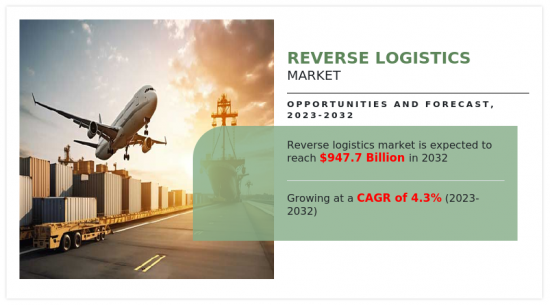
2022年全球逆向物流市场规模为6,309亿美元,预估2023年至2032年复合年增长率为4.3%,2032年达9,477亿美元。
逆向物流是管理从最终用户到分销商和製造商的货物退货的过程。管理原始产品的处置、维修和更换退货。它通常涉及商品从消费者到製造商或销售商的相反顺序的流动。
逆向物流解决方案是有效的,客户收到错误的产品、交付的产品损坏、产品品质与描述不符或客户不需要该产品,您可以将产品退回给製造商。製药、汽车、快速消费品和其他製造商正在实施逆向物流服务,以提高客户满意度并减少对环境的负面影响。
全球逆向物流市场的成长是由以下因素推动的:电子商务行业的扩张、政府对汽车行业产品质量的严格监管导致产品召回数量增加、技术主导的逆向物流服务的兴起以及快速采用将带来支持物连网的连网型设备。相反,製造商对逆向物流服务缺乏控制以及逆向物流流程的不确定性预计将阻碍市场成长。此外,透过引入区块链技术和采用多模态系统来减少损失等因素预计将创造利润丰厚的成长机会。
快速消费品、製药和其他行业的技术进步改变了全球逆向物流市场。物联网 (IoT) 解决方案在逆向物流业务中的渗透率不断提高,可以直接存取企业网络,并支援客户和承运商即时追踪货物。此外,逆向物流产业中人工智慧(AI)、机器学习、无线射频辨识(RFID)和蓝牙等最尖端科技的进步也成为市场成长的催化剂。
然而,物流领域涉及客户和产品製造商之间的货物移动。逆向物流业将退回或损坏的货物送回製造商。由于各行业全球製造商所遵循的製造技术和标准的进步,逆向物流的需求是不确定的。此外,退回的产品会增加整体生产成本并对公司的声誉产生负面影响。
逆向物流采购因产品和产业而异,这使得逆向物流服务更加复杂。例如,在电子商务领域,产品在到达客户之前要经过整个价值链。如果产品被退回,产品的价格可能会低于将产品退还给製造商的费用。因此,零售业的市场领导者采取了让顾客储存替代方案的做法,以避免逆向物流。因此,预测逆向物流流程需求的挑战是限制逆向物流市场成长的主要因素。
逆向物流市场分为退货类型、最终用户和区域。根据退货类型,市场分为召回、商业退货和 B2B 退货、可修復退货、二手退货和二手退货。依最终用户划分,市场分为电子商务、汽车、製药、消费性电子、零售、奢侈品和可重复使用包装。从区域来看,分析包括北美、欧洲、亚太地区、拉丁美洲和中东/非洲。
相关人员的主要利益
- 本报告定量分析了 2022 年至 2032 年逆向物流市场分析的细分市场、当前趋势、估计和趋势分析以及动态,以确定当前的逆向物流市场机会。
- 我们提供市场研究以及与市场驱动因素、市场限制和市场机会相关的资讯。
- 波特的五力分析强调买家和供应商帮助相关人员做出利润驱动的商业决策并加强供应商和买家网路的潜力。
- 对逆向物流市场细分的详细分析有助于识别市场机会。
- 每个地区的主要国家都根据其对全球市场的收益贡献绘製了地图。
- 市场参与者定位有助于基准化分析,并提供对市场参与者当前地位的清晰了解。
- 它包括对区域和全球逆向物流市场趋势、主要企业、细分市场、应用领域和市场成长策略的分析。
可以使用此报告进行客製化(需要额外费用和时间表)
- 按地区分類的新参与企业
- 全球/区域/国家层级参与者的市场占有率分析
- SWOT分析
目录
第一章简介
第 2 章执行摘要
第三章市场概况
- 市场定义和范围
- 主要发现
- 影响因素
- 主要投资机会
- 波特五力分析
- 市场动态
- 促进因素
- 抑制因素
- 机会
第四章逆向物流市场:依退货类型
- 概述
- 记起
- 商业回报和 B2B 回报
- 可修復退货
- 使用退货
- 使用退货
第五章逆向物流市场:依最终使用者分类
- 概述
- 电子商务
- 车
- 药品
- 家用电器
- 零售
- 奢侈品
- 可重复使用的包装
第六章逆向物流市场:依地区
- 概述
- 北美洲
- 美国
- 加拿大
- 墨西哥
- 欧洲
- 德国
- 法国
- 英国
- 西班牙
- 其他的
- 亚太地区
- 中国
- 印度
- 日本
- 韩国
- 其他的
- 拉丁美洲
- 巴西
- 阿根廷
- 其他拉丁美洲
- 中东/非洲
- 海湾合作委员会国家
- 南非
- 其他中东/非洲
第七章 竞争格局
- 介绍
- 关键成功策略
- 10家主要企业产品图谱
- 竞争对手仪表板
- 竞争热图
- 2022年主要企业定位
第八章 公司简介
- CH Robinson Worldwide, Inc.
- RLG
- Core Logistic Private Limited
- DB Schenker
- Deutsche Post AG
- FedEx
- Kintetsu World Express, Inc
- SAFEXPRESS
- United Parcel Service of America, Inc.
- YUSEN LOGISTICS CO., LTD.
The global reverse logistics market size was valued at $630.9 billion in 2022, and is projected to reach $947.7 billion by 2032, growing at a CAGR of 4.3% from 2023 to 2032.
Reverse logistics is the process of managing the return of goods from the end user back to the seller or manufacturer. It manages return of goods due to disposal, refurbishment, or replacement of the original product. It typically involves the movement of goods in reverse order from consumer to manufacturer or seller.
Reverse logistics solutions are effective, allowing customers to return products to manufacturers for a variety of reasons, such as wrong product ordered, damaged products delivered, product quality not as per the description, and non-requirement of products at the customer's end. Its services are implemented by pharmaceutical, automotive, FMCG, and other manufacturers to improve customer satisfaction and reduce adverse environmental impact.
The global reverse logistics market growth is driven by expansion of e-commerce industry, increased product recall due to stringent government rules for product quality in the automotive industry, rise of tech-driven reverse logistics services, and surge in adoption of IoT-enabled connected devices. On the contrary, lack of control of manufacturers on reverse logistics service and uncertainty in the reverse logistics process are anticipated to hinder market growth. Furthermore, factors such as introduction of blockchain technology and reduction in losses owing to adoption of a multi-modal system are anticipated to create lucrative growth opportunities.
Technological advancements in FMCG, pharmaceutical, and other industries have revolutionized the reverse logistics market globally. The increase in penetration of Internet of things (IoT) solutions in reverse logistics operations enables direct access to the company network and aids live tracking of shipments for the customers and freight companies. In addition, the evolution of state-of-the-art technologies such as artificial intelligence (AI), machine learning, radio-frequency identification (RFID), and Bluetooth in the reverse logistics industry acts as a catalyst to the growth of the market.
However, the logistics sector involves the movement of goods between the customer and the manufacturer of the product. The reverse logistics industry transfers returned or damaged items back to the manufacturer. The need for reverse logistics is uncertain due to advancements in manufacturing technologies and standards followed by global manufacturers across various industries. In addition, the returned products increase the overall cost of production and result in a negative impact on the reputation of the company.
The procurement sources in reverse logistics vary according to the product and industry, which further complicates the reverse logistics services. For instance, in the e-commerce sector, a product passes through an entire value chain before being delivered to the customer. When a product is returned, sometimes the price of the product is lower than the cost associated with returning the product back to the manufacturer. Hence, market leaders of the retail industry have adopted the practice of letting the customers keep the replacement products to avoid the cost of reverse logistics. Thus, the challenges in predicting the demand for the reverse logistics process are major factors that restrain the growth of the reverse logistics market.
The reverse logistics market is segmented into return type, end user, and region. On the basis of the return type, the market is divided into recalls, commercial returns & B2B returns, repairable returns, end-of-use returns and end-of-life returns. By end user, the market is segregated into e-commerce, automotive, pharmaceutical, consumer electronics, retail, luxury goods, and reusable packaging. By region, the market is analyzed across North America, Europe, Asia-Pacific, Latin America, the Middle East, and Africa.
The key companies profiled in the report include C.H. Robinson Worldwide, Inc., RLG, Core Logistic Private Limited, DB Schenker, Deutsche Post DHL Group, FedEx Corporation, Kintetsu World Express, Inc., Safexpress Pvt. Ltd., United Parcel Service, Inc. and Yusen Logistics Co., Ltd.
Key Benefits For Stakeholders
- This report provides a quantitative analysis of the market segments, current trends, estimations, and dynamics of the reverse logistics market analysis from 2022 to 2032 to identify the prevailing reverse logistics market opportunities.
- The market research is offered along with information related to key drivers, restraints, and opportunities.
- Porter's five forces analysis highlights the potency of buyers and suppliers to enable stakeholders make profit-oriented business decisions and strengthen their supplier-buyer network.
- In-depth analysis of the reverse logistics market segmentation assists to determine the prevailing market opportunities.
- Major countries in each region are mapped according to their revenue contribution to the global market.
- Market player positioning facilitates benchmarking and provides a clear understanding of the present position of the market players.
- The report includes the analysis of the regional as well as global reverse logistics market trends, key players, market segments, application areas, and market growth strategies.
Additional benefits you will get with this purchase are:
- Quarterly Update and* (only available with a corporate license, on listed price)
- 5 additional Company Profile of client Choice pre- or Post-purchase, as a free update.
- Free Upcoming Version on the Purchase of Five and Enterprise User License.
- 16 analyst hours of support* (post-purchase, if you find additional data requirements upon review of the report, you may receive support amounting to 16 analyst hours to solve questions, and post-sale queries)
- 15% Free Customization* (in case the scope or segment of the report does not match your requirements, 15% is equivalent to 3 working days of free work, applicable once)
- Free data Pack on the Five and Enterprise User License. (Excel version of the report)
- Free Updated report if the report is 6-12 months old or older.
- 24-hour priority response*
- Free Industry updates and white papers.
Possible Customization with this report (with additional cost and timeline, please talk to the sales executive to know more)
- Upcoming/New Entrant by Regions
- Market share analysis of players at global/region/country level
- SWOT Analysis
Key Market Segments
By Return Type
- Recalls
- Commercial returns and B2B returns
- Repairable returns
- End of use returns
- End of life returns
By End User
- Consumer electronics
- Retail
- Luxury goods
- Reusable packaging
- E-Commerce
- Automotive
- Pharmaceutical
By Region
- North America
- U.S.
- Canada
- Mexico
- Europe
- Germany
- France
- UK
- Spain
- Rest of Europe
- Asia-Pacific
- China
- India
- Japan
- South Korea
- Rest of Asia-Pacific
- Latin America
- Brazil
- Argentina
- Rest of Latin America
- Middle East and Africa
- GCC Countries
- South Africa
- Rest of Middle East And Africa
Key Market Players:
- C.H. Robinson Worldwide, Inc.
- DB Schenker
- YUSEN LOGISTICS CO., LTD.
- RLG
- Core Logistic Private Limited
- Deutsche Post AG
- FedEx
- Kintetsu World Express, Inc
- SAFEXPRESS
- United Parcel Service of America, Inc.
TABLE OF CONTENTS
CHAPTER 1: INTRODUCTION
- 1.1. Report Description
- 1.2. Key market segments
- 1.3. Key benefits to the stakeholders
- 1.4. Research methodology
- 1.4.1. Primary research
- 1.4.2. Secondary research
- 1.4.3. Analyst tools and models
CHAPTER 2: EXECUTIVE SUMMARY
- 2.1. CXO perspective
CHAPTER 3: MARKET OVERVIEW
- 3.1. Market definition and scope
- 3.2. Key findings
- 3.2.1. Top impacting factors
- 3.2.2. Top investment pockets
- 3.3. Porter's Five Forces Analysis
- 3.4. Market dynamics
- 3.4.1. Drivers
- 3.4.2. Restraints
- 3.4.3. Opportunities
CHAPTER 4: REVERSE LOGISTICS MARKET, BY RETURN TYPE
- 4.1. Overview
- 4.1.1. Market size and forecast
- 4.2. Recalls
- 4.2.1. Key market trends, growth factors and opportunities
- 4.2.2. Market size and forecast, by region
- 4.2.3. Market share analysis by country
- 4.3. Commercial returns and B2B returns
- 4.3.1. Key market trends, growth factors and opportunities
- 4.3.2. Market size and forecast, by region
- 4.3.3. Market share analysis by country
- 4.4. Repairable returns
- 4.4.1. Key market trends, growth factors and opportunities
- 4.4.2. Market size and forecast, by region
- 4.4.3. Market share analysis by country
- 4.5. End of use returns
- 4.5.1. Key market trends, growth factors and opportunities
- 4.5.2. Market size and forecast, by region
- 4.5.3. Market share analysis by country
- 4.6. End of life returns
- 4.6.1. Key market trends, growth factors and opportunities
- 4.6.2. Market size and forecast, by region
- 4.6.3. Market share analysis by country
CHAPTER 5: REVERSE LOGISTICS MARKET, BY END USER
- 5.1. Overview
- 5.1.1. Market size and forecast
- 5.2. E-Commerce
- 5.2.1. Key market trends, growth factors and opportunities
- 5.2.2. Market size and forecast, by region
- 5.2.3. Market share analysis by country
- 5.3. Automotive
- 5.3.1. Key market trends, growth factors and opportunities
- 5.3.2. Market size and forecast, by region
- 5.3.3. Market share analysis by country
- 5.4. Pharmaceutical
- 5.4.1. Key market trends, growth factors and opportunities
- 5.4.2. Market size and forecast, by region
- 5.4.3. Market share analysis by country
- 5.5. Consumer electronics
- 5.5.1. Key market trends, growth factors and opportunities
- 5.5.2. Market size and forecast, by region
- 5.5.3. Market share analysis by country
- 5.6. Retail
- 5.6.1. Key market trends, growth factors and opportunities
- 5.6.2. Market size and forecast, by region
- 5.6.3. Market share analysis by country
- 5.7. Luxury goods
- 5.7.1. Key market trends, growth factors and opportunities
- 5.7.2. Market size and forecast, by region
- 5.7.3. Market share analysis by country
- 5.8. Reusable packaging
- 5.8.1. Key market trends, growth factors and opportunities
- 5.8.2. Market size and forecast, by region
- 5.8.3. Market share analysis by country
CHAPTER 6: REVERSE LOGISTICS MARKET, BY REGION
- 6.1. Overview
- 6.1.1. Market size and forecast By Region
- 6.2. North America
- 6.2.1. Key market trends, growth factors and opportunities
- 6.2.2. Market size and forecast, by Return Type
- 6.2.3. Market size and forecast, by End User
- 6.2.4. Market size and forecast, by country
- 6.2.4.1. U.S.
- 6.2.4.1.1. Market size and forecast, by Return Type
- 6.2.4.1.2. Market size and forecast, by End User
- 6.2.4.2. Canada
- 6.2.4.2.1. Market size and forecast, by Return Type
- 6.2.4.2.2. Market size and forecast, by End User
- 6.2.4.3. Mexico
- 6.2.4.3.1. Market size and forecast, by Return Type
- 6.2.4.3.2. Market size and forecast, by End User
- 6.3. Europe
- 6.3.1. Key market trends, growth factors and opportunities
- 6.3.2. Market size and forecast, by Return Type
- 6.3.3. Market size and forecast, by End User
- 6.3.4. Market size and forecast, by country
- 6.3.4.1. Germany
- 6.3.4.1.1. Market size and forecast, by Return Type
- 6.3.4.1.2. Market size and forecast, by End User
- 6.3.4.2. France
- 6.3.4.2.1. Market size and forecast, by Return Type
- 6.3.4.2.2. Market size and forecast, by End User
- 6.3.4.3. UK
- 6.3.4.3.1. Market size and forecast, by Return Type
- 6.3.4.3.2. Market size and forecast, by End User
- 6.3.4.4. Spain
- 6.3.4.4.1. Market size and forecast, by Return Type
- 6.3.4.4.2. Market size and forecast, by End User
- 6.3.4.5. Rest of Europe
- 6.3.4.5.1. Market size and forecast, by Return Type
- 6.3.4.5.2. Market size and forecast, by End User
- 6.4. Asia-Pacific
- 6.4.1. Key market trends, growth factors and opportunities
- 6.4.2. Market size and forecast, by Return Type
- 6.4.3. Market size and forecast, by End User
- 6.4.4. Market size and forecast, by country
- 6.4.4.1. China
- 6.4.4.1.1. Market size and forecast, by Return Type
- 6.4.4.1.2. Market size and forecast, by End User
- 6.4.4.2. India
- 6.4.4.2.1. Market size and forecast, by Return Type
- 6.4.4.2.2. Market size and forecast, by End User
- 6.4.4.3. Japan
- 6.4.4.3.1. Market size and forecast, by Return Type
- 6.4.4.3.2. Market size and forecast, by End User
- 6.4.4.4. South Korea
- 6.4.4.4.1. Market size and forecast, by Return Type
- 6.4.4.4.2. Market size and forecast, by End User
- 6.4.4.5. Rest of Asia-Pacific
- 6.4.4.5.1. Market size and forecast, by Return Type
- 6.4.4.5.2. Market size and forecast, by End User
- 6.5. Latin America
- 6.5.1. Key market trends, growth factors and opportunities
- 6.5.2. Market size and forecast, by Return Type
- 6.5.3. Market size and forecast, by End User
- 6.5.4. Market size and forecast, by country
- 6.5.4.1. Brazil
- 6.5.4.1.1. Market size and forecast, by Return Type
- 6.5.4.1.2. Market size and forecast, by End User
- 6.5.4.2. Argentina
- 6.5.4.2.1. Market size and forecast, by Return Type
- 6.5.4.2.2. Market size and forecast, by End User
- 6.5.4.3. Rest of Latin America
- 6.5.4.3.1. Market size and forecast, by Return Type
- 6.5.4.3.2. Market size and forecast, by End User
- 6.6. Middle East and Africa
- 6.6.1. Key market trends, growth factors and opportunities
- 6.6.2. Market size and forecast, by Return Type
- 6.6.3. Market size and forecast, by End User
- 6.6.4. Market size and forecast, by country
- 6.6.4.1. GCC Countries
- 6.6.4.1.1. Market size and forecast, by Return Type
- 6.6.4.1.2. Market size and forecast, by End User
- 6.6.4.2. South Africa
- 6.6.4.2.1. Market size and forecast, by Return Type
- 6.6.4.2.2. Market size and forecast, by End User
- 6.6.4.3. Rest of Middle East And Africa
- 6.6.4.3.1. Market size and forecast, by Return Type
- 6.6.4.3.2. Market size and forecast, by End User
CHAPTER 7: COMPETITIVE LANDSCAPE
- 7.1. Introduction
- 7.2. Top winning strategies
- 7.3. Product mapping of top 10 player
- 7.4. Competitive dashboard
- 7.5. Competitive heatmap
- 7.6. Top player positioning, 2022
CHAPTER 8: COMPANY PROFILES
- 8.1. C.H. Robinson Worldwide, Inc.
- 8.1.1. Company overview
- 8.1.2. Key executives
- 8.1.3. Company snapshot
- 8.1.4. Operating business segments
- 8.1.5. Product portfolio
- 8.1.6. Business performance
- 8.1.7. Key strategic moves and developments
- 8.2. RLG
- 8.2.1. Company overview
- 8.2.2. Key executives
- 8.2.3. Company snapshot
- 8.2.4. Operating business segments
- 8.2.5. Product portfolio
- 8.2.6. Business performance
- 8.2.7. Key strategic moves and developments
- 8.3. Core Logistic Private Limited
- 8.3.1. Company overview
- 8.3.2. Key executives
- 8.3.3. Company snapshot
- 8.3.4. Operating business segments
- 8.3.5. Product portfolio
- 8.3.6. Business performance
- 8.3.7. Key strategic moves and developments
- 8.4. DB Schenker
- 8.4.1. Company overview
- 8.4.2. Key executives
- 8.4.3. Company snapshot
- 8.4.4. Operating business segments
- 8.4.5. Product portfolio
- 8.4.6. Business performance
- 8.4.7. Key strategic moves and developments
- 8.5. Deutsche Post AG
- 8.5.1. Company overview
- 8.5.2. Key executives
- 8.5.3. Company snapshot
- 8.5.4. Operating business segments
- 8.5.5. Product portfolio
- 8.5.6. Business performance
- 8.5.7. Key strategic moves and developments
- 8.6. FedEx
- 8.6.1. Company overview
- 8.6.2. Key executives
- 8.6.3. Company snapshot
- 8.6.4. Operating business segments
- 8.6.5. Product portfolio
- 8.6.6. Business performance
- 8.6.7. Key strategic moves and developments
- 8.7. Kintetsu World Express, Inc
- 8.7.1. Company overview
- 8.7.2. Key executives
- 8.7.3. Company snapshot
- 8.7.4. Operating business segments
- 8.7.5. Product portfolio
- 8.7.6. Business performance
- 8.7.7. Key strategic moves and developments
- 8.8. SAFEXPRESS
- 8.8.1. Company overview
- 8.8.2. Key executives
- 8.8.3. Company snapshot
- 8.8.4. Operating business segments
- 8.8.5. Product portfolio
- 8.8.6. Business performance
- 8.8.7. Key strategic moves and developments
- 8.9. United Parcel Service of America, Inc.
- 8.9.1. Company overview
- 8.9.2. Key executives
- 8.9.3. Company snapshot
- 8.9.4. Operating business segments
- 8.9.5. Product portfolio
- 8.9.6. Business performance
- 8.9.7. Key strategic moves and developments
- 8.10. YUSEN LOGISTICS CO., LTD.
- 8.10.1. Company overview
- 8.10.2. Key executives
- 8.10.3. Company snapshot
- 8.10.4. Operating business segments
- 8.10.5. Product portfolio
- 8.10.6. Business performance
- 8.10.7. Key strategic moves and developments
LIST OF TABLES
- TABLE 01. GLOBAL REVERSE LOGISTICS MARKET, BY RETURN TYPE, 2022-2032 ($BILLION)
- TABLE 02. REVERSE LOGISTICS MARKET FOR RECALLS, BY REGION, 2022-2032 ($BILLION)
- TABLE 03. REVERSE LOGISTICS MARKET FOR COMMERCIAL RETURNS AND B2B RETURNS, BY REGION, 2022-2032 ($BILLION)
- TABLE 04. REVERSE LOGISTICS MARKET FOR REPAIRABLE RETURNS, BY REGION, 2022-2032 ($BILLION)
- TABLE 05. REVERSE LOGISTICS MARKET FOR END OF USE RETURNS, BY REGION, 2022-2032 ($BILLION)
- TABLE 06. REVERSE LOGISTICS MARKET FOR END OF LIFE RETURNS, BY REGION, 2022-2032 ($BILLION)
- TABLE 07. GLOBAL REVERSE LOGISTICS MARKET, BY END USER, 2022-2032 ($BILLION)
- TABLE 08. REVERSE LOGISTICS MARKET FOR E-COMMERCE, BY REGION, 2022-2032 ($BILLION)
- TABLE 09. REVERSE LOGISTICS MARKET FOR AUTOMOTIVE, BY REGION, 2022-2032 ($BILLION)
- TABLE 10. REVERSE LOGISTICS MARKET FOR PHARMACEUTICAL, BY REGION, 2022-2032 ($BILLION)
- TABLE 11. REVERSE LOGISTICS MARKET FOR CONSUMER ELECTRONICS, BY REGION, 2022-2032 ($BILLION)
- TABLE 12. REVERSE LOGISTICS MARKET FOR RETAIL, BY REGION, 2022-2032 ($BILLION)
- TABLE 13. REVERSE LOGISTICS MARKET FOR LUXURY GOODS, BY REGION, 2022-2032 ($BILLION)
- TABLE 14. REVERSE LOGISTICS MARKET FOR REUSABLE PACKAGING, BY REGION, 2022-2032 ($BILLION)
- TABLE 15. REVERSE LOGISTICS MARKET, BY REGION, 2022-2032 ($BILLION)
- TABLE 16. NORTH AMERICA REVERSE LOGISTICS MARKET, BY RETURN TYPE, 2022-2032 ($BILLION)
- TABLE 17. NORTH AMERICA REVERSE LOGISTICS MARKET, BY END USER, 2022-2032 ($BILLION)
- TABLE 18. NORTH AMERICA REVERSE LOGISTICS MARKET, BY COUNTRY, 2022-2032 ($BILLION)
- TABLE 19. U.S. REVERSE LOGISTICS MARKET, BY RETURN TYPE, 2022-2032 ($BILLION)
- TABLE 20. U.S. REVERSE LOGISTICS MARKET, BY END USER, 2022-2032 ($BILLION)
- TABLE 21. CANADA REVERSE LOGISTICS MARKET, BY RETURN TYPE, 2022-2032 ($BILLION)
- TABLE 22. CANADA REVERSE LOGISTICS MARKET, BY END USER, 2022-2032 ($BILLION)
- TABLE 23. MEXICO REVERSE LOGISTICS MARKET, BY RETURN TYPE, 2022-2032 ($BILLION)
- TABLE 24. MEXICO REVERSE LOGISTICS MARKET, BY END USER, 2022-2032 ($BILLION)
- TABLE 25. EUROPE REVERSE LOGISTICS MARKET, BY RETURN TYPE, 2022-2032 ($BILLION)
- TABLE 26. EUROPE REVERSE LOGISTICS MARKET, BY END USER, 2022-2032 ($BILLION)
- TABLE 27. EUROPE REVERSE LOGISTICS MARKET, BY COUNTRY, 2022-2032 ($BILLION)
- TABLE 28. GERMANY REVERSE LOGISTICS MARKET, BY RETURN TYPE, 2022-2032 ($BILLION)
- TABLE 29. GERMANY REVERSE LOGISTICS MARKET, BY END USER, 2022-2032 ($BILLION)
- TABLE 30. FRANCE REVERSE LOGISTICS MARKET, BY RETURN TYPE, 2022-2032 ($BILLION)
- TABLE 31. FRANCE REVERSE LOGISTICS MARKET, BY END USER, 2022-2032 ($BILLION)
- TABLE 32. UK REVERSE LOGISTICS MARKET, BY RETURN TYPE, 2022-2032 ($BILLION)
- TABLE 33. UK REVERSE LOGISTICS MARKET, BY END USER, 2022-2032 ($BILLION)
- TABLE 34. SPAIN REVERSE LOGISTICS MARKET, BY RETURN TYPE, 2022-2032 ($BILLION)
- TABLE 35. SPAIN REVERSE LOGISTICS MARKET, BY END USER, 2022-2032 ($BILLION)
- TABLE 36. REST OF EUROPE REVERSE LOGISTICS MARKET, BY RETURN TYPE, 2022-2032 ($BILLION)
- TABLE 37. REST OF EUROPE REVERSE LOGISTICS MARKET, BY END USER, 2022-2032 ($BILLION)
- TABLE 38. ASIA-PACIFIC REVERSE LOGISTICS MARKET, BY RETURN TYPE, 2022-2032 ($BILLION)
- TABLE 39. ASIA-PACIFIC REVERSE LOGISTICS MARKET, BY END USER, 2022-2032 ($BILLION)
- TABLE 40. ASIA-PACIFIC REVERSE LOGISTICS MARKET, BY COUNTRY, 2022-2032 ($BILLION)
- TABLE 41. CHINA REVERSE LOGISTICS MARKET, BY RETURN TYPE, 2022-2032 ($BILLION)
- TABLE 42. CHINA REVERSE LOGISTICS MARKET, BY END USER, 2022-2032 ($BILLION)
- TABLE 43. INDIA REVERSE LOGISTICS MARKET, BY RETURN TYPE, 2022-2032 ($BILLION)
- TABLE 44. INDIA REVERSE LOGISTICS MARKET, BY END USER, 2022-2032 ($BILLION)
- TABLE 45. JAPAN REVERSE LOGISTICS MARKET, BY RETURN TYPE, 2022-2032 ($BILLION)
- TABLE 46. JAPAN REVERSE LOGISTICS MARKET, BY END USER, 2022-2032 ($BILLION)
- TABLE 47. SOUTH KOREA REVERSE LOGISTICS MARKET, BY RETURN TYPE, 2022-2032 ($BILLION)
- TABLE 48. SOUTH KOREA REVERSE LOGISTICS MARKET, BY END USER, 2022-2032 ($BILLION)
- TABLE 49. REST OF ASIA-PACIFIC REVERSE LOGISTICS MARKET, BY RETURN TYPE, 2022-2032 ($BILLION)
- TABLE 50. REST OF ASIA-PACIFIC REVERSE LOGISTICS MARKET, BY END USER, 2022-2032 ($BILLION)
- TABLE 51. LATIN AMERICA REVERSE LOGISTICS MARKET, BY RETURN TYPE, 2022-2032 ($BILLION)
- TABLE 52. LATIN AMERICA REVERSE LOGISTICS MARKET, BY END USER, 2022-2032 ($BILLION)
- TABLE 53. LATIN AMERICA REVERSE LOGISTICS MARKET, BY COUNTRY, 2022-2032 ($BILLION)
- TABLE 54. BRAZIL REVERSE LOGISTICS MARKET, BY RETURN TYPE, 2022-2032 ($BILLION)
- TABLE 55. BRAZIL REVERSE LOGISTICS MARKET, BY END USER, 2022-2032 ($BILLION)
- TABLE 56. ARGENTINA REVERSE LOGISTICS MARKET, BY RETURN TYPE, 2022-2032 ($BILLION)
- TABLE 57. ARGENTINA REVERSE LOGISTICS MARKET, BY END USER, 2022-2032 ($BILLION)
- TABLE 58. REST OF LATIN AMERICA REVERSE LOGISTICS MARKET, BY RETURN TYPE, 2022-2032 ($BILLION)
- TABLE 59. REST OF LATIN AMERICA REVERSE LOGISTICS MARKET, BY END USER, 2022-2032 ($BILLION)
- TABLE 60. MIDDLE EAST AND AFRICA REVERSE LOGISTICS MARKET, BY RETURN TYPE, 2022-2032 ($BILLION)
- TABLE 61. MIDDLE EAST AND AFRICA REVERSE LOGISTICS MARKET, BY END USER, 2022-2032 ($BILLION)
- TABLE 62. MIDDLE EAST AND AFRICA REVERSE LOGISTICS MARKET, BY COUNTRY, 2022-2032 ($BILLION)
- TABLE 63. GCC COUNTRIES REVERSE LOGISTICS MARKET, BY RETURN TYPE, 2022-2032 ($BILLION)
- TABLE 64. GCC COUNTRIES REVERSE LOGISTICS MARKET, BY END USER, 2022-2032 ($BILLION)
- TABLE 65. SOUTH AFRICA REVERSE LOGISTICS MARKET, BY RETURN TYPE, 2022-2032 ($BILLION)
- TABLE 66. SOUTH AFRICA REVERSE LOGISTICS MARKET, BY END USER, 2022-2032 ($BILLION)
- TABLE 67. REST OF MIDDLE EAST AND AFRICA REVERSE LOGISTICS MARKET, BY RETURN TYPE, 2022-2032 ($BILLION)
- TABLE 68. REST OF MIDDLE EAST AND AFRICA REVERSE LOGISTICS MARKET, BY END USER, 2022-2032 ($BILLION)
- TABLE 69. C.H. ROBINSON WORLDWIDE, INC.: KEY EXECUTIVES
- TABLE 70. C.H. ROBINSON WORLDWIDE, INC.: COMPANY SNAPSHOT
- TABLE 71. C.H. ROBINSON WORLDWIDE, INC.: PRODUCT SEGMENTS
- TABLE 72. C.H. ROBINSON WORLDWIDE, INC.: SERVICE SEGMENTS
- TABLE 73. C.H. ROBINSON WORLDWIDE, INC.: PRODUCT PORTFOLIO
- TABLE 74. C.H. ROBINSON WORLDWIDE, INC.: KEY STRATEGIES
- TABLE 75. REVERSE LOGISTICS GMBH: KEY EXECUTIVES
- TABLE 76. REVERSE LOGISTICS GMBH: COMPANY SNAPSHOT
- TABLE 77. REVERSE LOGISTICS GMBH: PRODUCT SEGMENTS
- TABLE 78. REVERSE LOGISTICS GMBH: SERVICE SEGMENTS
- TABLE 79. REVERSE LOGISTICS GMBH: PRODUCT PORTFOLIO
- TABLE 80. REVERSE LOGISTICS GMBH: KEY STRATEGIES
- TABLE 81. CORE LOGISTIC PRIVATE LIMITED: KEY EXECUTIVES
- TABLE 82. CORE LOGISTIC PRIVATE LIMITED: COMPANY SNAPSHOT
- TABLE 83. CORE LOGISTIC PRIVATE LIMITED: PRODUCT SEGMENTS
- TABLE 84. CORE LOGISTIC PRIVATE LIMITED: SERVICE SEGMENTS
- TABLE 85. CORE LOGISTIC PRIVATE LIMITED: PRODUCT PORTFOLIO
- TABLE 86. CORE LOGISTIC PRIVATE LIMITED: KEY STRATEGIES
- TABLE 87. DB SCHENKER: KEY EXECUTIVES
- TABLE 88. DB SCHENKER: COMPANY SNAPSHOT
- TABLE 89. DB SCHENKER: PRODUCT SEGMENTS
- TABLE 90. DB SCHENKER: SERVICE SEGMENTS
- TABLE 91. DB SCHENKER: PRODUCT PORTFOLIO
- TABLE 92. DB SCHENKER: KEY STRATEGIES
- TABLE 93. DEUTSCHE POST DHL GROUP.: KEY EXECUTIVES
- TABLE 94. DEUTSCHE POST DHL GROUP.: COMPANY SNAPSHOT
- TABLE 95. DEUTSCHE POST DHL GROUP.: PRODUCT SEGMENTS
- TABLE 96. DEUTSCHE POST DHL GROUP.: SERVICE SEGMENTS
- TABLE 97. DEUTSCHE POST DHL GROUP.: PRODUCT PORTFOLIO
- TABLE 98. DEUTSCHE POST DHL GROUP.: KEY STRATEGIES
- TABLE 99. FEDEX CORPORATION: KEY EXECUTIVES
- TABLE 100. FEDEX CORPORATION: COMPANY SNAPSHOT
- TABLE 101. FEDEX CORPORATION: PRODUCT SEGMENTS
- TABLE 102. FEDEX CORPORATION: SERVICE SEGMENTS
- TABLE 103. FEDEX CORPORATION: PRODUCT PORTFOLIO
- TABLE 104. FEDEX CORPORATION: KEY STRATEGIES
- TABLE 105. KINTETSU WORLD EXPRESS, INC.: KEY EXECUTIVES
- TABLE 106. KINTETSU WORLD EXPRESS, INC.: COMPANY SNAPSHOT
- TABLE 107. KINTETSU WORLD EXPRESS, INC.: PRODUCT SEGMENTS
- TABLE 108. KINTETSU WORLD EXPRESS, INC.: SERVICE SEGMENTS
- TABLE 109. KINTETSU WORLD EXPRESS, INC.: PRODUCT PORTFOLIO
- TABLE 110. KINTETSU WORLD EXPRESS, INC.: KEY STRATEGIES
- TABLE 111. SAFEXPRESS PVT. LTD.: KEY EXECUTIVES
- TABLE 112. SAFEXPRESS PVT. LTD.: COMPANY SNAPSHOT
- TABLE 113. SAFEXPRESS PVT. LTD.: PRODUCT SEGMENTS
- TABLE 114. SAFEXPRESS PVT. LTD.: SERVICE SEGMENTS
- TABLE 115. SAFEXPRESS PVT. LTD.: PRODUCT PORTFOLIO
- TABLE 116. SAFEXPRESS PVT. LTD.: KEY STRATEGIES
- TABLE 117. UNITED PARCEL SERVICE, INC.: KEY EXECUTIVES
- TABLE 118. UNITED PARCEL SERVICE, INC.: COMPANY SNAPSHOT
- TABLE 119. UNITED PARCEL SERVICE, INC.: PRODUCT SEGMENTS
- TABLE 120. UNITED PARCEL SERVICE, INC.: SERVICE SEGMENTS
- TABLE 121. UNITED PARCEL SERVICE, INC.: PRODUCT PORTFOLIO
- TABLE 122. UNITED PARCEL SERVICE, INC.: KEY STRATEGIES
- TABLE 123. YUSEN LOGISTICS CO., LTD.: KEY EXECUTIVES
- TABLE 124. YUSEN LOGISTICS CO., LTD.: COMPANY SNAPSHOT
- TABLE 125. YUSEN LOGISTICS CO., LTD.: PRODUCT SEGMENTS
- TABLE 126. YUSEN LOGISTICS CO., LTD.: SERVICE SEGMENTS
- TABLE 127. YUSEN LOGISTICS CO., LTD.: PRODUCT PORTFOLIO
- TABLE 128. YUSEN LOGISTICS CO., LTD.: KEY STRATEGIES
LIST OF FIGURES
- FIGURE 01. REVERSE LOGISTICS MARKET, 2022-2032
- FIGURE 02. SEGMENTATION OF REVERSE LOGISTICS MARKET,2022-2032
- FIGURE 03. TOP IMPACTING FACTORS IN REVERSE LOGISTICS MARKET
- FIGURE 04. TOP INVESTMENT POCKETS IN REVERSE LOGISTICS MARKET (2023-2032)
- FIGURE 05. BARGAINING POWER OF SUPPLIERS
- FIGURE 06. BARGAINING POWER OF BUYERS
- FIGURE 07. THREAT OF SUBSTITUTION
- FIGURE 08. THREAT OF SUBSTITUTION
- FIGURE 09. COMPETITIVE RIVALRY
- FIGURE 10. GLOBAL REVERSE LOGISTICS MARKET:DRIVERS, RESTRAINTS AND OPPORTUNITIES
- FIGURE 11. REVERSE LOGISTICS MARKET, BY RETURN TYPE, 2022 AND 2032(%)
- FIGURE 12. COMPARATIVE SHARE ANALYSIS OF REVERSE LOGISTICS MARKET FOR RECALLS, BY COUNTRY 2022 AND 2032(%)
- FIGURE 13. COMPARATIVE SHARE ANALYSIS OF REVERSE LOGISTICS MARKET FOR COMMERCIAL RETURNS AND B2B RETURNS, BY COUNTRY 2022 AND 2032(%)
- FIGURE 14. COMPARATIVE SHARE ANALYSIS OF REVERSE LOGISTICS MARKET FOR REPAIRABLE RETURNS, BY COUNTRY 2022 AND 2032(%)
- FIGURE 15. COMPARATIVE SHARE ANALYSIS OF REVERSE LOGISTICS MARKET FOR END OF USE RETURNS, BY COUNTRY 2022 AND 2032(%)
- FIGURE 16. COMPARATIVE SHARE ANALYSIS OF REVERSE LOGISTICS MARKET FOR END OF LIFE RETURNS, BY COUNTRY 2022 AND 2032(%)
- FIGURE 17. REVERSE LOGISTICS MARKET, BY END USER, 2022 AND 2032(%)
- FIGURE 18. COMPARATIVE SHARE ANALYSIS OF REVERSE LOGISTICS MARKET FOR E-COMMERCE, BY COUNTRY 2022 AND 2032(%)
- FIGURE 19. COMPARATIVE SHARE ANALYSIS OF REVERSE LOGISTICS MARKET FOR AUTOMOTIVE, BY COUNTRY 2022 AND 2032(%)
- FIGURE 20. COMPARATIVE SHARE ANALYSIS OF REVERSE LOGISTICS MARKET FOR PHARMACEUTICAL, BY COUNTRY 2022 AND 2032(%)
- FIGURE 21. COMPARATIVE SHARE ANALYSIS OF REVERSE LOGISTICS MARKET FOR CONSUMER ELECTRONICS, BY COUNTRY 2022 AND 2032(%)
- FIGURE 22. COMPARATIVE SHARE ANALYSIS OF REVERSE LOGISTICS MARKET FOR RETAIL, BY COUNTRY 2022 AND 2032(%)
- FIGURE 23. COMPARATIVE SHARE ANALYSIS OF REVERSE LOGISTICS MARKET FOR LUXURY GOODS, BY COUNTRY 2022 AND 2032(%)
- FIGURE 24. COMPARATIVE SHARE ANALYSIS OF REVERSE LOGISTICS MARKET FOR REUSABLE PACKAGING, BY COUNTRY 2022 AND 2032(%)
- FIGURE 25. REVERSE LOGISTICS MARKET BY REGION, 2022 AND 2032(%)
- FIGURE 26. U.S. REVERSE LOGISTICS MARKET, 2022-2032 ($BILLION)
- FIGURE 27. CANADA REVERSE LOGISTICS MARKET, 2022-2032 ($BILLION)
- FIGURE 28. MEXICO REVERSE LOGISTICS MARKET, 2022-2032 ($BILLION)
- FIGURE 29. GERMANY REVERSE LOGISTICS MARKET, 2022-2032 ($BILLION)
- FIGURE 30. FRANCE REVERSE LOGISTICS MARKET, 2022-2032 ($BILLION)
- FIGURE 31. UK REVERSE LOGISTICS MARKET, 2022-2032 ($BILLION)
- FIGURE 32. SPAIN REVERSE LOGISTICS MARKET, 2022-2032 ($BILLION)
- FIGURE 33. REST OF EUROPE REVERSE LOGISTICS MARKET, 2022-2032 ($BILLION)
- FIGURE 34. CHINA REVERSE LOGISTICS MARKET, 2022-2032 ($BILLION)
- FIGURE 35. INDIA REVERSE LOGISTICS MARKET, 2022-2032 ($BILLION)
- FIGURE 36. JAPAN REVERSE LOGISTICS MARKET, 2022-2032 ($BILLION)
- FIGURE 37. SOUTH KOREA REVERSE LOGISTICS MARKET, 2022-2032 ($BILLION)
- FIGURE 38. REST OF ASIA-PACIFIC REVERSE LOGISTICS MARKET, 2022-2032 ($BILLION)
- FIGURE 39. BRAZIL REVERSE LOGISTICS MARKET, 2022-2032 ($BILLION)
- FIGURE 40. ARGENTINA REVERSE LOGISTICS MARKET, 2022-2032 ($BILLION)
- FIGURE 41. REST OF LATIN AMERICA REVERSE LOGISTICS MARKET, 2022-2032 ($BILLION)
- FIGURE 42. GCC COUNTRIES REVERSE LOGISTICS MARKET, 2022-2032 ($BILLION)
- FIGURE 43. SOUTH AFRICA REVERSE LOGISTICS MARKET, 2022-2032 ($BILLION)
- FIGURE 44. REST OF MIDDLE EAST AND AFRICA REVERSE LOGISTICS MARKET, 2022-2032 ($BILLION)
- FIGURE 45. TOP WINNING STRATEGIES, BY YEAR (2022-2023)
- FIGURE 46. TOP WINNING STRATEGIES, BY DEVELOPMENT (2022-2023)
- FIGURE 47. TOP WINNING STRATEGIES, BY COMPANY (2022-2023)
- FIGURE 48. PRODUCT MAPPING OF TOP 10 PLAYERS
- FIGURE 49. COMPETITIVE DASHBOARD
- FIGURE 50. COMPETITIVE HEATMAP: REVERSE LOGISTICS MARKET
- FIGURE 51. TOP PLAYER POSITIONING, 2022
 日本逆向物流市场报告(依退货类型、服务、最终用户和地区划分)2025-20332025 年至 2033 年逆向物流市场报告(依退货类型、服务、最终用户和地区)
 美国逆向物流市场:市场占有率分析、产业趋势与成长预测(2025-2030 年)
 2025年逆向物流全球市场报告
 逆向物流市场规模、份额和成长分析(按退货类型、服务、最终用户产业和地区)- 产业预测 2025-2032
 逆向物流市场分析及预测至 2033 年:依类型、产品、服务、技术、应用、流程、部署、最终使用者及解决方案逆向物流市场机会、成长动力、产业趋势分析与 2025 - 2034 年预测
 逆向物流的全球市场的评估:各退货类型,各类服务,各终端用户,各地区,机会,预测(2017年~2031年)
 全球逆向物流市场规模研究(按退货类型、最终用户和 2022-2032 年区域预测)
 全球逆向物流市场:市场规模和占有率分析(依退货类型、最终用户和服务)、工业需求预测(截至2030年)