


 |
市场调查报告书
商品编码
1666642
水电市场机会、成长动力、产业趋势分析及 2025 - 2034 年预测Hydropower Market Opportunity, Growth Drivers, Industry Trend Analysis, and Forecast 2025 - 2034 |
||||||
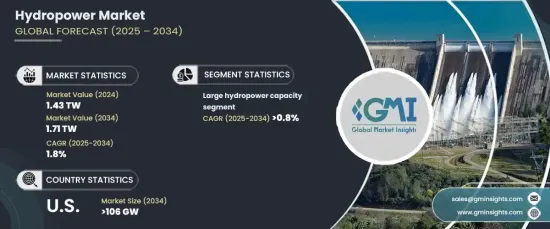
2024 年全球水力发电市场价值为 1.43 TW,预计 2025 年至 2034 年期间的复合年增长率为 1.8%,这得益于全球日益转向再生能源以实现永续发展目标。水力发电因其能够产生清洁、稳定的电力而持续受到青睐。
技术进步正在重塑水力发电格局、提高效率并降低营运成本。涡轮机设计、数位自动化和先进监控系统的创新正在优化能量输出并提高工厂的可靠性。人工智慧和机器学习的融合可以实现更智慧的操作,确保精确控制并最大限度地减少停机时间。此外,抽水蓄能係统的日益普及也提升了水力发电在能源储存和电网稳定方面的重要性,并对风能和太阳能等间歇性再生能源进行了补充。
根据容量,市场分为微型、微型和微型微型、小型和大型水力发电系统。其中,大型水力发电领域到2034年的复合年增长率将达到0.8%。技术进步提高了涡轮机的效率,而环境考量则推动了该领域采用更永续的做法和环保技术。
受再生能源需求成长和政府减少碳排放政策的推动,美国水力发电市场预计到 2034 年将达到 106 吉瓦。水力发电在该国能源结构中发挥着至关重要的作用,提供可靠且稳定的电力供应。虽然大型专案占据了市场主导地位,但人们对小型和微型水力发电系统的兴趣日益浓厚,特别是在分散式发电越来越可行的农村和偏远地区。
水力发电产业的稳定成长反映了其应对现代能源挑战的能力,例如减少温室气体排放和确保电网弹性。随着技术的不断进步和能源储存应用的不断扩大,水力发电在未来几十年内仍将在全球再生能源结构中扮演重要角色。
目录
第 1 章:方法论与范围
- 市场定义
- 基础估算与计算
- 预测计算
- 资料来源
- 基本的
- 次要
- 有薪资的
- 民众
第 2 章:执行摘要
第 3 章:产业洞察
- 产业生态系统分析
- 监管格局
- 产业衝击力
- 成长动力
- 产业陷阱与挑战
- 成长潜力分析
- 波特的分析
- 供应商的议价能力
- 买家的议价能力
- 新进入者的威胁
- 替代品的威胁
- PESTEL 分析
第四章:竞争格局
- 战略仪表板
- 创新与永续发展格局
第五章:市场规模及预测:依产能,2021 – 2034 年
- 主要趋势
- 小型的
- 微型和微微型
- 小的
- 大的
第六章:市场规模及预测:按地区,2021 – 2034 年
- 主要趋势
- 北美洲
- 我们
- 加拿大
- 墨西哥
- 欧洲
- 英国
- 法国
- 德国
- 义大利
- 俄罗斯
- 西班牙
- 亚太地区
- 中国
- 澳洲
- 印度
- 日本
- 世界其他地区
- 巴西
- 伊朗
第七章:公司简介
- ABB
- Agder Energy
- Alfa Laval
- Andritz Hydro
- China Three Gorges
- China Yangtze Power
- Duke Energy
- General Electric
- Georgia Power
- Hydro-Quebec
- Metso
- Ontario Power Generation
- RusHydro
- Statkraft
- Voith
The Global Hydropower Market was valued at 1.43 TW in 2024 and is projected to grow at a CAGR of 1.8% between 2025 and 2034, fueled by the increasing global shift toward renewable energy to meet sustainability goals. Hydropower continues to gain traction for its ability to produce clean and consistent electricity.
Technological advancements are reshaping the hydropower landscape, enhancing efficiency, and reducing operational costs. Innovations in turbine design, digital automation, and advanced monitoring systems are optimizing energy output and improving plant reliability. The integration of artificial intelligence and machine learning enables smarter operations, ensuring precise control and minimizing downtime. Furthermore, the rising adoption of pumped storage systems is boosting hydropower's significance in energy storage and grid stabilization, complementing intermittent renewable sources like wind and solar.
The market is categorized by capacity into mini, micro & pico, small, and large hydropower systems. Among these, the large hydropower segment is set to grow at a CAGR of 0.8% through 2034. Large-scale projects, often involving extensive dam and reservoir construction, remain a cornerstone for achieving renewable energy targets and maintaining grid stability. Technological advancements drive greater turbine efficiency, while environmental considerations push the adoption of more sustainable practices and eco-friendly technologies within this segment.
The U.S. hydropower market is anticipated to achieve 106 GW by 2034, driven by increased demand for renewable energy and government policies to reduce carbon emissions. Hydropower plays a vital role in the country's energy portfolio, offering a dependable and stable electricity supply. While large-scale projects dominate the market, there is a growing interest in small and micro-hydropower systems, particularly in rural and remote areas where distributed generation is becoming more viable.
The hydropower sector's steady growth reflects its ability to address modern energy challenges, such as reducing greenhouse gas emissions and ensuring grid resilience. With ongoing technological advancements and expanding applications in energy storage, hydropower is well-positioned to remain a key player in the global renewable energy mix for decades to come.
Table of Contents
Chapter 1 Methodology & Scope
- 1.1 Market definitions
- 1.2 Base estimates & calculations
- 1.3 Forecast calculation
- 1.4 Data sources
- 1.4.1 Primary
- 1.4.2 Secondary
- 1.4.2.1 Paid
- 1.4.2.2 Public
Chapter 2 Executive Summary
- 2.1 Industry synopsis, 2021 – 2034
Chapter 3 Industry Insights
- 3.1 Industry ecosystem analysis
- 3.2 Regulatory landscape
- 3.3 Industry impact forces
- 3.3.1 Growth drivers
- 3.3.2 Industry pitfalls & challenges
- 3.4 Growth potential analysis
- 3.5 Porter's analysis
- 3.5.1 Bargaining power of suppliers
- 3.5.2 Bargaining power of buyers
- 3.5.3 Threat of new entrants
- 3.5.4 Threat of substitutes
- 3.6 PESTEL analysis
Chapter 4 Competitive landscape, 2024
- 4.1 Strategic dashboard
- 4.2 Innovation & sustainability landscape
Chapter 5 Market Size and Forecast, By Capacity, 2021 – 2034 (GW)
- 5.1 Key trends
- 5.2 Mini
- 5.3 Micro & pico
- 5.4 Small
- 5.5 Large
Chapter 6 Market Size and Forecast, By Region, 2021 – 2034 (GW)
- 6.1 Key trends
- 6.2 North America
- 6.2.1 U.S.
- 6.2.2 Canada
- 6.2.3 Mexico
- 6.3 Europe
- 6.3.1 UK
- 6.3.2 France
- 6.3.3 Germany
- 6.3.4 Italy
- 6.3.5 Russia
- 6.3.6 Spain
- 6.4 Asia Pacific
- 6.4.1 China
- 6.4.2 Australia
- 6.4.3 India
- 6.4.4 Japan
- 6.5 Rest of World
- 6.5.1 Brazil
- 6.5.2 Iran
Chapter 7 Company Profiles
- 7.1 ABB
- 7.2 Agder Energy
- 7.3 Alfa Laval
- 7.4 Andritz Hydro
- 7.5 China Three Gorges
- 7.6 China Yangtze Power
- 7.7 Duke Energy
- 7.8 General Electric
- 7.9 Georgia Power
- 7.10 Hydro-Quebec
- 7.11 Metso
- 7.12 Ontario Power Generation
- 7.13 RusHydro
- 7.14 Statkraft
- 7.15 Voith
 2025年全球水力发电市场报告
 全球离岸水电市场
 水电市场规模、份额及成长分析(按类型、容量、组件、最终用户和地区)-产业预测,2025-2032水电市场规模、份额、趋势分析报告:按组件、容量、地区、细分市场预测,2025-2030 年
 日本水力发电市场报告(按规模划分,大型水力发电(大于 100 兆瓦)、小型水力发电(小于 10 兆瓦)及其他)、应用(工业、住宅、商业)和地区,2025 年至 2033 年
 水力发电市场-全球产业规模、份额、趋势、机会及预测(按容量、应用、地区和竞争细分,2020-2030 年)
 微型水力发电市场:按类型、涡轮机类型、组件、最终用户 - 2025-2030 年全球预测水力发电市场报告,按规模(大型水力发电(大于 100 兆瓦)、小型水力发电(小于 10 兆瓦)及其他)、应用(工业、住宅、商业)和地区划分,2025 年至 2033 年
 东南亚水电市场 -市场占有率分析、产业趋势与统计、成长预测(2025-2030 年)水电-市场占有率分析、产业趋势与统计、成长预测(2025-2030 年)