


 |
市场调查报告书
商品编码
1684655
食品风味市场机会、成长动力、产业趋势分析与预测,2025 - 2034 年Food Flavor Market Opportunity, Growth Drivers, Industry Trend Analysis, and Forecast, 2025 - 2034 |
||||||
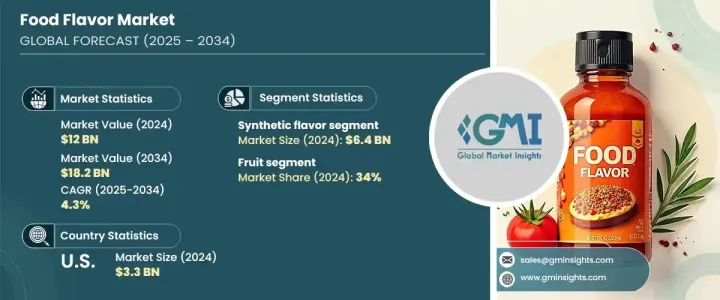
2024 年全球食品香料市场价值达到 120 亿美元,预计 2025 年至 2034 年期间将以 4.3% 的复合年增长率稳步增长。这种稳定成长的动力在于消费者对更健康、更天然的人工添加剂替代品的偏好不断变化。随着人们健康意识的增强,越来越多的消费者开始青睐源自植物和动物来源的天然香料。与通常与人工成分相关的合成香料相比,这些天然选择被认为更健康。
对清洁标籤产品(成分錶透明的食品)的需求不断增长,促进了这种转变。此外,市场也受益于对永续性的更大关注,天然香料通常被视为更环保。随着消费者寻求更高的透明度,他们要求产品采用更安全、更真实、更健康的成分来製作。全球各地政府部门的监管支持进一步推动了人们对自然选择的追求,并鼓励在食品中使用天然成分。
| 市场范围 | |
|---|---|
| 起始年份 | 2024 |
| 预测年份 | 2025-2034 |
| 起始值 | 120亿美元 |
| 预测值 | 182亿美元 |
| 复合年增长率 | 4.3% |
食物过敏和敏感症的发生率不断上升是推动天然香料流行的另一个因素,因为它们通常被认为是比合成香料更安全的替代品。全球对植物性和有机食品的需求不断增长,也推动了人们对天然风味的兴趣日益浓厚。消费者越来越寻求符合其不断变化的饮食偏好的口味,推动公司不断创新,推出更清洁、更健康的选择。随着注重健康的消费者的增多,这个市场趋势没有放缓的迹象。食品製造商预计将继续转向天然和清洁标籤产品,促使调味品公司提供多样化的产品。
食品香料市场依香料种类分为天然香料及合成香料。 2024 年,合成香料占据市场主导地位,创造 64 亿美元的收入。它们的成本效益、一致性和较长的保质期使其成为加工食品和饮料生产的热门选择。然而,消费者对天然和清洁标籤产品的偏好日益增长,为合成香料带来了挑战。消费者行为的转变促进了混合口味的发展,结合了合成和天然成分的优点。
在口味类别方面,水果口味占据领先地位,到 2024 年将占据 34% 的市场。这种受欢迎程度可归因于水果口味的天然甜味和多功能性,其用途广泛,包括饮料、糖果、乳製品和零食。此外,消费者对异国水果和热带水果口味的兴趣日益浓厚,反映了全球烹饪趋势和不断变化的口味偏好。
光是美国食品香料市场在 2024 年就创造了 33 亿美元的收入,这得益于充满活力和多样化的消费者群体,他们日益寻求创新和个性化的香料解决方案。对清洁标籤和天然成分的需求不断增长,加上方便食品的兴起,推动了该地区采用先进的调味技术。此外,行业领导者的强大影响力和在研发方面的大量投资支撑着美国市场的持续成长和主导地位。
目录
第 1 章:方法论与范围
- 市场范围和定义
- 基础估算与计算
- 预测计算
- 资料来源
- 基本的
- 次要
- 付费来源
- 公共资源
第 2 章:执行摘要
第 3 章:产业洞察
- 产业生态系统分析
- 影响价值链的因素
- 利润率分析
- 中断
- 未来展望
- 製造商
- 经销商
- 供应商概况
- 利润率分析
- 重要新闻及倡议
- 监管格局
- 衝击力
- 成长动力
- 天然食品香料需求不断成长
- 全球方便食品的普及度不断提高
- 饮料业领域的扩张
- 产业陷阱与挑战
- 天然调味料成本高
- 成长动力
- 成长潜力分析
- 波特的分析
- PESTEL 分析
第四章:竞争格局
- 介绍
- 公司市占率分析
- 竞争定位矩阵
- 战略展望矩阵
第 5 章:市场规模与预测:按类型,2021-2034 年
- 主要趋势
- 天然风味
- 合成香料
第 6 章:市场规模及预测:依口味,2021-2034 年
- 主要趋势
- 水果
- 巧克力
- 香草
- 坚果
- 焦糖
- 其他
第 7 章:市场规模与预测:按应用,2021-2034 年
- 主要趋势
- 饮料
- 乳製品
- 麵包和糖果
- 咸味小吃
- 其他
第 8 章:市场规模与预测:按地区,2021-2034 年
- 主要趋势
- 北美洲
- 我们
- 加拿大
- 欧洲
- 英国
- 德国
- 法国
- 义大利
- 西班牙
- 俄罗斯
- 亚太地区
- 中国
- 印度
- 日本
- 韩国
- 澳洲
- 拉丁美洲
- 巴西
- 墨西哥
- 中东及非洲
- 南非
- 沙乌地阿拉伯
- 阿联酋
第九章:公司简介
- BioSun 调味品和食品配料
- 多勒尔
- 弗拉瓦罗马
- 水果蔬汁
- 奇华顿公司
- 黄金海岸配料
- 国际香精香料公司 (IFF)
- 凯里集团
- MANE 香精香料製造商
- 麦考密克公司
- 自然香精有限公司
- Sensient 技术
- 德之馨股份有限公司
- 协同风味
- T.长谷川株式会社
The Global Food Flavor Market reached a value of USD 12 billion in 2024 and is expected to grow at a steady CAGR of 4.3% from 2025 to 2034. This steady growth is driven by evolving consumer preferences for healthier, more natural alternatives to artificial additives. As awareness about health and wellness increases, more consumers are gravitating toward natural flavors derived from plant and animal sources. These natural options are viewed as healthier compared to synthetic flavors, which are often associated with artificial ingredients.
The rising demand for clean-label products-foods with transparent ingredient lists-is contributing to this shift. In addition, the market is benefiting from a greater focus on sustainability, with natural flavors often seen as more environmentally friendly. As consumers seek greater transparency, they're demanding products made with ingredients that are safer, more authentic, and healthier. This drive for natural options is being further fueled by regulatory support from authorities worldwide that encourage the use of naturally sourced ingredients in food products.
| Market Scope | |
|---|---|
| Start Year | 2024 |
| Forecast Year | 2025-2034 |
| Start Value | $12 Billion |
| Forecast Value | $18.2 Billion |
| CAGR | 4.3% |
The growing incidence of food allergies and sensitivities is another factor driving the popularity of natural flavors, as they are generally perceived as safer alternatives to synthetic options. The expanding global demand for plant-based and organic foods also supports the growing interest in naturally derived flavors. Consumers are increasingly seeking flavors that align with their evolving dietary preferences, pushing companies to innovate with cleaner, more wholesome options. With the rise in health-conscious consumers, this market trend shows no signs of slowing down. Food manufacturers are expected to continue shifting toward natural and clean-label products, prompting flavor companies to diversify their offerings.
The food flavor market is segmented by flavor type into natural and synthetic. In 2024, synthetic flavors dominated the market, generating USD 6.4 billion in revenue. Their cost-effectiveness, consistency, and long shelf life make them popular choices in processed food and beverage production. However, the growing consumer preference for natural and clean-label products is presenting challenges for synthetic flavors. This shift in consumer behavior has encouraged the development of hybrid flavors, combining the benefits of both synthetic and natural ingredients.
In terms of flavor categories, fruit flavors were the leading segment, accounting for 34% of the market share in 2024. This popularity can be attributed to the natural sweetness and versatility of fruit flavors, which are used in a wide range of applications, including beverages, confectionery, dairy, and snacks. Additionally, the increasing consumer interest in exotic and tropical fruit flavors is reflective of global culinary trends and evolving taste preferences.
The U.S. food flavor market alone generated USD 3.3 billion in 2024, driven by a dynamic and diverse consumer base that increasingly seeks innovative and personalized flavor solutions. The growing demand for clean-label and natural ingredients, combined with the rise of convenience foods, is fueling the adoption of advanced flavor technologies in the region. Furthermore, the strong presence of leading industry players and significant investments in research and development are supporting the U.S. market's ongoing growth and dominance.
Table of Contents
Chapter 1 Methodology & Scope
- 1.1 Market scope & definition
- 1.2 Base estimates & calculations
- 1.3 Forecast calculation
- 1.4 Data sources
- 1.4.1 Primary
- 1.4.2 Secondary
- 1.4.2.1 Paid sources
- 1.4.2.2 Public sources
Chapter 2 Executive Summary
- 2.1 Industry synopsis, 2021-2034
Chapter 3 Industry Insights
- 3.1 Industry ecosystem analysis
- 3.1.1 Factor affecting the value chain
- 3.1.2 Profit margin analysis
- 3.1.3 Disruptions
- 3.1.4 Future outlook
- 3.1.5 Manufacturers
- 3.1.6 Distributors
- 3.2 Supplier landscape
- 3.3 Profit margin analysis
- 3.4 Key news & initiatives
- 3.5 Regulatory landscape
- 3.6 Impact forces
- 3.6.1 Growth drivers
- 3.6.1.1 Rising demand for natural food flavors
- 3.6.1.2 Increased adoption of convenience foods globally
- 3.6.1.3 Expansion in the beverage industry sector
- 3.6.2 Industry pitfalls & challenges
- 3.6.2.1 High cost of natural flavor ingredients
- 3.6.1 Growth drivers
- 3.7 Growth potential analysis
- 3.8 Porter's analysis
- 3.9 PESTEL analysis
Chapter 4 Competitive Landscape, 2024
- 4.1 Introduction
- 4.2 Company market share analysis
- 4.3 Competitive positioning matrix
- 4.4 Strategic outlook matrix
Chapter 5 Market Size and Forecast, By Type, 2021-2034 (USD Billion) (Kilo Tons)
- 5.1 Key trends
- 5.2 Natural flavor
- 5.3 Synthetic flavor
Chapter 6 Market Size and Forecast, By Flavor, 2021-2034 (USD Billion) (Kilo Tons)
- 6.1 Key trends
- 6.2 Fruit
- 6.3 Chocolate
- 6.4 Vanilla
- 6.5 Nut
- 6.6 Caramel
- 6.7 Other
Chapter 7 Market Size and Forecast, By Application, 2021-2034 (USD Billion) (Kilo Tons)
- 7.1 Key trends
- 7.2 Beverages
- 7.3 Dairy products
- 7.4 Bakery and confectionery
- 7.5 Savory and snacks
- 7.6 Other
Chapter 8 Market Size and Forecast, By Region, 2021-2034 (USD Billion) (Kilo Tons)
- 8.1 Key trends
- 8.2 North America
- 8.2.1 U.S.
- 8.2.2 Canada
- 8.3 Europe
- 8.3.1 UK
- 8.3.2 Germany
- 8.3.3 France
- 8.3.4 Italy
- 8.3.5 Spain
- 8.3.6 Russia
- 8.4 Asia Pacific
- 8.4.1 China
- 8.4.2 India
- 8.4.3 Japan
- 8.4.4 South Korea
- 8.4.5 Australia
- 8.5 Latin America
- 8.5.1 Brazil
- 8.5.2 Mexico
- 8.6 MEA
- 8.6.1 South Africa
- 8.6.2 Saudi Arabia
- 8.6.3 UAE
Chapter 9 Company Profiles
- 9.1 BioSun Flavors & Food Ingredients
- 9.2 Doehler
- 9.3 Flavaroma
- 9.4 Frutarom
- 9.5 Givaudan S.A.
- 9.6 Gold Coast Ingredients
- 9.7 International Flavors and Fragrances (IFF)
- 9.8 Kerry Group plc
- 9.9 MANE Flavor & Fragrance Manufacturer
- 9.10 McCormick & Company, Inc.
- 9.11 Natures Flavors, Inc.
- 9.12 Sensient Technologies
- 9.13 Symrise AG
- 9.14 Synergy Flavors
- 9.15 T. Hasegawa Co., Ltd.
 全球二甲基二硫市场规模、份额、趋势和成长分析报告(2026-2034年)
 食品香精市场规模、份额和成长分析(按标籤/法规、形式、类型、应用和地区划分)-产业预测(2026-2033年)
 二甲基二硫(DMDS)的全球市场
 食品香料市场:按类别、香料类型、应用和地区划分
 食品香精市场 - 全球产业规模、份额、趋势、机会和预测,按类型、按应用、按形式、按类别、按地区和竞争,2020-2030F全球食品香料市场食品香料市场:预测(2025-2030)全球食品香料市场研究报告 - 2024 年至 2032 年产业分析、规模、份额、成长、趋势与预测
 食品香精市场报告:2030 年趋势、预测与竞争分析