


 |
市场调查报告书
商品编码
1698515
液氢市场机会、成长动力、产业趋势分析及2025-2034年预测Liquid Hydrogen Market Opportunity, Growth Drivers, Industry Trend Analysis, and Forecast 2025-2034 |
||||||
2024 年全球液氢市场规模达 405 亿美元,预计 2025 年至 2034 年期间复合年增长率为 5.4%,这得益于氢基础设施投资的增加、技术进步和国际合作。液态氢在工业脱碳、支持清洁能源转型和满足严格的减排目标方面发挥作用,因此对液态氢的需求正在上升。世界各国政府正在实施政策和资助计划,以加速从交通运输到工业应用等各个领域的氢气应用。领先的企业也正在组成策略联盟,开发大型氢气生产中心,确保稳定的供应链,满足日益增长的能源需求。交通运输业,尤其是氢燃料电池汽车,正在成为液态氢的主要消费者,进一步推动市场扩张。储存、处理和分配方面的技术创新正在提高效率,使液态氢成为各种应用的更可行的替代品。
氢气枢纽的发展是推动市场成长的主要因素。这些中心是氢气生产、储存和分配的集中地点,为采用基于氢气的解决方案的产业创建了无缝的供应链。技术供应商和能源公司之间的合作正在促进提高生产效率和成本效益的创新。旨在推进氢技术的全球倡议正在进一步加强该行业,并建立强大的国际供应网络。
| 市场范围 | |
|---|---|
| 起始年份 | 2024 |
| 预测年份 | 2025-2034 |
| 起始值 | 405亿美元 |
| 预测值 | 685亿美元 |
| 复合年增长率 | 5.4% |
液氢市场根据生产方法进行细分,主要类别包括煤气化、电解和蒸汽甲烷重整(SMR)。由于其成本效益和大规模氢气生产效率,SMR 领域仍占据主导地位。到 2032 年,SMR 预计将创造 245 亿美元的收入,这得益于其在天然气资源丰富的地区的经济可行性。催化剂、製程优化和热回收系统的不断进步正在提高SMR操作的效率,同时减少排放,使其成为许多行业的首选生产方法。
液氢输送主要分为管路输送和低温储槽输送。 2024年,低温储槽占据85.9%的市场份额,反映其在氢气储存和运输中的关键作用。增强的绝缘技术显着提高了低温储罐的效率,最大限度地减少了氢气损失并确保了稳定的储存条件。先进材料的使用进一步降低了沸腾率,提高了氢气运输的可靠性和安全性。氢能枢纽和产业群正在扩大,广泛的管道网络正在建设中,以简化氢气分配并支持大规模工业应用。
美国是液氢市场的主要参与者,2024 年价值将达到 82 亿美元。在政府的大力支持、工业投资的增加以及环保意识的增强的推动下,预计到 2034 年,美国将占据 77% 的市场份额。联邦激励措施、政策框架和资助措施正在推动多个领域采用氢技术,巩固美国在氢能创新和基础设施发展领域的领先地位。随着各行各业朝着永续发展目标和脱碳努力迈进,美国液氢市场将在未来几年实现大幅扩张。
目录
第一章:方法论与范围
- 研究设计
- 基础估算与计算
- 预测模型
- 初步研究与验证
- 主要来源
- 资料探勘来源
- 市场定义
第二章:执行摘要
第三章:行业洞察
- 产业生态系统
- 监管格局
- 产业衝击力
- 成长动力
- 产业陷阱与挑战
- 成长潜力分析
- 波特的分析
- PESTEL 分析
第四章:竞争格局
- 介绍
- 战略仪表板
- 创新与技术格局
第五章:市场规模及预测:依生产方式,2021 年至 2034 年
- 主要趋势
- 瓦斯化
- 小型磁共振
- 电解
第六章:市场规模及预测:以分销方式,2021 年至 2034 年
- 主要趋势
- 管道
- 低温储罐
第七章:市场规模及预测:依应用,2021 年至 2034 年
- 主要趋势
- 运输
- 化学
- 其他的
第八章:市场规模及预测:按地区,2021 年至 2034 年
- 主要趋势
- 北美洲
- 我们
- 加拿大
- 欧洲
- 德国
- 英国
- 法国
- 义大利
- 亚太地区
- 中国
- 印度
- 日本
- 韩国
- 澳洲
- 世界其他地区
第九章:公司简介
- Air Products and Chemicals, Inc.
- Air Liquide
- Chart Industries
- ENGIE
- GE Appliances
- GENH2
- INOX India Limited
- Iwatani Corporation
- Kawasaki Heavy Industries, Ltd.
- Linde plc
- Messer
- Plug Power Inc.
- Praxair Technology, Inc.
- Salzburger Aluminium Group
- Shell plc
- Wuxi Yuantong Gas Co., Ltd
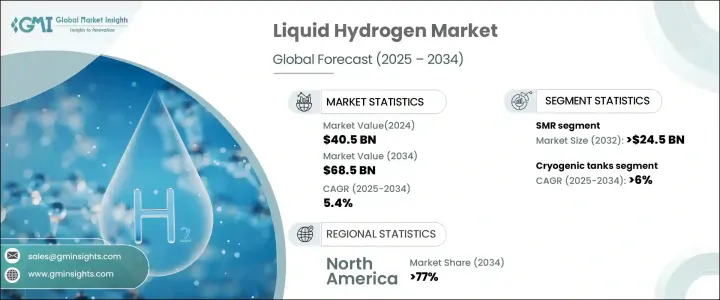
The Global Liquid Hydrogen Market generated USD 40.5 billion in 2024 and is projected to expand at a CAGR of 5.4% between 2025 and 2034, driven by increasing investments in hydrogen infrastructure, technological advancements, and international collaborations. The demand for liquid hydrogen is rising due to its role in decarbonizing industries, supporting clean energy transitions, and meeting stringent emission reduction targets. Governments worldwide are implementing policies and funding programs to accelerate hydrogen adoption across sectors, from transportation to industrial applications. Leading corporations are also forming strategic alliances to develop large-scale hydrogen production hubs, ensuring a steady supply chain to meet the growing energy needs. The transportation sector, particularly hydrogen fuel cell vehicles, is emerging as a key consumer of liquid hydrogen, further driving market expansion. Technological innovations in storage, handling, and distribution are enhancing efficiency, making liquid hydrogen a more viable alternative for various applications.
The development of hydrogen hubs is a major factor fueling market growth. These hubs serve as centralized locations for hydrogen production, storage, and distribution, creating a seamless supply chain for industries adopting hydrogen-based solutions. Partnerships between technology providers and energy companies are fostering innovations that improve production efficiency and cost-effectiveness. Global initiatives aimed at advancing hydrogen technology are further strengthening the industry, enabling the establishment of a robust international supply network.
| Market Scope | |
|---|---|
| Start Year | 2024 |
| Forecast Year | 2025-2034 |
| Start Value | $40.5 Billion |
| Forecast Value | $68.5 Billion |
| CAGR | 5.4% |
The liquid hydrogen market is segmented based on production methods, with key categories including coal gasification, electrolysis, and steam methane reforming (SMR). The SMR segment remains dominant due to its cost-effectiveness and efficiency in large-scale hydrogen production. By 2032, SMR is expected to generate USD 24.5 billion, driven by its economic viability in regions with abundant natural gas resources. Continuous advancements in catalysts, process optimization, and heat recovery systems are improving the efficiency of SMR operations while reducing emissions, making it a preferred production method for many industries.
The distribution of liquid hydrogen is primarily divided into pipelines and cryogenic tanks. In 2024, cryogenic tanks accounted for 85.9% of the market share, reflecting their critical role in hydrogen storage and transportation. Enhanced insulation technologies have significantly improved the efficiency of cryogenic tanks, minimizing hydrogen loss and ensuring stable storage conditions. The use of advanced materials has further reduced boil-off rates, enhancing the reliability and safety of hydrogen transport. Hydrogen hubs and industrial clusters are expanding, with extensive pipeline networks being developed to streamline hydrogen distribution and support large-scale industrial applications.
The United States is a key player in the liquid hydrogen market, valued at USD 8.2 billion in 2024. The country is expected to contribute 77% of the market share by 2034, driven by strong government support, rising industrial investments, and increasing environmental awareness. Federal incentives, policy frameworks, and funding initiatives are promoting the adoption of hydrogen technologies across multiple sectors, reinforcing the U.S. position as a leader in hydrogen innovation and infrastructure development. As industries align with sustainability goals and decarbonization efforts, the U.S. liquid hydrogen market is poised for significant expansion in the coming years.
Table of Contents
Chapter 1 Methodology & Scope
- 1.1 Research design
- 1.2 Base estimates & calculations
- 1.3 Forecast model
- 1.4 Primary research & validation
- 1.4.1 Primary sources
- 1.4.2 Data mining sources
- 1.5 Market definitions
Chapter 2 Executive Summary
- 2.1 Industry 3600 synopsis, 2021 – 2034
Chapter 3 Industry Insights
- 3.1 Industry ecosystem
- 3.2 Regulatory landscape
- 3.3 Industry impact forces
- 3.3.1 Growth drivers
- 3.3.2 Industry pitfalls & challenges
- 3.4 Growth potential analysis
- 3.5 Porter's analysis
- 3.5.1 Bargaining power of suppliers
- 3.5.2 Bargaining power of buyers
- 3.5.3 Threat of new entrants
- 3.5.4 Threat of substitutes
- 3.6 PESTEL analysis
Chapter 4 Competitive landscape, 2024
- 4.1 Introduction
- 4.2 Strategic dashboard
- 4.3 Innovation & technology landscape
Chapter 5 Market Size and Forecast, By Production Method, 2021 – 2034 (USD Billion)
- 5.1 Key trends
- 5.2 Coal gasification
- 5.3 SMR
- 5.4 Electrolysis
Chapter 6 Market Size and Forecast, By Distribution Method, 2021 – 2034 (USD Billion)
- 6.1 Key trends
- 6.2 Pipelines
- 6.3 Cryogenic tanks
Chapter 7 Market Size and Forecast, By Application, 2021 – 2034 (USD Billion)
- 7.1 Key trends
- 7.2 Transportation
- 7.3 Chemical
- 7.4 Others
Chapter 8 Market Size and Forecast, By Region, 2021 – 2034 (USD Billion)
- 8.1 Key trends
- 8.2 North America
- 8.2.1 U.S.
- 8.2.2 Canada
- 8.3 Europe
- 8.3.1 Germany
- 8.3.2 UK
- 8.3.3 France
- 8.3.4 Italy
- 8.4 Asia Pacific
- 8.4.1 China
- 8.4.2 India
- 8.4.3 Japan
- 8.4.4 South Korea
- 8.4.5 Australia
- 8.4.6 Rest of World
Chapter 9 Company Profiles
- 9.1 Air Products and Chemicals, Inc.
- 9.2 Air Liquide
- 9.3 Chart Industries
- 9.4 ENGIE
- 9.5 GE Appliances
- 9.6 GENH2
- 9.7 INOX India Limited
- 9.8 Iwatani Corporation
- 9.9 Kawasaki Heavy Industries, Ltd.
- 9.10 Linde plc
- 9.11 Messer
- 9.12 Plug Power Inc.
- 9.13 Praxair Technology, Inc.
- 9.14 Salzburger Aluminium Group
- 9.15 Shell plc
- 9.16 Wuxi Yuantong Gas Co., Ltd


