


 |
市场调查报告书
商品编码
1698558
智慧票务市场机会、成长动力、产业趋势分析及 2025-2034 年预测Smart Ticketing Market Opportunity, Growth Drivers, Industry Trend Analysis, and Forecast 2025-2034 |
||||||
2024 年全球智慧票务市场价值为 106 亿美元,预计 2025 年至 2034 年的复合年增长率为 14.3%。北美和欧洲等已开发地区采用非接触式支付解决方案是推动市场扩张的关键因素。消费者现在更喜欢更快、更安全、更无缝的票务系统,增强了对智慧票务技术的信任。加密技术的广泛采用进一步加强了支付安全性,而整合到智慧票务系统中的数位广告则增强了用户参与度。对政府和私人电子服务的日益依赖,加速了对智慧票务解决方案的需求。城市化也导致公共交通使用量的激增,需要先进的支付系统。新兴经济体的政府正在投资现代化公共交通,进一步刺激市场表现。
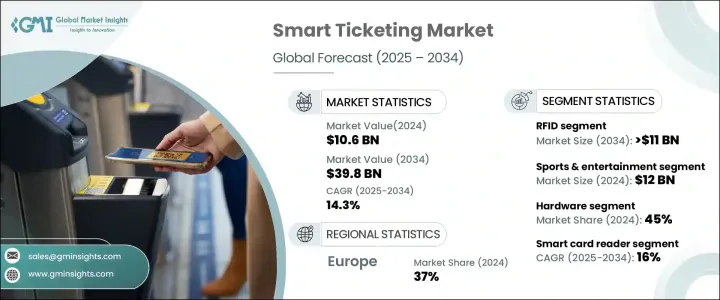
智慧票务解决方案依连线性分为条码、RFID、蜂窝网路、Wi-Fi 和近场通讯。 RFID 领域占了超过 30% 的市场份额,预计到 2034 年将超过 110 亿美元。支援 RFID 的智慧卡系统和电子资讯亭等硬体组件越来越受欢迎,为交通和娱乐场所的出行提供了便捷的途径。这些智慧卡可以充值虚拟资金,让乘客和活动参与者轻鬆进行无现金交易。硬体和软体解决方案的日益整合正在推动对感测器、微控制器和积体电路等基本组件的需求,这些组件在智慧票务基础设施中发挥着至关重要的作用。此外,智慧卡业者提供的票价折扣也吸引了越来越多的客户。
| 市场范围 | |
|---|---|
| 起始年份 | 2024 |
| 预测年份 | 2025-2034 |
| 起始值 | 106亿美元 |
| 预测值 | 398亿美元 |
| 复合年增长率 | 14.3% |
根据最终用途应用,智慧票务市场分为停车、体育和娱乐、交通和其他类别。体育和娱乐产业引领市场,2024 年创造 120 亿美元的市场价值。体育场和音乐厅等娱乐场所越来越多地使用动态定价策略,这推动了对自动票务解决方案的需求。这些系统有助于简化门票销售、优化定价并确保活动管理顺利进行。随着线上机票预订量的增加,安全问题正在透过提供端到端加密的创新区块链支付平台得到解决。智慧体育场解决方案的采用也在加速,使活动组织者能够透过数位工具加强票务验证、移动入口和停车管理。
根据组成部分,市场分为硬体、软体和服务。随着对 RFID 读取器和整合 IC 等便携式验证设备的需求不断增长,硬体部分将在 2024 年占据 45% 的市场份额。由自助服务终端、平板电脑和支援 Wi-Fi 的装置中的红外线感测器提供支援的非接触式票务解决方案在疫情后越来越受欢迎。微控制器提高了交易效率,进一步推动了硬体领域的成长。
在产品方面,市场包括请求追踪器、票务验证器、智慧卡读卡机、行动售票终端、智慧售票亭和电子收费系统。预计到 2034 年,智慧卡读卡机的复合年增长率将达到 16%,这得益于其在公共交通、门禁管制和医疗保健票务领域的广泛应用。这些系统提高了营运效率并确保了交易安全,使其成为各行业必不可少的系统。
欧洲占据主导地位,占有37%的市场。德国在该地区处于领先地位,2024 年创造了 23 亿美元的收入。政府支持的推广数位票务解决方案的倡议正在鼓励人们更多地使用公共交通,并加强智慧票务的采用。在人口密集的城市,智慧票务系统提供了可扩展的解决方案,可以有效管理客流,减少售票柜檯拥挤并简化交通运作。对数位交易的日益增长的偏好正在塑造城市交通的未来,使智慧票务成为现代交通系统的重要组成部分。
目录
第一章:方法论与范围
- 研究设计
- 研究方法
- 资料收集方法
- 基础估算与计算
- 基准年计算
- 市场评估的主要趋势
- 预测模型
- 初步研究和验证
- 主要来源
- 资料探勘来源
- 市场范围和定义
第二章:执行摘要
第三章:行业洞察
- 产业生态系统分析
- 供应商格局
- 硬体供应商
- 软体供应商
- 技术提供者
- 最终用途
- 利润率分析
- 供应商格局
- 技术与创新格局
- 专利分析
- 监管格局
- 价格趋势
- 衝击力
- 成长动力
- 非接触式支付解决方案的采用日益增多
- 对公共交通的依赖日益增加
- 提高交通系统的技术整合度
- 票务平台高度证券化
- 票务系统数位化
- 产业陷阱与挑战
- 与旧平台的兼容性问题
- 开发成本高
- 成长动力
- 成长潜力分析
- 波特的分析
- PESTEL分析
第四章:竞争格局
- 介绍
- 公司市占率分析
- 竞争定位矩阵
- 战略展望矩阵
第五章:市场估计与预测:按组件,2021 - 2034 年
- 主要趋势
- 硬体
- 软体
- 服务
第六章:市场估计与预测:依发行量,2021 - 2034 年
- 主要趋势
- 智慧卡读卡器
- 验票机
- 售票行动终端
- 请求追踪器
- 售票机/智慧售票亭
- 电子收费
第七章:市场估计与预测:依连结性,2021 - 2034 年
- 主要趋势
- 射频识别
- 条码
- 近场通讯 (NFC)
- 蜂窝网路
- 无线上网
第八章:市场估计与预测:依最终用途,2021 - 2034 年
- 主要趋势
- 停车处
- 体育与娱乐
- 运输
- 其他的
第九章:市场估计与预测:按地区,2021 - 2034 年
- 主要趋势
- 北美洲
- 我们
- 加拿大
- 欧洲
- 英国
- 德国
- 法国
- 义大利
- 西班牙
- 俄罗斯
- 北欧人
- 亚太地区
- 中国
- 印度
- 日本
- 澳洲
- 韩国
- 东南亚
- 拉丁美洲
- 巴西
- 墨西哥
- 阿根廷
- MEA
- 阿联酋
- 南非
- 沙乌地阿拉伯
第十章:公司简介
- Atos
- Confidex (Now Beontag)
- Chengdu Monkey Software
- Conduent
- CPI Card Group
- Cubic Corporation
- ETICKETS.HK
- Fujitsu
- Giesecke & Devrient
- HID Global
- Indra Systemas
- Infineon Technologies
- NXP Semiconductors
- Oberthur Technologies
- Scheidt & Bachman
- Siemens
- Telvent GIT
- Thales Group (formerly Gemalto)
- Vix Technology
- Xerox Corporation
The Global Smart Ticketing Market was valued at USD 10.6 billion in 2024 and is projected to grow at a CAGR of 14.3% from 2025 to 2034. The adoption of contactless payment solutions across developed regions like North America and Europe is a key factor driving market expansion. Consumers now prefer faster, secure, and seamless ticketing systems, enhancing trust in smart ticketing technologies. Increased adoption of encryption further strengthens payment security, while digital advertising integrated into smart ticketing systems enhances user engagement. The growing reliance on electronic services, both governmental and private, is accelerating the demand for intelligent ticketing solutions. Urbanization is also leading to a surge in public transport usage, necessitating advanced payment systems. Governments in emerging economies are investing in modernizing public transportation, further stimulating market performance.
Smart ticketing solutions are categorized based on connectivity into barcode, RFID, cellular networks, Wi-Fi, and near-field communications. The RFID segment held over 30% market share and is expected to exceed USD 11 billion by 2034. Hardware components such as smart card systems enabled with RFID and E-kiosks are gaining traction, offering easy access to transportation and entertainment venues. These smart cards can be reloaded with virtual funds, allowing passengers and event attendees to make cashless transactions effortlessly. The growing integration of hardware and software solutions is fueling demand for essential components like sensors, microcontrollers, and ICs, which play a crucial role in smart ticketing infrastructure. Additionally, fare discounts offered by smart card operators are attracting a larger customer base.
| Market Scope | |
|---|---|
| Start Year | 2024 |
| Forecast Year | 2025-2034 |
| Start Value | $10.6 Billion |
| Forecast Value | $39.8 Billion |
| CAGR | 14.3% |
Based on end-use applications, the smart ticketing market is segmented into parking, sports & entertainment, transportation, and other categories. The sports & entertainment sector led the market, generating USD 12 billion in 2024. The increasing use of dynamic pricing strategies by entertainment venues, including stadiums and concert halls, is driving demand for automated ticketing solutions. These systems help streamline ticket sales, optimize pricing, and ensure smooth event management. As online ticket bookings rise, security concerns are being addressed through innovative blockchain-based payment platforms that offer end-to-end encryption. The adoption of smart stadium solutions is also accelerating, enabling event organizers to enhance ticket validation, mobile entry, and parking management through digital tools.
By component, the market is divided into hardware, software, and services. The hardware segment accounted for 45% market share in 2024, with the growing demand for portable validation devices like RFID readers and integrated ICs. Touch-free ticketing solutions, powered by IR sensors in kiosks, tablets, and Wi-Fi-enabled devices, are gaining popularity post-pandemic. Microcontrollers improve transaction efficiency, further driving the hardware segment growth.
In terms of offerings, the market includes request trackers, ticket validators, smart card readers, mobile ticketing terminals, smart ticketing kiosks, and E-tolling systems. Smart card readers are projected to grow at a CAGR of 16% through 2034, driven by their widespread use in public transport, access control, and healthcare ticketing. These systems enhance operational efficiency and ensure secure transactions, making them essential in various industries.
Europe holds a dominant market position, with a 37% share. Germany led the region, generating USD 2.3 billion in 2024. Government-backed initiatives promoting digital ticketing solutions are encouraging greater public transport use and reinforcing smart ticketing adoption. In densely populated cities, smart ticketing systems offer a scalable solution to manage passenger flow efficiently, reducing ticket counter congestion and streamlining transit operations. The increasing preference for digital transactions is shaping the future of urban mobility, positioning smart ticketing as a critical component of modern transportation systems.
Table of Contents
Chapter 1 Methodology & Scope
- 1.1 Research design
- 1.1.1 Research approach
- 1.1.2 Data collection methods
- 1.2 Base estimates & calculations
- 1.2.1 Base year calculation
- 1.2.2 Key trends for market estimation
- 1.3 Forecast model
- 1.4 Primary research and validation
- 1.4.1 Primary sources
- 1.4.2 Data mining sources
- 1.5 Market scope & definition
Chapter 2 Executive Summary
- 2.1 Industry 3600 synopsis, 2021 - 2034
Chapter 3 Industry Insights
- 3.1 Industry ecosystem analysis
- 3.1.1 Supplier landscape
- 3.1.1.1 Hardware suppliers
- 3.1.1.2 Software providers
- 3.1.1.3 Technology providers
- 3.1.1.4 End use
- 3.1.2 Profit margin analysis
- 3.1.1 Supplier landscape
- 3.2 Technology & innovation landscape
- 3.3 Patent analysis
- 3.4 Regulatory landscape
- 3.5 Price trend
- 3.6 Impact forces
- 3.6.1 Growth drivers
- 3.6.1.1 Growing adoption of contactless payment solutions
- 3.6.1.2 Growing reliance on public transportation
- 3.6.1.3 Increasing technological integration in transit systems
- 3.6.1.4 High securitization of ticketing platforms
- 3.6.1.5 Digitization of ticketing systems
- 3.6.2 Industry pitfalls & challenges
- 3.6.2.1 Compatibility issues with legacy platforms
- 3.6.2.2 High development costs
- 3.6.1 Growth drivers
- 3.7 Growth potential analysis
- 3.8 Porter's analysis
- 3.9 PESTEL analysis
Chapter 4 Competitive Landscape, 2024
- 4.1 Introduction
- 4.2 Company market share analysis
- 4.3 Competitive positioning matrix
- 4.4 Strategic outlook matrix
Chapter 5 Market Estimates & Forecast, By Component, 2021 - 2034 ($Bn)
- 5.1 Key trends
- 5.2 Hardware
- 5.3 Software
- 5.4 Services
Chapter 6 Market Estimates & Forecast, By Offerings, 2021 - 2034 ($Bn)
- 6.1 Key trends
- 6.2 Smart card reader
- 6.3 Ticket validators
- 6.4 Ticketing mobile terminals
- 6.5 Request tracker
- 6.6 Ticketing machine / smart ticketing Kiosk
- 6.7 E-toll
Chapter 7 Market Estimates & Forecast, By Connectivity, 2021 - 2034 ($Bn)
- 7.1 Key trends
- 7.2 RFID
- 7.3 Barcode
- 7.4 Near-field Communication (NFC)
- 7.5 Cellular network
- 7.6 Wi-Fi
Chapter 8 Market Estimates & Forecast, By End Use, 2021 - 2034 ($Bn)
- 8.1 Key trends
- 8.2 Parking
- 8.3 Sports & Entertainment
- 8.4 Transportation
- 8.5 Others
Chapter 9 Market Estimates & Forecast, By Region, 2021 - 2034 ($Bn)
- 9.1 Key trends
- 9.2 North America
- 9.2.1 U.S.
- 9.2.2 Canada
- 9.3 Europe
- 9.3.1 UK
- 9.3.2 Germany
- 9.3.3 France
- 9.3.4 Italy
- 9.3.5 Spain
- 9.3.6 Russia
- 9.3.7 Nordics
- 9.4 Asia Pacific
- 9.4.1 China
- 9.4.2 India
- 9.4.3 Japan
- 9.4.4 Australia
- 9.4.5 South Korea
- 9.4.6 Southeast Asia
- 9.5 Latin America
- 9.5.1 Brazil
- 9.5.2 Mexico
- 9.5.3 Argentina
- 9.6 MEA
- 9.6.1 UAE
- 9.6.2 South Africa
- 9.6.3 Saudi Arabia
Chapter 10 Company Profiles
- 10.1 Atos
- 10.2 Confidex (Now Beontag)
- 10.3 Chengdu Monkey Software
- 10.4 Conduent
- 10.5 CPI Card Group
- 10.6 Cubic Corporation
- 10.7 ETICKETS.HK
- 10.8 Fujitsu
- 10.9 Giesecke & Devrient
- 10.10 HID Global
- 10.11 Indra Systemas
- 10.12 Infineon Technologies
- 10.13 NXP Semiconductors
- 10.14 Oberthur Technologies
- 10.15 Scheidt & Bachman
- 10.16 Siemens
- 10.17 Telvent GIT
- 10.18 Thales Group (formerly Gemalto)
- 10.19 Vix Technology
- 10.20 Xerox Corporation
 非接触式票务市场数据概览(2025 年第三季)
 线上活动票务市场分析及预测(至 2034 年):类型、产品、服务、技术、组件、应用、设备、部署、最终用户和解决方案
 智慧票务市场:按解决方案、最终用户、分销管道、票务类型和部署类型划分-2025-2032年全球预测线上巴士票务服务市场(按预订平台、票务类型、支付方式和客户类型)—2025-2032 年全球预测
 2021-2031 年亚太地区服务台和工单软体市场报告(范围、细分、动态和竞争分析)
 2021-2031 年北美服务台和工单软体市场报告(范围、细分、动态和竞争分析)
 2021-2031 年欧洲服务台和工单软体市场报告(范围、细分、动态和竞争分析)
 线上电影票务服务市场报告(按设备、类型、应用程式和地区)2025 年至 2033 年
 数位票务市场资料:2025-2030年2025 年至 2033 年日本智慧票务市场报告(按产品、组件、系统、应用和地区)