


 |
市场调查报告书
商品编码
1741018
往復式发电发动机市场机会、成长动力、产业趋势分析及 2025 - 2034 年预测Reciprocating Power Generating Engine Market Opportunity, Growth Drivers, Industry Trend Analysis, and Forecast 2025 - 2034 |
||||||
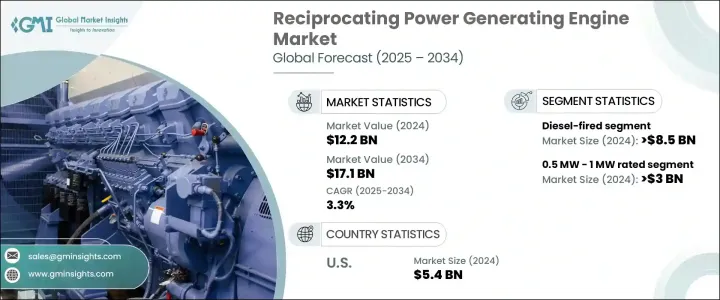
2024年,全球往復式发电发动机市场规模达122亿美元,预计到2034年将以3.3%的复合年增长率成长,达到171亿美元。这一成长趋势受到各种应用领域日益增长的需求的影响,包括备用能源系统、电网平衡功能、工业营运和分散式发电。往復式引擎效率更高、启动速度更快、操作灵活,这使得它们在人口稠密地区和偏远地区越来越受欢迎,因为在这些地区,稳定可靠的电力供应至关重要。
市场扩张也与微电网部署和农村电气化建设的持续推进息息相关,尤其是在工业区。这些引擎透过提供可扩展且灵活的解决方案,在满足偏远地区和离网社区的电力需求方面发挥着至关重要的作用。随着新兴经济体和已开发经济体基础建设的持续推进,人们明显转向适应性强的技术,这些技术不仅能减少环境影响,还能满足现代能源系统的技术和经济要求。往復式引擎凭藉其模组化设计优势和与不同负载条件的兼容性脱颖而出,这有助于在稳态和波动的电力需求情境下最大限度地提高性能。
| 市场范围 | |
|---|---|
| 起始年份 | 2024 |
| 预测年份 | 2025-2034 |
| 起始值 | 122亿美元 |
| 预测值 | 171亿美元 |
| 复合年增长率 | 3.3% |
向更清洁能源替代品的转变进一步加速了燃气引擎系统的普及。根据燃料分类,市场细分为柴油、燃气、双燃料和其他类型。其中,燃气往復式引擎市场预计到2034年将以超过4%的成长率扩张。这一成长主要源自于全球对减少碳足迹和摆脱对传统化石燃料依赖的重视。燃气引擎具有更佳的排放性能和更高的能源效率,这与日益严格的可持续能源生产监管要求一致。它们能够与再生能源系统无缝整合,这也提升了其在混合能源模式中的吸引力。
就额定功率而言,该行业细分为几类:0.5 MW - 1 MW、1 MW 以上 - 2 MW、2 MW 以上 - 3.5 MW、3.5 MW 以上 - 5 MW、5 MW 以上 - 7.5 MW 以及 7.5 MW 以上。其中,额定功率在 1 MW 以上至 2 MW 之间的引擎在 2024 年占据市场主导地位,占总市场份额的 35.3% 以上。这一特定的容量范围在紧凑设计和高输出之间取得了平衡,使其成为中型工业工厂、商业设施和分散式发电营运的最佳选择。这些引擎能够在峰值和基载场景下运行,从而提高了它们在多个应用领域的利用率,并持续推动市场发展。
美国在全球市场格局中持续扮演着举足轻重的角色。 2022年,美国往復式引擎产业的估值为50亿美元,2023年将增加至52亿美元,2024年将达54亿美元。能源需求的不断增长、能源韧性基础设施的投资以及日益增多的天气相关干扰事件(这些事件需要稳健且无功的电力解决方案)推动了这一增长。此外,备用能源和分散式能源的广泛部署也鼓励使用能够快速应对能源短缺和电网不稳定的高效引擎系统。
市场动态也受到不断变化的竞争格局的影响。该领域五大领先公司合计占据全球约45%的市场。随着製造商专注于提高燃料灵活性、增强引擎耐用性以及扩大售后服务网络,竞争也日益激烈。支援柴油、天然气和双燃料的引擎设计因其能够适应不同的燃料供应条件和营运要求而备受关注。此外,随着企业越来越重视生命週期性能和维护效率,提供全面服务包和整合数位监控解决方案的製造商将有望抓住更大的市场机会。
目录
第一章:方法论与范围
第二章:执行摘要
第三章:行业洞察
- 产业生态系统分析
- 川普政府关税分析
- 对贸易的影响
- 贸易量中断
- 报復措施
- 对产业的影响
- 供应方影响(原料)
- 主要材料价格波动
- 供应链重组
- 生产成本影响
- 需求面影响(售价)
- 价格传导至终端市场
- 市占率动态
- 消费者反应模式
- 供应方影响(原料)
- 受影响的主要公司
- 策略产业反应
- 供应链重组
- 定价和产品策略
- 政策参与
- 展望与未来考虑
- 对贸易的影响
- 监管格局
- 产业衝击力
- 成长动力
- 产业陷阱与挑战
- 成长潜力分析
- 波特的分析
- PESTEL分析
第四章:竞争格局
- 介绍
- 战略仪表板
- 策略倡议
- 公司市占率分析
- 竞争基准测试
- 创新与永续发展格局
第五章:市场规模及预测:依燃料类型,2021 - 2034
- 主要趋势
- 瓦斯
- 0.5 兆瓦 - 1 兆瓦
- > 1 兆瓦 - 2 兆瓦
- > 2 兆瓦 - 3.5 兆瓦
- > 3.5 兆瓦 - 5 兆瓦
- > 5 兆瓦 - 7.5 兆瓦
- > 7.5 兆瓦
- 柴油引擎
- 0.5 兆瓦 - 1 兆瓦
- > 1 兆瓦 - 2 兆瓦
- > 2 兆瓦 - 3.5 兆瓦
- > 3.5 兆瓦 - 5 兆瓦
- > 5 兆瓦 - 7.5 兆瓦
- > 7.5 兆瓦
- 双燃料
- 0.5 兆瓦 - 1 兆瓦
- > 1 兆瓦 - 2 兆瓦
- > 2 兆瓦 - 3.5 兆瓦
- > 3.5 兆瓦 - 5 兆瓦
- > 5 兆瓦 - 7.5 兆瓦
- > 7.5 兆瓦
- 其他的
- 0.5 兆瓦 - 1 兆瓦
- > 1 兆瓦 - 2 兆瓦
- > 2 兆瓦 - 3.5 兆瓦
- > 3.5 兆瓦 - 5 兆瓦
- > 5 兆瓦 - 7.5 兆瓦
- > 7.5 兆瓦
第六章:市场规模及预测:依额定功率,2021 - 2034
- 主要趋势
- 0.5 兆瓦 - 1 兆瓦
- > 1 兆瓦 - 2 兆瓦
- > 2 兆瓦 - 3.5 兆瓦
- > 3.5 兆瓦 - 5 兆瓦
- > 5 兆瓦 - 7.5 兆瓦
- > 7.5 兆瓦
第七章:市场规模及预测:依应用,2021 - 2034
- 主要趋势
- 工业的
- 热电联产
- 能源与公用事业
- 垃圾掩埋场和沼气
- 石油和天然气
- 其他的
第八章:市场规模及预测:依最终用途,2021 - 2034
- 主要趋势
- 备份
- 0.5 兆瓦 - 1 兆瓦
- > 1 兆瓦 - 2 兆瓦
- > 2 兆瓦 - 3.5 兆瓦
- > 3.5 兆瓦 - 5 兆瓦
- > 5 兆瓦 - 7.5 兆瓦
- > 7.5 兆瓦
- 主电源
- 0.5 兆瓦 - 1 兆瓦
- > 1 兆瓦 - 2 兆瓦
- > 2 兆瓦 - 3.5 兆瓦
- > 3.5 兆瓦 - 5 兆瓦
- > 5 兆瓦 - 7.5 兆瓦
- > 7.5 兆瓦
第九章:市场规模及预测:按地区,2021 - 2034
- 主要趋势
- 北美洲
- 我们
- 加拿大
- 墨西哥
- 欧洲
- 英国
- 法国
- 德国
- 俄罗斯
- 义大利
- 西班牙
- 荷兰
- 丹麦
- 挪威
- 亚太地区
- 中国
- 印度
- 日本
- 韩国
- 澳洲
- 泰国
- 新加坡
- 印尼
- 马来西亚
- 中东和非洲
- 阿联酋
- 沙乌地阿拉伯
- 卡达
- 阿曼
- 科威特
- 伊朗
- 埃及
- 土耳其
- 约旦
- 南非
- 拉丁美洲
- 巴西
- 阿根廷
- 智利
- 秘鲁
第十章:公司简介
- Ashok Leyland
- Briggs & Stratton
- Caterpillar
- Cummins
- Deere & Company
- Deutz AG
- Enerflex
- Escorts Limited
- GE Vernova
- Guascor Energy
- Kawasaki Heavy Industries
- Kirloskar Oil Engines
- Kohler Engines
- MAN Energy Solutions
- Mitsubishi Heavy Industries
- Rolls-Royce
- Scania
- TRITON DURO
- Wartsilä
- YANMAR HOLDINGS
The Global Reciprocating Power Generating Engine Market was valued at USD 12.2 billion in 2024 and is estimated to grow at a CAGR of 3.3% to reach USD 17.1 billion by 2034. This upward trajectory is being shaped by growing demands across a wide range of applications, including backup energy systems, grid balancing functions, industrial operations, and decentralized power generation. The enhanced efficiency, rapid start-up capabilities, and operational versatility of reciprocating engines are making them an increasingly favored option in both densely populated areas and more isolated regions where consistent and reliable power access is critical.
The market's expansion is also linked to the rising deployment of microgrids and rural electrification efforts, especially in industrial zones. These engines are proving vital in meeting the power requirements of remote installations and off-grid communities by offering scalable and flexible solutions. As infrastructure development continues in emerging and developed economies alike, there is a marked shift toward adaptable technologies that not only reduce environmental impact but also meet the technical and economic requirements of modern energy systems. Reciprocating engines stand out by offering modular design benefits and compatibility with varying load conditions, which helps maximize performance in both steady-state and fluctuating power demand scenarios.
| Market Scope | |
|---|---|
| Start Year | 2024 |
| Forecast Year | 2025-2034 |
| Start Value | $12.2 Billion |
| Forecast Value | $17.1 Billion |
| CAGR | 3.3% |
The move toward cleaner power alternatives is further accelerating the adoption of gas-powered engine systems. Based on fuel classification, the market is segmented into diesel-fired, gas-fired, dual-fuel, and other variants. Among these, the gas-fired reciprocating engine segment is projected to expand at a growth rate of over 4% through 2034. This surge is driven largely by the global emphasis on reducing carbon footprints and transitioning away from traditional fossil fuel dependency. Gas-fueled engines offer improved emissions performance and greater energy efficiency, which aligns with the increasing regulatory push for sustainable energy production. Their ability to integrate seamlessly with renewable energy systems also boosts their appeal in hybrid energy models.
In terms of power rating, the industry is broken down into several categories: 0.5 MW - 1 MW, over 1 MW - 2 MW, over 2 MW - 3.5 MW, over 3.5 MW - 5 MW, over 5 MW - 7.5 MW, and above 7.5 MW. Among these, engines rated between over 1 MW and 2 MW dominated the market in 2024, accounting for more than 35.3% of the total share. This specific capacity range strikes a balance between compact design and high output, making it an optimal choice for mid-size industrial plants, commercial facilities, and decentralized generation operations. The ability of these engines to serve in both peaking and base-load scenarios enhances their utilization across several application areas, promoting continued market traction.
The United States continues to play a pivotal role in the global market landscape. The country's reciprocating engine sector was valued at USD 5 billion in 2022, increasing to USD 5.2 billion in 2023 and reaching USD 5.4 billion in 2024. The expansion is being supported by rising energy demands, investments in energy resilience infrastructure, and the growing occurrence of weather-related disruptions that require robust and reactive power solutions. Additionally, the broad deployment of standby and distributed energy resources is encouraging the use of high-efficiency engine systems that can quickly respond to energy shortfalls and grid instability.
Market dynamics are also influenced by an evolving competitive landscape. The five leading companies in the space collectively control about 45% of the global market share. Competition is intensifying as manufacturers focus on improving fuel flexibility, enhancing engine durability, and expanding aftermarket service networks. Engine designs that support diesel, gas, and dual-fuel capabilities are gaining attention due to their adaptability to varying fuel supply conditions and operational requirements. Furthermore, as businesses place more emphasis on lifecycle performance and maintenance efficiency, manufacturers that offer comprehensive service packages and integrated digital monitoring solutions are poised to capture greater market opportunities.
Table of Contents
Chapter 1 Methodology & Scope
- 1.1 Research design
- 1.2 Market estimates & forecast parameters
- 1.3 Forecast calculation
- 1.4 Data sources
- 1.4.1 Primary
- 1.4.2 Secondary
- 1.4.2.1 Paid
- 1.4.2.2 Public
- 1.5 Market definitions
Chapter 2 Executive Summary
- 2.1 Industry synopsis, 2021 - 2034
Chapter 3 Industry Insights
- 3.1 Industry ecosystem analysis
- 3.2 Trump administration tariffs analysis
- 3.2.1 Impact on trade
- 3.2.1.1 Trade volume disruptions
- 3.2.1.2 Retaliatory measures
- 3.2.2 Impact on the industry
- 3.2.2.1 Supply-side impact (raw materials)
- 3.2.2.1.1 Price volatility in key materials
- 3.2.2.1.2 Supply chain restructuring
- 3.2.2.1.3 Production cost implications
- 3.2.2.2 Demand-side impact (selling price)
- 3.2.2.2.1 Price transmission to end markets
- 3.2.2.2.2 Market share dynamics
- 3.2.2.2.3 Consumer response patterns
- 3.2.2.1 Supply-side impact (raw materials)
- 3.2.3 Key companies impacted
- 3.2.4 Strategic industry responses
- 3.2.4.1 Supply chain reconfiguration
- 3.2.4.2 Pricing and product strategies
- 3.2.4.3 Policy engagement
- 3.2.5 Outlook and future considerations
- 3.2.1 Impact on trade
- 3.3 Regulatory landscape
- 3.4 Industry impact forces
- 3.4.1 Growth drivers
- 3.4.2 Industry pitfalls & challenges
- 3.5 Growth potential analysis
- 3.6 Porter's analysis
- 3.6.1 Bargaining power of suppliers
- 3.6.2 Bargaining power of buyers
- 3.6.3 Threat of new entrants
- 3.6.4 Threat of substitutes
- 3.7 PESTEL analysis
Chapter 4 Competitive Landscape, 2025
- 4.1 Introduction
- 4.2 Strategic dashboard
- 4.3 Strategic initiatives
- 4.4 Company market share analysis, 2024
- 4.5 Competitive benchmarking
- 4.6 Innovation & sustainability landscape
Chapter 5 Market Size and Forecast, By Fuel Type, 2021 - 2034 (USD Million & Units)
- 5.1 Key trends
- 5.2 Gas-fired
- 5.2.1 0.5 MW - 1 MW
- 5.2.2 > 1 MW - 2 MW
- 5.2.3 > 2 MW - 3.5 MW
- 5.2.4 > 3.5 MW - 5 MW
- 5.2.5 > 5 MW - 7.5 MW
- 5.2.6 > 7.5 MW
- 5.3 Diesel-fired
- 5.3.1 0.5 MW - 1 MW
- 5.3.2 > 1 MW - 2 MW
- 5.3.3 > 2 MW - 3.5 MW
- 5.3.4 > 3.5 MW - 5 MW
- 5.3.5 > 5 MW - 7.5 MW
- 5.3.6 > 7.5 MW
- 5.4 Dual fuel
- 5.4.1 0.5 MW - 1 MW
- 5.4.2 > 1 MW - 2 MW
- 5.4.3 > 2 MW - 3.5 MW
- 5.4.4 > 3.5 MW - 5 MW
- 5.4.5 > 5 MW - 7.5 MW
- 5.4.6 > 7.5 MW
- 5.5 Others
- 5.5.1 0.5 MW - 1 MW
- 5.5.2 > 1 MW - 2 MW
- 5.5.3 > 2 MW - 3.5 MW
- 5.5.4 > 3.5 MW - 5 MW
- 5.5.5 > 5 MW - 7.5 MW
- 5.5.6 > 7.5 MW
Chapter 6 Market Size and Forecast, By Rated Power, 2021 - 2034 (USD Million & Units)
- 6.1 Key trends
- 6.2 0.5 MW - 1 MW
- 6.3 > 1 MW - 2 MW
- 6.4 > 2 MW - 3.5 MW
- 6.5 > 3.5 MW - 5 MW
- 6.6 > 5 MW - 7.5 MW
- 6.7 > 7.5 MW
Chapter 7 Market Size and Forecast, By Application, 2021 - 2034 (USD Million & Units)
- 7.1 Key trends
- 7.2 Industrial
- 7.3 CHP
- 7.4 Energy & utility
- 7.5 Landfill & biogas
- 7.6 Oil & gas
- 7.7 Others
Chapter 8 Market Size and Forecast, By End Use, 2021 - 2034 (USD Million & Units)
- 8.1 Key trends
- 8.2 Backup
- 8.2.1 0.5 MW - 1 MW
- 8.2.2 > 1 MW - 2 MW
- 8.2.3 > 2 MW - 3.5 MW
- 8.2.4 > 3.5 MW - 5 MW
- 8.2.5 > 5 MW - 7.5 MW
- 8.2.6 > 7.5 MW
- 8.3 Prime power
- 8.3.1 0.5 MW - 1 MW
- 8.3.2 > 1 MW - 2 MW
- 8.3.3 > 2 MW - 3.5 MW
- 8.3.4 > 3.5 MW - 5 MW
- 8.3.5 > 5 MW - 7.5 MW
- 8.3.6 > 7.5 MW
Chapter 9 Market Size and Forecast, By Region, 2021 - 2034 (USD Million & Units)
- 9.1 Key trends
- 9.2 North America
- 9.2.1 U.S.
- 9.2.2 Canada
- 9.2.3 Mexico
- 9.3 Europe
- 9.3.1 UK
- 9.3.2 France
- 9.3.3 Germany
- 9.3.4 Russia
- 9.3.5 Italy
- 9.3.6 Spain
- 9.3.7 Netherlands
- 9.3.8 Denmark
- 9.3.9 Norway
- 9.4 Asia Pacific
- 9.4.1 China
- 9.4.2 India
- 9.4.3 Japan
- 9.4.4 South Korea
- 9.4.5 Australia
- 9.4.6 Thailand
- 9.4.7 Singapore
- 9.4.8 Indonesia
- 9.4.9 Malaysia
- 9.5 Middle East & Africa
- 9.5.1 UAE
- 9.5.2 Saudi Arabia
- 9.5.3 Qatar
- 9.5.4 Oman
- 9.5.5 Kuwait
- 9.5.6 Iran
- 9.5.7 Egypt
- 9.5.8 Turkey
- 9.5.9 Jordan
- 9.5.10 South Africa
- 9.6 Latin America
- 9.6.1 Brazil
- 9.6.2 Argentina
- 9.6.3 Chile
- 9.6.4 Peru
Chapter 10 Company Profiles
- 10.1 Ashok Leyland
- 10.2 Briggs & Stratton
- 10.3 Caterpillar
- 10.4 Cummins
- 10.5 Deere & Company
- 10.6 Deutz AG
- 10.7 Enerflex
- 10.8 Escorts Limited
- 10.9 GE Vernova
- 10.10 Guascor Energy
- 10.11 Kawasaki Heavy Industries
- 10.12 Kirloskar Oil Engines
- 10.13 Kohler Engines
- 10.14 MAN Energy Solutions
- 10.15 Mitsubishi Heavy Industries
- 10.16 Rolls-Royce
- 10.17 Scania
- 10.18 TRITON DURO
- 10.19 Wartsilä
- 10.20 YANMAR HOLDINGS
 柴油引擎市场按应用、功率输出、技术、冷却方式、汽缸数和排放气体标准划分-2025-2032年全球预测
 2025年全球柴油引擎市场报告2025年全球往復式发电发动机市场报告2025年原动机往復式发电机全球市场报告
 备用往復式发电发动机市场机会、成长动力、产业趋势分析及 2025 - 2034 年预测
 全球柴油引擎市场:2031 年预测
 柴油引擎:市场占有率分析、行业趋势和统计、成长预测(2025-2030 年)
 2030 年柴油引擎市场预测:按燃料类型、引擎类型、零件、应用和地区进行的全球分析全球备用往復式发电机引擎市场
 全球主要电源发电用往復式发动机市场:成长、展望与竞争分析(2025-2033)