


 |
市场调查报告书
商品编码
1750498
非易腐牛奶市场机会、成长动力、产业趋势分析及 2025 - 2034 年预测Non-Perishable Milk Market Opportunity, Growth Drivers, Industry Trend Analysis, and Forecast 2025 - 2034 |
||||||
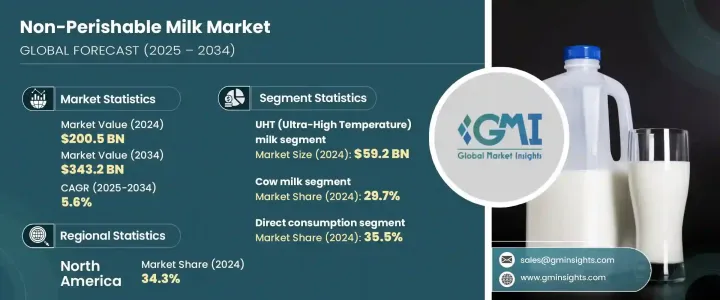
2024年,全球非易腐牛奶市场规模达2,005亿美元,预计到2034年将以5.6%的复合年增长率成长,达到3,432亿美元。这一增长主要源于人们对保质期更长、冷藏要求更低的乳製品日益增长的需求。非易腐牛奶已从缺乏冷藏设施地区的实用选择发展成为全球主流选择。消费者越来越倾向于选择便利、营养丰富且保质期较长的乳製品。随着都市化进程的加速和饮食偏好的转变,该产业正不断拓展其覆盖范围,涵盖不同的消费群。
人们对强化牛奶、有机牛奶和无乳糖牛奶日益增长的兴趣塑造了市场。随着製造商应对不断变化的健康和生活方式趋势,这些偏好正在重塑产品开发策略。技术创新,尤其是加工方法的创新,也促进了市场扩张。超高温(UHT)处理和高温短时(HTST)技术的进步,加上无菌包装,提高了非易腐牛奶的安全性、品质和保质期。这些因素促进了非易腐牛奶的分销和消费成长,尤其是在冷藏食品供应有限的地区。同时,人们对高钙饮食的认识不断提高,这促使人们形成了更高的牛奶消费模式。即使是植物性替代品也在非易腐食品领域占有一席之地,这反映出消费者对永续性和健康日益增长的重视。
| 市场范围 | |
|---|---|
| 起始年份 | 2024 |
| 预测年份 | 2025-2034 |
| 起始值 | 2005亿美元 |
| 预测值 | 3432亿美元 |
| 复合年增长率 | 5.6% |
就产品细分而言,非易腐牛奶市场包括超高温灭菌牛奶、淡奶、甜炼乳、奶粉等。其中,超高温灭菌牛奶在2024年占据主导地位,市占率为29.5%,价值592亿美元。其主导地位归功于其多功能性和无需冷藏即可长时间保鲜的能力,使其成为城乡居民的首选。奶粉和淡奶也已成熟,尤其是在价格实惠且需要长期储存的地区。甜炼乳在烹饪应用中仍然占有重要地位,儘管在某些地区,人们对健康的担忧略微抑制了其成长率。
依来源划分,市场可分为牛奶、羊奶、水牛奶、植物奶和其他奶类。 2024年,牛奶占整个市场的29.7%,预计到2034年将以5.3%的复合年增长率成长。牛奶持续受欢迎的原因是其提供超高温灭菌和奶粉两种形式,非常符合当前消费者对便利、即食乳製品的需求。羊奶正逐渐受到寻求乳糖不耐受友善或易消化替代品的消费者的青睐。同时,水牛奶因其较高的脂肪含量和地区偏好,仍保持着小众市场的吸引力。
不易腐的牛奶通路包括超市及大卖场、专卖店、便利商店、线上零售、餐饮服务网点、B2B直销等。 2024年,超市和大卖场占了最大的市场份额,达到31.5%。它们之所以受欢迎,是因为它们能够在一个地方提供种类繁多的产品,使其成为日常消费者的首选。专卖店因其高端产品,尤其是以健康为中心或植物基的牛奶,而越来越受到青睐。便利商店在满足单份或便携装牛奶的需求方面发挥关键作用。受送货上门的便利性和电商平台的扩张推动,线上零售正在快速成长。餐饮服务管道继续依赖超高温灭菌奶和奶粉来确保稳定供应和易于储存。面向企业的直销依然强劲,尤其是在机构和商业领域。其他分销方式包括自动贩卖机和以出口为重点的管道,这些管道正在帮助品牌开拓尚未开发的市场。
从地区来看,2024年北美占据了非易腐牛奶市场的最大份额,贡献了总收入的34.3%。由于消费者生活方式的转变以及对保质期较长的营养选择的兴趣日益浓厚,该地区市场对超高温灭菌牛奶和其他长效乳製品的接受度不断提高。欧洲紧跟在后,由于其便利性和对冷链的依赖较少,欧洲消费者对超高温灭菌牛奶的偏好也较为强烈。
拉克塔利斯国际公司、雀巢公司、恆天然合作集团有限公司、达能公司和Arla Foods等主要产业参与者在推动市场成长方面发挥了重要作用。它们的影响力在创新、加工技术和全球分销能力方面尤为明显。这些公司持续投资于产品开发,并扩大其影响力,以满足全球对非易腐乳製品日益增长的需求。
目录
第一章:方法论与范围
第二章:执行摘要
第三章:行业洞察
- 产业生态系统分析
- 影响价值链的因素
- 利润率分析
- 製造商
- 经销商
- 对贸易的影响
- 贸易量中断
- 报復措施
- 对产业的影响
- 供给侧影响(原料)
- 主要材料价格波动
- 供应链重组
- 生产成本影响
- 供给侧影响(原料)
- 需求面影响(销售价格)
- 价格传导至终端市场
- 市占率动态
- 消费者反应模式
- 受影响的主要公司
- 策略产业反应
- 供应链重组
- 定价和产品策略
- 政策参与
- 展望与未来考虑
- 供应商格局
- 利润率分析
- 重要新闻和倡议
- 监管框架和标准
- 食品安全法规
- 标籤要求
- 品质标准
- 进出口法规
- 有机和清洁标籤认证
- 衝击力
- 成长动力
- 都市化与生活方式的演变
- 加工和包装技术的进步
- 零售扩张和政府支持
- 产业陷阱与挑战
- 供应链中断
- 经济不确定性
- 市场机会
- 成长动力
- 产品概述
- 不易腐坏的牛奶加工技术
- 延长保存期限的方法
- 营养成分比较
- 感官特征
- 製造流程分析
- 超高温灭菌处理
- 蒸发和冷凝
- 喷雾干燥
- 无菌包装
- 品质控制流程
- 原料分析与采购策略
- 定价分析
- 永续性和环境影响评估
- 成长潜力分析
- 波特的分析
- PESTEL分析
第四章:竞争格局
- 介绍
- 市占率分析
- 战略框架
- 併购
- 合资与合作
- 新产品开发
- 扩张策略
- 竞争基准测试
- 供应商格局
- 竞争定位矩阵
- 战略仪表板
- 品牌定位与消费者认知分析
- 新参与者的市场进入策略
- 自有品牌分析与策略
第五章:市场估计与预测:依产品类型,2021 - 2034 年
- 主要趋势
- UHT(超高温)牛奶
- 全脂超高温灭菌牛奶
- 半脱脂UHT牛奶
- 脱脂超高温灭菌牛奶
- 调味UHT牛奶
- 淡奶
- 全脂淡奶
- 脱脂淡奶
- 其他的
- 甜炼乳
- 普通炼乳
- 调味甜炼乳
- 其他的
- 甜炼乳
- 普通炼乳
- 调味甜炼乳
- 其他的
- 奶粉
- 全脂奶粉
- 脱脂奶粉
- 加脂奶粉
- 婴儿配方奶粉
- 其他的
- 其他的
第六章:市场估计与预测:按来源,2021 - 2034 年
- 主要趋势
- 牛奶
- 山羊乳
- 水牛奶
- 植物性替代品
- 豆浆
- 杏仁奶
- 燕麦奶
- 椰奶
- 其他的
- 其他的
第七章:市场估计与预测:依脂肪含量,2021 - 2034 年
- 主要趋势
- 全脂(脂肪含量≥3.5%)
- 半脱脂/低脂(脂肪含量 1.5-1.8%)
- 脱脂/低脂(脂肪含量≤0.5%)
- 无脂肪(0%脂肪)
- 脂肪含量可变
第八章:市场估计与预测:按包装类型,2021 - 2034 年
- 主要趋势
- 利乐包/无菌纸盒
- 砖纸箱
- 山墙顶纸箱
- 其他的
- 罐头
- 钢罐
- 铝罐
- 瓶子
- 玻璃瓶
- 塑胶瓶
- 袋装
- 盒中袋
- 罐装和袋装(用于奶粉)
- 其他的
第九章:市场估计与预测:按配销通路,2021 - 2034 年
- 主要趋势
- 超市和大卖场
- 专卖店
- 便利商店
- 网路零售
- 公司网站
- 电子商务平台
- 订阅服务
- 餐饮服务
- 饭店和餐厅
- 咖啡馆和麵包店
- 机构餐饮
- 直销(B2B)
- 其他的
第 10 章:市场估计与预测:依最终用途,2021 年至 2034 年
- 主要趋势
- 直接消费
- 食品加工
- 烘焙和糖果
- 乳製品
- 婴儿食品
- 预製食品
- 其他的
- 饮料业
- 咖啡和茶
- 冰沙和奶昔
- 其他的
- 食品服务业
- 营养补充品
- 其他的
第 11 章:市场估计与预测:按地区,2021 年至 2034 年
- 主要趋势
- 北美洲
- 我们
- 加拿大
- 欧洲
- 德国
- 英国
- 法国
- 西班牙
- 义大利
- 荷兰
- 欧洲其他地区
- 亚太地区
- 中国
- 印度
- 日本
- 澳洲
- 韩国
- 亚太其他地区
- 拉丁美洲
- 巴西
- 墨西哥
- 阿根廷
- 拉丁美洲其他地区
- 中东和非洲
- 沙乌地阿拉伯
- 南非
- 阿联酋
- 中东和非洲其他地区
第十二章:公司简介
- Nestle SA
- Danone SA
- Lactalis Group
- Fonterra Co-operative Group Limited
- FrieslandCampina
- Arla Foods amba
- Dean Foods (Dairy Farmers of America)
- Saputo Inc.
- Parmalat SpA (Lactalis)
- Amul (Gujarat Cooperative Milk Marketing Federation)
- China Mengniu Dairy Company Limited
- Inner Mongolia Yili Industrial Group Co., Ltd.
- Morinaga Milk Industry Co., Ltd.
- Meiji Holdings Co., Ltd.
- Savencia Fromage & Dairy
- DMK Deutsches Milchkontor GmbH
- Muller Group
- Dairy Farmers of America, Inc.
- Almarai Company
- Grupo LALA
- Vinamilk (Vietnam Dairy Products JSC)
- Borden Dairy Company
- Dairy Partners Americas (DPA)
- Darigold, Inc.
- California Dairies, Inc.
- Sodiaal
- Glanbia plc
- Schreiber Foods Inc.
- Land O'Lakes, Inc.
- Dairy Crest Group plc (Saputo)
The Global Non-Perishable Milk Market was valued at USD 200.5 billion in 2024 and is estimated to grow at a CAGR of 5.6% to reach USD 343.2 billion by 2034. This growth is largely fueled by the increasing demand for milk products with extended shelf life and minimal refrigeration requirements. Non-perishable milk has evolved from being a practical option in regions lacking cold storage to a mainstream choice worldwide. Consumers are gravitating toward options that offer convenience, nutritional value, and longer usability. With rising urbanization and shifting dietary preferences, the industry continues to expand its reach across diverse consumer groups.
The market has been shaped by growing interest in fortified, organic, and lactose-free milk variants. These preferences are reshaping product development strategies as manufacturers respond to changing health and lifestyle trends. Technological innovations, especially in processing methods, are also contributing to market expansion. Advancements in Ultra-High Temperature (UHT) treatment and high-temperature short-time (HTST) techniques, combined with aseptic packaging, have improved the safety, quality, and durability of non-perishable milk. These factors are enabling broader distribution and increased consumption, especially in areas with limited access to refrigerated goods. In parallel, there's a rise in awareness regarding calcium-rich diets, which plays into higher milk consumption patterns. Even plant-based alternatives are gaining space in the non-perishable segment, reflecting evolving consumer priorities toward sustainability and wellness.
| Market Scope | |
|---|---|
| Start Year | 2024 |
| Forecast Year | 2025-2034 |
| Start Value | $200.5 Billion |
| Forecast Value | $343.2 Billion |
| CAGR | 5.6% |
In terms of product segmentation, the non-perishable milk market includes UHT milk, evaporated milk, sweetened condensed milk, powdered milk, and others. Among these, UHT milk led the category in 2024 with a market share of 29.5%, representing USD 59.2 billion. Its dominance is attributed to its versatility and ability to remain fresh without refrigeration for extended periods, making it a preferred option in both urban and rural settings. Powdered and evaporated variants are also well-established, particularly where affordability and long-term storage are essential. Sweetened condensed milk maintains its relevance in culinary applications, though health concerns are slightly dampening its growth rate in some areas.
When evaluated by source, the market is segmented into cow milk, goat milk, buffalo milk, plant-based milk, and others. Cow milk accounted for 29.7% of the total market in 2024 and is expected to grow at a CAGR of 5.3% through 2034. Its continued popularity is supported by its availability in UHT and powdered forms, which align well with current consumer demands for convenient, ready-to-use dairy options. Goat milk is steadily gaining traction among consumers seeking lactose-intolerant-friendly or easily digestible alternatives. Meanwhile, buffalo milk retains niche appeal due to its higher fat content and regional preferences.
Distribution channels for non-perishable milk include supermarkets and hypermarkets, specialty stores, convenience stores, online retail, food service outlets, direct B2B sales, and others. Supermarkets and hypermarkets commanded the largest share of the market in 2024, accounting for 31.5%. Their popularity stems from their ability to offer a wide selection of products in one location, making them a go-to choice for everyday consumers. Specialty stores are increasingly favored for premium offerings, especially for health-centric or plant-based milk variants. Convenience stores play a key role in fulfilling demand for single-serve or on-the-go formats. Online retail is experiencing rapid growth, driven by the convenience of doorstep delivery and the expansion of e-commerce platforms. Food service channels continue to rely on UHT and powdered milk for consistent supply and ease of storage. Direct sales to businesses remain robust, particularly in institutional and commercial sectors. Additional distribution methods include vending and export-focused channels that are helping brands tap into untapped markets.
Regionally, North America held the largest share of the non-perishable milk market in 2024, contributing 34.3% of the total revenue. The regional market has seen increasing adoption of UHT milk and other long-lasting dairy products, thanks to evolving consumer lifestyles and greater interest in shelf-stable nutrition options. Europe follows closely with a strong preference for UHT milk due to its convenience and reduced reliance on cold chains.
Major industry players such as Lactalis International, Nestle S.A., Fonterra Co-operative Group Limited, Danone S.A., and Arla Foods are instrumental in driving market growth. Their influence is particularly evident in innovation, processing technology, and global distribution capabilities. These companies are consistently investing in product development and expanding their presence to meet the growing global demand for non-perishable milk products.
Table of Contents
Chapter 1 Methodology & Scope
- 1.1 Methodology and scope
- 1.2 Research methodology
- 1.3 Research scope & assumptions
- 1.4 List of data sources
- 1.5 Market estimation technique
- 1.6 Research limitations
Chapter 2 Executive Summary
- 2.1 Industry synopsis, 2021 - 2034
Chapter 3 Industry Insights
- 3.1 Industry ecosystem analysis
- 3.1.1 Factor affecting the value chain
- 3.1.2 Profit margin analysis
- 3.1.3 Manufacturers
- 3.1.4 Distributors
- 3.1.5 Impact on trade
- 3.1.6 Trade volume disruptions
- 3.2 Retaliatory measures
- 3.3 Impact on the industry
- 3.3.1 Supply-side impact (Raw Materials)
- 3.3.1.1 Price volatility in key materials
- 3.3.1.2 Supply chain restructuring
- 3.3.1.3 Production cost implications
- 3.3.1 Supply-side impact (Raw Materials)
- 3.4 Demand-side impact (Selling Price)
- 3.4.1 Price transmission to end markets
- 3.4.2 Market share dynamics
- 3.4.3 Consumer response patterns
- 3.5 Key companies impacted
- 3.6 Strategic industry responses
- 3.6.1 Supply chain reconfiguration
- 3.6.2 Pricing and product strategies
- 3.6.3 Policy engagement
- 3.7 Outlook and future considerations
- 3.8 Supplier landscape
- 3.9 Profit margin analysis
- 3.10 Key news & initiatives
- 3.11 Regulatory framework and standards
- 3.11.1 Food safety regulations
- 3.11.2 Labeling requirements
- 3.11.3 Quality standards
- 3.11.4 Import/export regulations
- 3.11.5 Organic & clean label certifications
- 3.12 Impact forces
- 3.12.1 Growth drivers
- 3.12.1.1 Urbanization and evolving lifestyles
- 3.12.1.2 Technological advancements in processing and packaging
- 3.12.1.3 Retail expansion and government support
- 3.12.2 Industry pitfalls & challenges
- 3.12.2.1 Supply chain disruptions
- 3.12.2.2 Economic uncertainty
- 3.12.3 Market opportunities
- 3.12.1 Growth drivers
- 3.13 Product overview
- 3.13.1 Nonperishable milk processing technologies
- 3.13.2 Shelf-life extension methods
- 3.13.3 Nutritional profile comparison
- 3.13.4 Sensory characteristics
- 3.14 Manufacturing process analysis
- 3.14.1 UHT processing
- 3.14.2 Evaporation & Condensation
- 3.14.3 Spray drying
- 3.14.4 Aseptic packaging
- 3.14.5 Quality control processes
- 3.15 Raw material analysis & procurement strategies
- 3.16 Pricing analysis
- 3.17 Sustainability & environmental impact assessment
- 3.18 Growth potential analysis
- 3.19 Porter's analysis
- 3.20 PESTEL analysis
Chapter 4 Competitive Landscape, 2024
- 4.1 Introduction
- 4.2 Market share analysis
- 4.3 Strategic framework
- 4.3.1 Mergers & acquisitions
- 4.3.2 Joint ventures & collaborations
- 4.3.3 New product developments
- 4.3.4 Expansion strategies
- 4.4 Competitive benchmarking
- 4.5 Vendor landscape
- 4.6 Competitive positioning matrix
- 4.7 Strategic dashboard
- 4.8 Brand positioning & consumer perception analysis
- 4.9 Market entry strategies for new players
- 4.10 Private label analysis & strategies
Chapter 5 Market Estimates and Forecast, By Product Type, 2021 - 2034 (USD Billion) (Kilo Tons)
- 5.1 Key trends
- 5.2 UHT (Ultra-High Temperature) milk
- 5.2.1 Whole UHT milk
- 5.2.2 Semi-skimmed UHT milk
- 5.2.3 Skimmed UHT milk
- 5.2.4 Flavored UHT milk
- 5.3 Evaporated milk
- 5.3.1 Whole evaporated milk
- 5.3.2 Skimmed evaporated milk
- 5.3.3 Others
- 5.4 Sweetened condensed milk
- 5.4.1 Regular sweetened condensed milk
- 5.4.2 Flavored sweetened condensed milk
- 5.4.3 Others
- 5.5 Sweetened condensed milk
- 5.5.1 Regular sweetened condensed milk
- 5.5.2 Flavored sweetened condensed milk
- 5.5.3 Others
- 5.6 Powdered milk
- 5.6.1 Whole milk powder
- 5.6.2 Skimmed milk powder
- 5.6.3 Fat-filled milk powder
- 5.6.4 Infant formula
- 5.6.5 Others
- 5.7 Others
Chapter 6 Market Estimates and Forecast, By Source, 2021 - 2034 (USD Billion) (Kilo Tons)
- 6.1 Key trends
- 6.2 Cow milk
- 6.3 Goat milk
- 6.4 Buffalo milk
- 6.5 Plant-based alternatives
- 6.5.1 Soy milk
- 6.5.2 Almond milk
- 6.5.3 Oat milk
- 6.5.4 Coconut milk
- 6.5.5 Others
- 6.6 Others
Chapter 7 Market Estimates and Forecast, By Fat Content, 2021 - 2034 (USD Billion) (Kilo Tons)
- 7.1 Key trends
- 7.2 Whole/full fat (≥3.5% Fat)
- 7.3 Semi-skimmed/reduced fat (1.5-1.8% Fat)
- 7.4 Skimmed/low fat (≤0.5% Fat)
- 7.5 Fat-free (0% Fat)
- 7.6 Variable fat content
Chapter 8 Market Estimates and Forecast, By Packaging Type, 2021 - 2034 (USD Billion) (Kilo Tons)
- 8.1 Key trends
- 8.2 Tetra packs/aseptic cartons
- 8.2.1 Brick cartons
- 8.2.2 Gable top cartons
- 8.2.3 Others
- 8.3 Cans
- 8.3.1 Steel cans
- 8.3.2 Aluminum cans
- 8.4 Bottles
- 8.4.1 Glass bottles
- 8.4.2 Plastic bottles
- 8.5 Pouches
- 8.6 Bag-in-box
- 8.7 Tins & sachets (for Powdered Milk)
- 8.8 Others
Chapter 9 Market Estimates and Forecast, By Distribution Channel, 2021 - 2034 (USD Billion) (Kilo Tons)
- 9.1 Key trends
- 9.2 Supermarkets & hypermarkets
- 9.3 Specialty stores
- 9.4 Convenience stores
- 9.5 Online retail
- 9.5.1 Company websites
- 9.5.2 E-commerce platforms
- 9.5.3 Subscription services
- 9.6 Foodservice
- 9.6.1 Hotels & restaurants
- 9.6.2 Cafes & bakeries
- 9.6.3 Institutional catering
- 9.7 Direct sales (B2B)
- 9.8 Others
Chapter 10 Market Estimates and Forecast, By End Use, 2021 - 2034 (USD Billion) (Kilo Tons)
- 10.1 Key trends
- 10.2 Direct consumption
- 10.3 Food processing
- 10.3.1 Bakery & confectionery
- 10.3.2 Dairy products
- 10.3.3 Infant food
- 10.3.4 Prepared foods
- 10.3.5 Others
- 10.4 Beverage industry
- 10.4.1 Coffee & tea
- 10.4.2 Smoothies & shakes
- 10.4.3 Others
- 10.5 Food service industry
- 10.6 Nutritional supplements
- 10.7 Others
Chapter 11 Market Estimates and Forecast, By Region, 2021 - 2034 (USD Billion) (Kilo Tons)
- 11.1 Key trends
- 11.2 North America
- 11.2.1 U.S.
- 11.2.2 Canada
- 11.3 Europe
- 11.3.1 Germany
- 11.3.2 UK
- 11.3.3 France
- 11.3.4 Spain
- 11.3.5 Italy
- 11.3.6 Netherlands
- 11.3.7 Rest of Europe
- 11.4 Asia Pacific
- 11.4.1 China
- 11.4.2 India
- 11.4.3 Japan
- 11.4.4 Australia
- 11.4.5 South Korea
- 11.4.6 Rest of Asia Pacific
- 11.5 Latin America
- 11.5.1 Brazil
- 11.5.2 Mexico
- 11.5.3 Argentina
- 11.5.4 Rest of Latin America
- 11.6 Middle East and Africa
- 11.6.1 Saudi Arabia
- 11.6.2 South Africa
- 11.6.3 UAE
- 11.6.4 Rest of Middle East and Africa
Chapter 12 Company Profiles
- 12.1 Nestle S.A.
- 12.2 Danone S.A.
- 12.3 Lactalis Group
- 12.4 Fonterra Co-operative Group Limited
- 12.5 FrieslandCampina
- 12.6 Arla Foods amba
- 12.7 Dean Foods (Dairy Farmers of America)
- 12.8 Saputo Inc.
- 12.9 Parmalat S.p.A. (Lactalis)
- 12.10 Amul (Gujarat Cooperative Milk Marketing Federation)
- 12.11 China Mengniu Dairy Company Limited
- 12.12 Inner Mongolia Yili Industrial Group Co., Ltd.
- 12.13 Morinaga Milk Industry Co., Ltd.
- 12.14 Meiji Holdings Co., Ltd.
- 12.15 Savencia Fromage & Dairy
- 12.16 DMK Deutsches Milchkontor GmbH
- 12.17 Muller Group
- 12.18 Dairy Farmers of America, Inc.
- 12.19 Almarai Company
- 12.20 Grupo LALA
- 12.21 Vinamilk (Vietnam Dairy Products JSC)
- 12.22 Borden Dairy Company
- 12.23 Dairy Partners Americas (DPA)
- 12.24 Darigold, Inc.
- 12.25 California Dairies, Inc.
- 12.26 Sodiaal
- 12.27 Glanbia plc
- 12.28 Schreiber Foods Inc.
- 12.29 Land O'Lakes, Inc.
- 12.30 Dairy Crest Group plc (Saputo)


