


 |
市场调查报告书
商品编码
1782110
线上旅行社市场机会、成长动力、产业趋势分析及 2025 - 2034 年预测Online Travel Agency Market Opportunity, Growth Drivers, Industry Trend Analysis, and Forecast 2025 - 2034 |
||||||
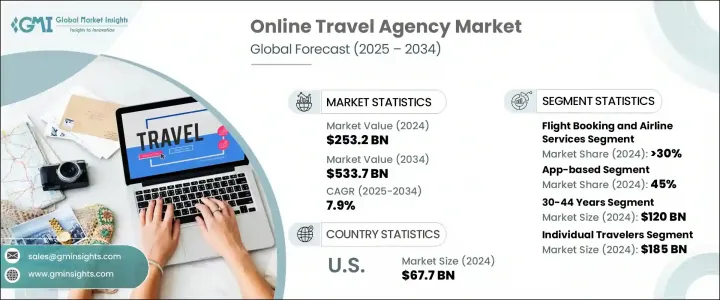
2024年,全球线上旅行社市场规模达2,532亿美元,预计到2034年将以7.9%的复合年增长率成长,达到5,337亿美元。这一强劲势头主要得益于互联网普及率的提高、智慧型手机的广泛使用,以及旅行者行为的转变,他们更青睐便捷的数位化优先预订体验。多年来,线上旅行社透过为使用者提供单一平台,直接存取包括航班、住宿、租车和旅游体验在内的各种旅游服务,彻底改变了传统的旅游规划流程。
随着消费者期望的不断演变,旅客如今需要无缝衔接、快速且灵活的自助服务。全球流动性的不断增强,加上各地区用户数位化程度的不断提升,进一步加速了线上旅游服务的普及。可支配收入的成长、对个人化旅行体验的更多关注,以及年轻一代对探索新目的地的兴趣日益浓厚,也促进了该行业的强劲增长。数位化互动已成为人们旅行方式的核心支柱,这为持续投资于用户体验、在地化和客户保留策略的OTA供应商带来了更广泛的市场机会。
| 市场范围 | |
|---|---|
| 起始年份 | 2024 |
| 预测年份 | 2025-2034 |
| 起始值 | 2532亿美元 |
| 预测值 | 5337亿美元 |
| 复合年增长率 | 7.9% |
在服务类别中,航班预订和航空公司服务占2024年OTA市场总额的30%以上,创造了超过800亿美元的收入。这些服务仍然是OTA流量的主要动力,因为旅客通常从航班开始预订旅程。随着全球航空公司拓展国内和国际航线,越来越多的用户转向数位平台比较价格、即时查看航班时刻表并获取促销票价。 OTA透过提供灵活的搜寻选项、即时票价更新和客製化票价套餐等智慧工具,持续优化航班预订体验。包括新兴分销标准实施在内的最新进展,使平台能够展示丰富的内容,例如座位布局、额外服务选项和个人化优惠,最终提升客户参与度并增加转换率。
根据预订模式,市场可细分为基于应用程式、基于网路、语音和对话式预订以及社交媒体和新兴管道。基于应用程式的细分市场在 2024 年占据 45% 的市场份额,占据主导地位,预计 2025 年至 2034 年的复合年增长率为 8.5%。全球超过 70 亿人使用智慧型手机,对智慧型手机的依赖日益加深,行动应用程式已成为旅游计画的首选介面。旅行者越来越多地使用应用程序,不仅预订航班和酒店,还管理行程变更、接收即时更新和解锁独家优惠。行动平台提供额外的功能,例如基于位置的通知、离线存取预订和客製化的忠诚度计划,使其比传统的基于网路的平台更具吸引力。这种个人化的参与在推动重复使用和客户满意度方面发挥了关键作用。
从终端用户来看,OTA市场分为个人旅客和商务旅客。 2024年,个人旅行者占据主导地位,为市场贡献了约1850亿美元的收入。灵活性、透明度和可自订选项继续吸引这一群体,尤其是在后疫情时代,单人旅行、工作休閒融合的长假以及即兴出游等趋势日益盛行。消费者越来越青睐数位化工具,这些工具使他们能够根据自己的意愿规划行程、进行即时预订、查看同行点评,并接收人工智慧产生的旅游建议。 OTA正利用这一趋势,提供动态打包、个人化促销和互动式介面,从而简化旅行规划体验。
从地区来看,美国在2024年占据了北美OTA市场75%以上的份额,创造了677亿美元的收入。较高的数位素养、广泛的网路存取以及强劲的电子商务应用,使美国成为线上旅游预订的领先市场。美国在旅游服务领域率先采用新兴技术,树立了全球标竿。预测定价、人工智慧行程规划器和多平台整合等先进功能正在不断推出,以满足精通科技的旅客的期望。
OTA 供应商也在透过策略性技术投资、新创公司收购以及与旅游服务提供者的合作来完善其数位生态系统。语音预订、智慧聊天机器人和即时动态定价引擎等创新技术正成为提升客户旅程体验的标准配置。该行业也在响应日益增长的可持续旅行需求,整合环保住宿、低排放交通和文化沉浸式体验的推荐。这些改进,加上在资料安全、行程个人化和综合旅游套餐方面的持续努力,正在重塑人们透过线上平台预订和体验旅行的方式。
目录
第一章:方法论与范围
第二章:执行摘要
第三章:行业洞察
- 产业生态系统分析
- 供应商概况
- 利润率
- 成本结构
- 每个阶段的增值
- 影响价值链的因素
- 中断
- 分销通路和行销策略
- 产业衝击力
- 成长动力
- 自助游的偏好日益增长
- 可支配所得和旅游支出增加
- 网路和智慧型手机普及率不断上升
- 预订平台和服务的技术进步
- 产业陷阱与挑战
- 资料隐私和安全问题
- 复杂的预订和取消政策
- 市场机会
- 个性化和人工智慧驱动的旅行解决方案兴起
- 新兴市场的扩张
- 成长动力
- 成长潜力分析
- 监管格局
- 北美洲
- 欧洲
- 亚太地区
- 拉丁美洲
- 中东和非洲
- 波特的分析
- PESTEL分析
- 技术和创新格局
- 当前技术趋势
- 新兴技术
- 永续性和负责任的旅行
- 永续旅游平台开发
- 碳足迹追踪和抵消
- 航班碳排放计算器集成
- 碳补偿计划合作伙伴关係
- 永续的交通选择
- 绿色旅游建议
- 环保住宿推广
- 绿色认证过滤
- 永续的酒店合作伙伴关係
- 节能物业推广
- 本地和负责任的旅游
- 永续旅游内容与教育
- 负责任的旅游指南
- 环境影响意识
- 当地社区支持计划
- 野生动物和保育旅游
- 碳足迹追踪和抵消
- 企业社会责任(CSR)
- 环境永续性倡议
- 碳中和运营
- 再生能源的使用
- 减少废弃物计划
- 可持续的办公室实践
- 社会影响力与社区发展
- 当地社区支持计划
- 教育和技能发展
- 多元化和包容性倡议
- 慈善捐赠和志愿服务
- 道德商业行为
- 公平劳动实践
- 供应商行为准则
- 反腐败政策
- 透明的报告标准
- 环境永续性倡议
- 永续旅游平台开发
- 专利分析
- 用例
第四章:竞争格局
- 介绍
- 公司市占率分析
- 北美洲
- 欧洲
- 亚太地区
- 拉丁美洲
- 中东和非洲
- 竞争定位矩阵
- 战略展望矩阵
- 关键进展
- 併购
- 伙伴关係与合作
- 新产品发布
- 扩张计划和资金
第五章:市场估计与预测:按服务,2021 - 2034 年
- 主要趋势
- 住宿预订服务
- 饭店预订平台
- 另类住宿平台
- 长期住宿和公司住房
- 航班预订和航空服务
- 国内航班预订
- 国际航班预订
- 辅助服务及附加服务
- 地面交通和汽车租赁
- 汽车租赁服务
- 替代交通
- 多式联运
- 活动、体验和旅游
- 旅游和观光
- 娱乐和活动
- 美食和餐饮体验
- 旅行套餐和组合
- 航班和酒店套餐
- 全包度假套餐
- 客製化和个人化包装
第六章:市场估计与预测:以预订方式,2021 年至 2034 年
- 主要趋势
- 基于应用程式
- 基于网路
- 语音和对话预订
- 社群媒体和新兴管道
第七章:市场估计与预测:依年龄段,2021 - 2034 年
- 主要趋势
- 最长 29 年
- 30至44岁
- 45至59岁
- 60岁以上
第八章:市场估计与预测:按旅行者划分,2021 年至 2034 年
- 主要趋势
- 休閒旅客
- 商务旅客
- 娱乐、体育和活动旅行者
- 教育旅行者
- 其他的
第九章:市场估计与预测:依商业模式,2021 - 2034 年
- 主要趋势
- 基于佣金的模式
- 商家模式
- 广告和行销收入
- 订阅和会员模式
第十章:市场估计与预测:依最终用途,2021 - 2034 年
- 主要趋势
- 个人旅行者
- 商务旅客
第 11 章:市场估计与预测:按地区,2021 年至 2034 年
- 北美洲
- 我们
- 加拿大
- 欧洲
- 英国
- 德国
- 法国
- 义大利
- 西班牙
- 俄罗斯
- 北欧人
- 亚太地区
- 中国
- 印度
- 日本
- 韩国
- 澳洲
- 东南亚
- 拉丁美洲
- 巴西
- 墨西哥
- 阿根廷
- 智利
- MEA
- 南非
- 沙乌地阿拉伯
- 阿联酋
第十二章:公司简介
- Agoda Company
- Airbnb
- Almosafer
- Booking Holding
- Cleartrip
- Despegar.com
- eDreams ODIGEO
- Expedia
- Hays Travel
- Lastminute.com Group
- MakeMyTrip
- Rakuten Travel
- Skyscanner
- Tongcheng Travel Holdings
- Traveloka
- Trip.com Group
- Tripadvisor
- Trivago NV
- Webjet
- Yatra Online
The Global Online Travel Agency Market was valued at USD 253.2 billion in 2024 and is estimated to grow at a CAGR of 7.9% to reach USD 533.7 billion by 2034. This strong momentum is primarily fueled by growing internet penetration, the widespread use of smartphones, and a shift in traveler behavior favoring convenient, digital-first booking experiences. Over the years, OTAs have transformed the traditional travel planning process by offering users direct access to a wide range of travel services-including flights, accommodations, car rentals, and tour experiences-all from a single platform.
As consumer expectations continue to evolve, travelers now demand seamless, self-service options that are both fast and flexible. Increasing global mobility, paired with the digital maturity of users across regions, has further accelerated the adoption of online travel services. The rise in discretionary income, greater focus on personalized travel experiences, and the growing interest among younger demographics in exploring new destinations also contribute to the robust growth of this sector. Digital engagement has become a central pillar in how people approach travel, leading to broader market opportunities for OTA providers who continue to invest in user experience, localization, and customer retention strategies.
| Market Scope | |
|---|---|
| Start Year | 2024 |
| Forecast Year | 2025-2034 |
| Start Value | $253.2 Billion |
| Forecast Value | $533.7 Billion |
| CAGR | 7.9% |
Among the service categories, flight booking and airline services accounted for more than 30% of the total OTA market in 2024, generating over USD 80 billion in revenue. These services remain a primary driver of OTA traffic as travelers often begin their booking journey with flights. With global airlines expanding their domestic and international routes, users are increasingly turning to digital platforms to compare prices, view schedules in real-time, and access promotional fares. OTAs continue to optimize the flight booking experience by offering smart tools like flexible search options, real-time fare updates, and customized fare bundles. Recent advancements, including the implementation of emerging distribution standards, have allowed platforms to showcase rich content like seat layouts, extra service options, and personalized deals, which ultimately improve customer engagement and increase conversions.
The market is segmented by booking mode into app-based, web-based, voice and conversational booking, and social media and emerging channels. The app-based segment led the market with a 45% share in 2024 and is forecast to grow at a CAGR of 8.5% from 2025 to 2034. The growing reliance on smartphones-used by over 7 billion people globally-has made mobile apps the go-to interface for trip planning. Travelers are increasingly using apps not just to book flights and hotels but also to manage itinerary changes, receive real-time updates, and unlock exclusive offers. Mobile platforms offer additional functionality such as location-based notifications, offline access to bookings, and customized loyalty programs, making them more appealing than traditional web-based platforms. This personalized engagement has played a critical role in driving repeat usage and customer satisfaction.
In terms of end use, the OTA market is divided into individual and corporate travelers. Individual travelers were the dominant segment in 2024, contributing approximately USD 185 billion to the market. Flexibility, transparency, and customizable options continue to attract this segment, particularly in a post-pandemic world where trends like solo travel, extended vacations blending work and leisure, and spontaneous getaways have become more common. Consumers increasingly prefer digital tools that allow them to plan trips on their own terms, access instant bookings, view peer reviews, and receive AI-generated travel suggestions. OTAs are capitalizing on this trend by offering dynamic packaging, personalized promotions, and interactive interfaces that simplify the travel planning experience.
Regionally, the United States held over 75% of the North American OTA market in 2024, generating USD 67.7 billion in revenue. High digital literacy, widespread internet access, and strong e-commerce adoption make the US a leading market for online travel booking. The country's early embrace of emerging technologies in travel services has set a global benchmark. Advanced features such as predictive pricing, AI trip planners, and multi-platform integration are being continuously rolled out to meet the expectations of tech-savvy travelers.
OTA providers are also refining their digital ecosystems through strategic technology investments, startup acquisitions, and partnerships with travel service providers. Innovations such as voice-activated booking, intelligent chatbots, and real-time dynamic pricing engines are becoming standard offerings to enhance customer journeys. The industry is also responding to the increasing demand for sustainable travel options, integrating recommendations for eco-conscious accommodations, low-emission transportation, and cultural immersion experiences. These enhancements, combined with ongoing efforts in data security, trip personalization, and integrated travel packages, are reshaping how people book and experience travel through online platforms.
Table of Contents
Chapter 1 Methodology & Scope
- 1.1 Market scope and definition
- 1.2 Research design
- 1.2.1 Research approach
- 1.2.2 Data collection methods
- 1.3 Data mining sources
- 1.3.1 Global
- 1.3.2 Regional/Country
- 1.4 Base estimates and calculations
- 1.4.1 Base year calculation
- 1.4.2 Key trends for market estimation
- 1.5 Primary research and validation
- 1.5.1 Primary sources
- 1.6 Forecast model
- 1.7 Research assumptions and limitations
Chapter 2 Executive Summary
- 2.1 Industry synopsis, 2021 - 2034
- 2.2 Key market trends
- 2.2.1 Regional
- 2.2.2 Service
- 2.2.3 Mode of booking
- 2.2.4 Age group
- 2.2.5 Traveler
- 2.2.6 Business model
- 2.2.7 End use
- 2.3 TAM Analysis, 2025-2034
- 2.4 CXO perspectives: Strategic imperatives
- 2.4.1 Key decision points for industry executives
- 2.4.2 Critical success factors for market players
- 2.5 Future outlook and strategic recommendations
Chapter 3 Industry Insights
- 3.1 Industry ecosystem analysis
- 3.1.1 Supplier Landscape
- 3.1.2 Profit Margin
- 3.1.3 Cost structure
- 3.1.4 Value addition at each stage
- 3.1.5 Factor affecting the value chain
- 3.1.6 Disruptions
- 3.1.7 Distribution channels and marketing strategies
- 3.2 Industry impact forces
- 3.2.1 Growth drivers
- 3.2.1.1 Growing preference for self-travel
- 3.2.1.2 Increased disposable income and travel spending
- 3.2.1.3 Rising internet and smartphone penetration
- 3.2.1.4 Technological advancements in booking platforms and services
- 3.2.2 Industry pitfalls and challenges
- 3.2.2.1 Data privacy and security concerns
- 3.2.2.2 Complex booking and cancellation policies
- 3.2.3 Market opportunities
- 3.2.3.1 Rise in personalized and AI-driven travel solutions
- 3.2.3.2 Expansion in emerging markets
- 3.2.1 Growth drivers
- 3.3 Growth potential analysis
- 3.4 Regulatory landscape
- 3.4.1 North America
- 3.4.2 Europe
- 3.4.3 Asia Pacific
- 3.4.4 Latin America
- 3.4.5 Middle East & Africa
- 3.5 Porter’s analysis
- 3.6 PESTEL analysis
- 3.7 Technology and innovation landscape
- 3.7.1 Current technologies trends
- 3.7.2 Emerging technologies
- 3.8 Sustainability and responsible travel
- 3.8.1 Sustainable travel platform development
- 3.8.1.1 Carbon footprint tracking and offsetting
- 3.8.1.1.1 Flight carbon calculator integration
- 3.8.1.1.2 Carbon offset program partnerships
- 3.8.1.1.3 Sustainable transportation options
- 3.8.1.1.4 Green travel recommendations
- 3.8.1.2 Eco-friendly accommodation promotion
- 3.8.1.2.1 Green certification filtering
- 3.8.1.2.2 Sustainable hotel partnerships
- 3.8.1.2.3 Energy-efficient property promotion
- 3.8.1.2.4 Local and responsible tourism
- 3.8.1.3 Sustainable travel content and education
- 3.8.1.3.1 Responsible travel guides
- 3.8.1.3.2 Environmental impact awareness
- 3.8.1.3.3 Local community support programs
- 3.8.1.3.4 Wildlife and conservation tourism
- 3.8.1.1 Carbon footprint tracking and offsetting
- 3.8.2 Corporate social responsibility (CSR)
- 3.8.2.1 Environmental sustainability initiatives
- 3.8.2.1.1 Carbon neutral operations
- 3.8.2.1.2 Renewable energy usage
- 3.8.2.1.3 Waste reduction programs
- 3.8.2.1.4 Sustainable office practices
- 3.8.2.2 Social impact and community development
- 3.8.2.2.1 Local community support programs
- 3.8.2.2.2 Education and skill development
- 3.8.2.2.3 Diversity and inclusion initiatives
- 3.8.2.2.4 Charitable giving and volunteering
- 3.8.2.3 Ethical business practices
- 3.8.2.3.1 Fair labor practices
- 3.8.2.3.2 Supplier code of conduct
- 3.8.2.3.3 Anti-corruption policies
- 3.8.2.3.4 Transparent reporting standards
- 3.8.2.1 Environmental sustainability initiatives
- 3.8.1 Sustainable travel platform development
- 3.9 Patent analysis
- 3.10 Use cases
Chapter 4 Competitive Landscape, 2024
- 4.1 Introduction
- 4.2 Company market share analysis
- 4.2.1 North America
- 4.2.2 Europe
- 4.2.3 Asia Pacific
- 4.2.4 Latin America
- 4.2.5 Middle East & Africa
- 4.3 Competitive positioning matrix
- 4.4 Strategic outlook matrix
- 4.5 Key developments
- 4.5.1 Mergers & acquisitions
- 4.5.2 Partnerships & collaborations
- 4.5.3 New Product Launches
- 4.5.4 Expansion Plans and funding
Chapter 5 Market Estimates & Forecast, By Service, 2021 - 2034 ($Bn)
- 5.1 Key trends
- 5.2 Accommodation booking services
- 5.2.1 Hotel booking platforms
- 5.2.2 Alternative accommodation platforms
- 5.2.3 Extended stay and corporate housing
- 5.3 Flight booking and airline services
- 5.3.1 Domestic flight booking
- 5.3.2 International flight booking
- 5.3.3 Ancillary services and add-ons
- 5.4 Ground transportation and car rental
- 5.4.1 Car rental services
- 5.4.2 Alternative transportation
- 5.4.3 Multi modal transportation
- 5.5 Activities, experiences, and tours
- 5.5.1 Tours and sightseeing
- 5.5.2 Entertainment and events
- 5.5.3 Food and dining experiences
- 5.6 Travel packages and bundles
- 5.6.1 Flight and hotel packages
- 5.6.2 All-inclusive vacation packages
- 5.6.3 Custom and personalized packages
Chapter 6 Market Estimates & Forecast, By Mode of Booking, 2021 - 2034 ($Bn)
- 6.1 Key trends
- 6.2 App-based
- 6.3 Web-based
- 6.4 Voice and conversational booking
- 6.5 Social media and emerging channels
Chapter 7 Market Estimates & Forecast, By Age Group, 2021 - 2034 ($Bn)
- 7.1 Key trends
- 7.2 Up to 29 years
- 7.3 30 to 44 years
- 7.4 45 to 59 years
- 7.5 60 years and above
Chapter 8 Market Estimates & Forecast, By Traveler, 2021 - 2034 ($Bn)
- 8.1 Key trends
- 8.2 Leisure travelers
- 8.3 Business travelers
- 8.4 Entertainment, sports, and event travelers
- 8.5 Educational travelers
- 8.6 Others
Chapter 9 Market Estimates & Forecast, By Business Model, 2021 - 2034 ($Bn)
- 9.1 Key trends
- 9.2 Commission-based models
- 9.3 Merchant models
- 9.4 Advertising and marketing revenue
- 9.5 Subscription and membership models
Chapter 10 Market Estimates & Forecast, By End Use, 2021 - 2034 ($Bn)
- 10.1 Key trends
- 10.2 Individual travelers
- 10.3 Corporate travelers
Chapter 11 Market Estimates & Forecast, By Region, 2021 - 2034 ($Bn)
- 11.1 North America
- 11.1.1 U.S.
- 11.1.2 Canada
- 11.2 Europe
- 11.2.1 UK
- 11.2.2 Germany
- 11.2.3 France
- 11.2.4 Italy
- 11.2.5 Spain
- 11.2.6 Russia
- 11.2.7 Nordics
- 11.3 Asia Pacific
- 11.3.1 China
- 11.3.2 India
- 11.3.3 Japan
- 11.3.4 South Korea
- 11.3.5 Australia
- 11.3.6 Southeast Asia
- 11.4 Latin America
- 11.4.1 Brazil
- 11.4.2 Mexico
- 11.4.3 Argentina
- 11.4.4 Chile
- 11.5 MEA
- 11.5.1 South Africa
- 11.5.2 Saudi Arabia
- 11.5.3 UAE
Chapter 12 Company Profiles
- 12.1 Agoda Company
- 12.2 Airbnb
- 12.3 Almosafer
- 12.4 Booking Holding
- 12.5 Cleartrip
- 12.6 Despegar.com
- 12.7 eDreams ODIGEO
- 12.8 Expedia
- 12.9 Hays Travel
- 12.10 Lastminute.com Group
- 12.11 MakeMyTrip
- 12.12 Rakuten Travel
- 12.13 Skyscanner
- 12.14 Tongcheng Travel Holdings
- 12.15 Traveloka
- 12.16 Trip.com Group
- 12.17 Tripadvisor
- 12.18 Trivago NV
- 12.19 Webjet
- 12.20 Yatra Online
 全球线上旅游预订市场规模、份额、趋势和成长分析报告(2026-2034)
 线上旅游市场规模、份额、趋势及预测(按服务类型、平台、预订方式、年龄层和地区划分,2026-2034 年)
 按平台类型、年龄层和地区分類的线上旅游市场
 线上旅游预订服务市场 - 全球产业规模、份额、趋势、机会及预测(按服务类型、平台、支付方式、地区和竞争格局划分,2021-2031年)线上旅游市场-2026-2031年预测日本线上住宿市场报告(按平台(行动应用程式、网站)、预订方式(第三方线上入口网站、直接/自有入口网站)和地区划分,2026-2034 年)
 线上旅游市场规模、份额和成长分析(按服务、预订方式、平台、旅客、应用和地区划分)-2026-2033年产业预测
 线上旅游预订服务市场按旅行方式、行程类型、预订管道、设备类型、支付方式、行程时长、客户类型和预订时间划分-2025-2032年全球预测电子旅游市场按服务类型、平台类型、旅行方式和最终用户划分-2025-2030 年全球预测线上旅游市场按平台、服务类型、预订类型、支付方式和旅客类型划分-2025-2030 年全球预测