


 |
市场调查报告书
商品编码
1797710
行动扩增实境 (AR) 市场机会、成长动力、产业趋势分析及 2025 - 2034 年预测Mobile Augmented Reality (AR) Market Opportunity, Growth Drivers, Industry Trend Analysis, and Forecast 2025 - 2034 |
||||||
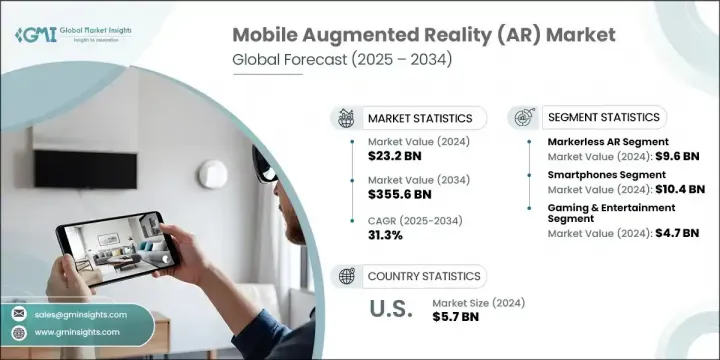
2024 年全球行动扩增实境市场规模达 232 亿美元,预计到 2034 年将以 31.3% 的复合年增长率成长,达到 3,556 亿美元。这一强劲增长得益于扩增实境 (AR) 智慧型手机的广泛使用、消费者对沉浸式数位体验日益增长的兴趣,以及零售、娱乐、医疗保健和教育等领域应用的不断扩展。高性能处理器、先进感测器和多镜头摄影机等技术进步推动了扩增实境在全球市场的广泛应用。此外,5G 的推出和边缘运算的进步正在支援低延迟、即时的 AR 交互,而这些交互先前受到网路限制。不断壮大的 AR 开发工俱生态系统也使企业和创作者能够提供互动式行动 AR 应用程序,而电子商务和行动游戏平台则持续刺激消费者需求。
行动 AR 还能显着提升营运效率和用户参与度。例如,在培训工作流程中使用 AR 的公司报告称,学习效率提高了 90% 以上。这些技术正在用即时视觉化指南取代传统教学,从而减少错误并显着缩短培训时间。在电子商务领域,行动 AR 正在帮助零售商提供虚拟产品预览,增强买家信心并减少产品退货。各行各业的企业都在转向行动 AR,以提升体验个人化、提升品牌互动,并让消费者能够直接透过行动装置做出明智的决策。
| 市场范围 | |
|---|---|
| 起始年份 | 2024 |
| 预测年份 | 2025-2034 |
| 起始值 | 232亿美元 |
| 预测值 | 3556亿美元 |
| 复合年增长率 | 31.3% |
无标记 AR 市场在 2024 年创造了 96 亿美元的收入。这种方法正获得广泛关注,因为它不依赖物理标记,而是结合使用 GPS、SLAM 和惯性感测器将数位内容锚定在现实环境中。零售、教育和娱乐等行业正在拥抱这项技术,以实现可部署在任何地方的互动体验。无标记 AR 支援即时导航、沉浸式游戏和远距学习等应用,这促进了其快速成长。
2024年,智慧型手机市场规模达104亿美元。该领域的成长得益于智慧型手机技术的快速发展,包括高解析度相机、先进的运动追踪技术和专用AI晶片。这些技术共同打造了流畅的AR体验,使用户能够与虚拟元素无缝互动。如今,即使是中阶设备也配备了光达扫描器和升级版GPU,行动AR的普及率正在不断提升,智慧型手机也因此成为全球消费者AR内容的主要驱动力。
2024年,美国行动扩增实境 (AR) 市场规模达57亿美元,预计到2034年将以29.4%的复合年增长率成长。该地区的成长得益于支持AR的行动装置的广泛普及、消费者对沉浸式内容的需求以及领先科技公司对开发者的大力支持。 5G部署的持续推进以及国家在增强数位基础设施方面的努力也正在推动AR的普及。企业要取得成功,必须专注于提供轻量级的SDK、针对下一代网路优化软体,并与内容製作商、品牌和服务供应商建立合作伙伴关係。优先考虑直观的用户体验、隐私保护和无缝的空间集成,将进一步提升用户参与度和信任度。
活跃于行动扩增实境 (AR) 市场的知名公司包括 MAXST Co., Ltd.、Talespin Reality Labs, Inc.、Wikitude GmbH、三星电子有限公司、Magic Leap, Inc.、Appentus Technologies Private Limited、Groove Jones, LLC、PTC Inc.、Apple Inc.、Blippar.com Limited、8N LLC.com为了加强市场影响力,行动 AR 领域的参与者正专注于跨平台开发工具、增强 AR 引擎性能以及整合 AI 驱动的个人化功能。许多公司正在透过收购以及与零售商、游戏工作室和技术开发商建立策略联盟来扩展其 AR 内容组合。他们非常重视让高阶和中阶智慧型手机都能获得 AR 体验。
目录
第一章:方法论与范围
第二章:执行摘要
2.2.1. 技术类型
- 设备类型
- 应用
- 北美洲
- 欧洲
- 亚太地区
- 拉丁美洲
- 中东和非洲
- TAM分析,2025-2034
- CXO 观点:策略要务
- 执行决策点
- 关键成功因素
- 未来展望与策略建议
第三章:行业洞察
- 产业生态系统分析
- 供应商概况
- 利润率
- 成本结构
- 每个阶段的增值
- 影响价值链的因素
- 中断
- 产业衝击力
- 成长动力
- 智慧型手机普及率不断提升,扩增实境功能日益普及
- 零售和电子商务需求激增
- 5G和边缘运算的扩展
- 行动游戏和娱乐的普及率不断提高
- 支援生态系统和开发者工具
- 产业陷阱与挑战
- 设备限制和碎片化
- 隐私和安全问题
- 市场机会
- 成长动力
- 成长潜力分析
- 监管格局
- 北美洲
- 欧洲
- 亚太地区
- 拉丁美洲
- 中东和非洲
- 波特的分析
- PESTEL分析
- 技术和创新格局
- 当前的技术趋势
- 新兴技术
- 价格趋势
- 按地区
- 按产品
- 定价策略
- 新兴商业模式
- 合规性要求
- 永续性措施
- 消费者情绪分析
- 专利和智慧财产权分析
- 地缘政治与贸易动态
第四章:竞争格局
- 简介公司市占率分析
- 公司市占率分析
- 按地区
4.2.1. 北美
4.2.2. 欧洲
4.2.3. 亚太地区
- 市场集中度分析
- 关键参与者的竞争基准化分析
- 财务绩效比较
4.3.1.1. 收入
4.3.1.2. 利润率
4.3.1.3. 研发
- 产品组合比较
4.3.2.1. 产品范围广度
4.3.2.2. 技术
4.3.2.3. 创新
- 地理分布比较
4.3.3.1. 全球足迹分析
4.3.3.2. 服务网路覆盖
4.3.3.3. 各地区市场渗透率
- 竞争定位矩阵
4.3.4.1. 领导者
4.3.4.2. 挑战者
4.3.4.3. 关注者
4.3.4.4. 利基市场参与者
- 战略展望矩阵
- 2021-2024 年关键发展
- 合併与收购
- 伙伴关係与合作
- 技术进步
- 扩张和投资策略
- 永续发展倡议
- 数位转型倡议
- 新兴/新创企业竞争对手格局
第五章:市场估计与预测:依技术类型,2021 - 2034 年
- 基于标记的扩增实境
- 无标记扩增实境
- 基于投影的扩增实境
- 基于迭加的扩增实境
第六章:市场估计与预测:按设备类型,2021 - 2034 年
- 智慧型手机
- 平板电脑
- 穿戴式装置
- 手持式游戏机
第七章:市场估计与预测:按应用,2021 - 2034 年
- 游戏与娱乐
- 零售与电子商务
- 教育与培训
- 卫生保健
- 军事与国防
- 旅行与旅游
- 房地产与建筑
- 其他的
第八章:市场估计与预测:按地区,2021 - 2034 年
- 主要趋势
- 北美洲
- 我们
- 加拿大
- 欧洲
- 德国
- 英国
- 法国
- 西班牙
- 鱼子
- 亚太地区
- 中国
- 印度
- 日本
- 韩国
- 澳洲
- 亚太地区
- 拉丁美洲
- 中东和非洲
- 阿联酋
- 沙乌地阿拉伯
- 南非
- 罗马
第九章:公司简介
- 8ninths Inc. (Valence)
- Appentus Technologies Private Limited
- Apple Inc.
- APX Labs, Inc.
- Atheer, Inc.
- Augment Inc.
- BidOn Games Studio, LLC
- Blippar.com Limited
- EON Reality, Inc.
- Google LLC
- Groove Jones, LLC
- HQSoftware OU
- INDE Appshaker Ltd.
- Magic Leap, Inc.
- MAXST Co., Ltd.
- NEXT/NOW, LLC
- Niantic, Inc.
- PTC Inc. (formerly Parametric)
- Samsung Electronics Co., Ltd.
- Scanta Inc.
- Scope Technologies US Inc.
- Talespin Reality Labs, Inc.
- VironIT LLC
- Wikitude GmbH
- Zappar Ltd. (UK)
The Global Mobile Augmented Reality Market was valued at USD 23.2 billion in 2024 and is estimated to grow at a CAGR of 31.3% to reach USD 355.6 billion by 2034. This robust growth is driven by the widespread use of AR-enabled smartphones, increasing consumer interest in immersive digital experiences, and expanding applications across sectors such as retail, entertainment, healthcare, and education. Technological advances such as high-performance processors, advanced sensors, and multi-lens cameras have enabled broader adoption across global markets. Additionally, the rollout of 5G and progress in edge computing are supporting low-latency, real-time AR interactions that were previously limited by network constraints. The growing ecosystem of AR development tools is also empowering businesses and creators to deliver interactive mobile AR applications, while e-commerce and mobile gaming platforms continue to fuel consumer demand.
Mobile AR also delivers measurable gains in operational efficiency and user engagement. For example, companies utilizing AR in training workflows have reported over 90% improvement in learning efficiency. These technologies are replacing traditional instructions with real-time visual guides, reducing errors and compressing training time significantly. In e-commerce, mobile AR is helping retailers offer virtual product previews, increasing buyer confidence and reducing product returns. Businesses across sectors are turning to mobile AR to improve experience personalization, elevate brand interaction, and enable informed decision-making by consumers directly from their mobile devices.
| Market Scope | |
|---|---|
| Start Year | 2024 |
| Forecast Year | 2025-2034 |
| Start Value | $23.2 billion |
| Forecast Value | $355.6 billion |
| CAGR | 31.3% |
The markerless AR segment generated USD 9.6 billion in 2024. This approach is gaining widespread traction as it does not rely on physical markers but instead uses a combination of GPS, SLAM, and inertial sensors to anchor digital content within real-world environments. Industries such as retail, education, and entertainment are embracing this technology for interactive experiences that can be deployed anywhere. Markerless AR supports applications such as real-time navigation, immersive gaming, and remote learning, which has contributed to its rapid growth.
The smartphones segment generated USD 10.4 billion in 2024. The growth of this segment is attributed to the rapid evolution of smartphone technology, including high-resolution cameras, advanced motion tracking, and dedicated AI chips. These components collectively provide a smooth AR experience, enabling users to interact with virtual elements seamlessly. With LiDAR scanners and upgraded GPUs now available in even mid-range devices, the accessibility of mobile AR is expanding across demographics, making smartphones the primary driver of consumer-facing AR content globally.
United States Mobile Augmented Reality (AR) Market was USD 5.7 billion in 2024 and is forecast to grow at a CAGR of 29.4% by 2034. Growth in this region is supported by the widespread adoption of AR-ready mobile devices, consumer demand for immersive content, and strong developer support from leading tech firms. Continued progress in 5G deployment and national efforts to enhance digital infrastructure are also reinforcing adoption. For businesses to succeed, they must focus on delivering lightweight SDKs, optimizing software for next-gen networks, and establishing partnerships with content producers, brands, and service providers. Prioritizing intuitive UX, privacy safeguards, and seamless spatial integration will further increase user engagement and trust.
Prominent companies active in the Mobile Augmented Reality (AR) Market include MAXST Co., Ltd., Talespin Reality Labs, Inc., Wikitude GmbH, Samsung Electronics Co., Ltd., Magic Leap, Inc., Appentus Technologies Private Limited, Groove Jones, LLC, PTC Inc., Apple Inc., Blippar.com Limited, 8ninths Inc. (Valence), BidOn Games Studio, LLC, Niantic, Inc., and Google LLC. To strengthen their market presence, players in the mobile AR landscape are focusing on cross-platform development tools, enhancing AR engine performance, and integrating AI-driven personalization features. Many companies are expanding their AR content portfolios through acquisitions and strategic alliances with retailers, game studios, and tech developers. There is a strong emphasis on making AR experiences accessible on both high-end and mid-tier smartphones.
Table of Contents
Chapter 1 Methodology and Scope
- 1.1 Market scope and definition
- 1.2 Research design
- 1.2.1 Research approach
- 1.2.2 Data collection methods
- 1.3 Data mining sources
- 1.3.1 Global
- 1.3.2 Regional/Country
- 1.4 Base estimates and calculations
- 1.4.1 Base year calculation
- 1.4.2 Key trends for market estimation
- 1.5 Primary research and validation
- 1.5.1 Primary sources
- 1.6 Forecast model
- 1.7 Research assumptions and limitations
Chapter 2 Executive Summary
- 2.1 Industry 3600 synopsis
- 2.2 Key market trends
2.2.1. Technology type
- 2.2.2 Device type
- 2.2.3 Application
- 2.2.5 North America
- 2.2.6 Europe
- 2.2.7 Asia Pacific
- 2.2.8 Latin America
- 2.2.9 Middle East & Africa
- 2.3 TAM Analysis, 2025-2034 (USD Million)
- 2.4 CXO perspectives: Strategic imperatives
- 2.5 Executive decision points
- 2.6 Critical Success Factors
- 2.7 Future Outlook and Strategic Recommendations
Chapter 3 Industry Insights
- 3.1 Industry ecosystem analysis
- 3.1.1 Supplier Landscape
- 3.1.2 Profit Margin
- 3.1.3 Cost structure
- 3.1.4 Value addition at each stage
- 3.1.5 Factor affecting the value chain
- 3.1.6 Disruptions
- 3.2 Industry impact forces
- 3.2.1 Growth drivers
- 3.2.1.1 Rising smartphone penetration with AR capabilities
- 3.2.1.2 Surging demand in retail and e-commerce
- 3.2.1.3 Expansion of 5g and edge computing
- 3.2.1.4 Increased adoption in mobile gaming and entertainment
- 3.2.1.5 Supportive ecosystem and developer tools
- 3.2.2 Industry pitfalls and challenges
- 3.2.2.1 Device Limitations and Fragmentation
- 3.2.2.2 Privacy and Security Concerns
- 3.2.3 Market Opportunities
- 3.2.1 Growth drivers
- 3.3 Growth potential analysis
- 3.4 Regulatory landscape
- 3.4.1 North America
- 3.4.2 Europe
- 3.4.3 Asia Pacific
- 3.4.4 Latin America
- 3.4.5 Middle East & Africa
- 3.5 Porter's analysis
- 3.6 PESTEL analysis
- 3.7 Technological and Innovation landscape
- 3.7.1 Current technological trends
- 3.7.2 Emerging technologies
- 3.8 Price Trends
- 3.8.1 By region
- 3.8.2 By product
- 3.9 Pricing strategies
- 3.10 Emerging business models
- 3.11 Compliance requirements
- 3.12 Sustainability measures
- 3.13 Consumer sentiment analysis
- 3.14 Patent and IP analysis
- 3.15 Geopolitical and trade dynamics
Chapter 4 Competitive Landscape, 2024
- 4.1 Introduction Company market share analysis
- 4.2 Company market share analysis
- 4.2.1 By region
4.2.1. North America
4.2.2. Europe
4.2.3. Asia Pacific
- 4.2.2 Market concentration analysis
- 4.3 Competitive Benchmarking of key Players
- 4.3.1 Financial Performance Comparison
4.3.1.1. Revenue
4.3.1.2. Profit Margin
4.3.1.3. R&D
- 4.3.2 Product Portfolio Comparison
4.3.2.1. Product Range Breadth
4.3.2.2. Technology
4.3.2.3. Innovation
- 4.3.3 Geographic Presence Comparison
4.3.3.1. Global Footprint Analysis
4.3.3.2. Service Network Coverage
4.3.3.3. Market Penetration by Region
- 4.3.4 Competitive Positioning Matrix
4.3.4.1. Leaders
4.3.4.2. Challengers
4.3.4.3. Followers
4.3.4.4. Niche Players
- 4.3.5 Strategic outlook matrix
- 4.4 Key developments, 2021-2024
- 4.4.1 Mergers and Acquisitions
- 4.4.2 Partnerships and Collaborations
- 4.4.3 Technological Advancements
- 4.4.4 Expansion and Investment Strategies
- 4.4.5 Sustainability Initiatives
- 4.4.6 Digital Transformation Initiatives
- 4.5 Emerging/ Startup Competitors Landscape
Chapter 5 Market Estimates & Forecast, By Technology Type, 2021 - 2034 (USD Billion)
- 5.1 Marker-based AR
- 5.2 Markerless AR
- 5.3 Projection-based AR
- 5.4 Superimposition-based AR
Chapter 6 Market estimates & forecast, By Device Type, 2021 - 2034 (USD Billion)
- 6.1 Smartphones
- 6.2 Tablets
- 6.3 Wearables
- 6.4 Handheld Consoles
Chapter 7 Market estimates & forecast, By Application, 2021 - 2034 (USD Billion)
- 7.1 Gaming & Entertainment
- 7.2 Retail & E-commerce
- 7.3 Education & Training
- 7.4 Healthcare
- 7.5 Military & Defense
- 7.6 Travel & Tourism
- 7.7 Real Estate & Architecture
- 7.8 Others
Chapter 8 Market Estimates and Forecast, By Region, 2021 - 2034 (USD Million)
- 8.1 Key trends
- 8.2 North America
- 8.2.1 U.S.
- 8.2.2 Canada
- 8.3 Europe
- 8.3.1 Germany
- 8.3.2 U.K.
- 8.3.3 France
- 8.3.4 Spain
- 8.3.5 ROE
- 8.4 Asia Pacific
- 8.4.1 China
- 8.4.2 India
- 8.4.3 Japan
- 8.4.4 South Korea
- 8.4.5 Australia
- 8.4.6 RoAPAC
- 8.5 Latin America
- 8.6 Middle East & Africa
- 8.6.1 UAE
- 8.6.2 Saudi Arabia
- 8.6.3 South Africa
- 8.6.4 RoMEA
Chapter 9 Company Profile
- 9.1 8ninths Inc. (Valence)
- 9.2 Appentus Technologies Private Limited
- 9.3 Apple Inc.
- 9.4 APX Labs, Inc.
- 9.5 Atheer, Inc.
- 9.6 Augment Inc.
- 9.7 BidOn Games Studio, LLC
- 9.8 Blippar.com Limited
- 9.9 EON Reality, Inc.
- 9.10 Google LLC
- 9.11 Groove Jones, LLC
- 9.12 HQSoftware OU
- 9.13 INDE Appshaker Ltd.
- 9.14 Magic Leap, Inc.
- 9.15 MAXST Co., Ltd.
- 9.16 NEXT/NOW, LLC
- 9.17 Niantic, Inc.
- 9.18 PTC Inc. (formerly Parametric)
- 9.19 Samsung Electronics Co., Ltd.
- 9.20 Scanta Inc.
- 9.21 Scope Technologies US Inc.
- 9.22 Talespin Reality Labs, Inc.
- 9.23 VironIT LLC
- 9.24 Wikitude GmbH
- 9.25 Zappar Ltd. (UK)
 行动扩增实境市场:2026-2032年全球市场预测(按设备类型、组件、追踪技术、显示类型和应用划分)
 2026年行动扩增实境(MAR)全球市场报告
 行动扩增实境(AR) 市场分析及预测(至 2035 年):按类型、产品类型、服务、技术、组件、应用、形式、设备和最终用户划分
 行动扩增实境市场-全球产业规模、份额、趋势、机会、预测:按组件、应用、最终用户、地区和竞争对手划分,2021-2031年
 2025-2029年行动扩增实境(AR)市场
 行动 AR(扩增实境)市场规模、份额、成长分析,按类型、按组件、按设备类型、按应用、按地区 - 行业预测,2024-2031 年