


 |
市场调查报告书
商品编码
1822621
区域供热市场机会、成长动力、产业趋势分析及2025-2034年预测District Heating Market Opportunity, Growth Drivers, Industry Trend Analysis, and Forecast 2025 - 2034 |
||||||
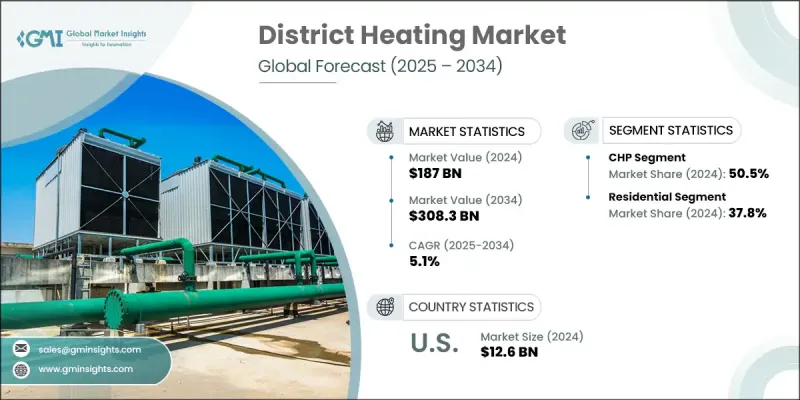
2024年,全球区域供热市场规模达1,870亿美元,预计到2034年将以5.1%的复合年增长率成长,达到3,083亿美元。这一增长将透过提供稳定的能源供应来增强能源安全。与依赖易挥发化石燃料的独立供热系统不同,区域供热管网不易受价格波动和供应中断的影响。这些系统采用集中式供热和分配方式,确保住宅、商业和工业用户获得稳定的能源供应。这种韧性有助于促进经济稳定,并透过减少对化石燃料的依赖和降低碳排放来支持永续发展目标。为此,2024年6月,惠普企业和丹佛斯携手合作,致力于降低资料中心的能耗。双方的模组化设计整合了热量捕获系统,以加速边缘人工智慧和运算任务的运行,同时将多余的热量回收利用。此举与全球为降低能源相关风险和建立更具韧性的未来能源基础设施所做的努力一致。
整个区域供热市场根据应用、来源和地区进行分类。地热能市场预计将在2032年之前录得可观的复合年增长率,这得益于其作为可持续可靠热源的日益普及。地热能提供稳定且可再生的热能供应,减少了对化石燃料的依赖,并最大限度地减少了温室气体排放。此外,技术进步使地热开采更有效率且经济实惠,从而鼓励将其整合到区域供热系统中。各国政府和环保政策也支持地热能应用于区域供热,将进一步促进该领域的成长。
| 市场范围 | |
|---|---|
| 起始年份 | 2024 |
| 预测年份 | 2025-2034 |
| 起始值 | 1870亿美元 |
| 预测值 | 3083亿美元 |
| 复合年增长率 | 5.1% |
到2032年,住宅供暖市场将占据显着的区域供热市场份额,这得益于城镇化进程的加快以及人口稠密地区对高效、可持续供暖解决方案的需求。房主们正在寻求环保的选择,以降低能源成本和碳足迹。区域供热系统提供可靠且方便的加热方式,无需单独安装锅炉和维护。此外,政府推出的奖励措施和法规促进了节能建筑的发展,也促使新建住宅项目采用区域供热。由于致力于减少碳排放和实现气候目标,欧洲区域供热市场在预测期内将呈现显着的复合年增长率。欧洲各国正在大力投资再生能源和先进的暖气基础设施。城镇化和老化供暖系统的现代化改造,催生了对更有效率、集中式解决方案的需求。此外,欧盟的政策和资金支持永续区域供热网路的发展,鼓励公共和私营部门采用这些系统,以提高能源效率并减少对环境的影响。这些因素将促进区域供热产业的成长。
目录
第一章:方法论与范围
第二章:执行摘要
第三章:行业洞察
- 产业生态系统分析
- 主要供应商和技术提供商
- 物流、配送和服务
- 监管格局
- 产业衝击力
- 成长动力
- 产业陷阱与挑战
- 成长潜力分析
- 波特的分析
- PESTEL分析
- 区域供热成本结构分析
- 价格趋势分析
- 按地区
- 按来源
- 未来市场展望及新兴机会
- 未来区域供热和製冷解决方案的开发
- 靛青
- 柔性网路
- E2区
- 交易
- 案例研究分析—斯德哥尔摩综合DHC系统
- 项目概述
- 关键事实和数据
- 客户区隔
- 支持 DHC 的政策和激励措施
- 区域供热系统的技术与运作参数
- 客户和最终用途分析
- 住宅、工业和商业部门的采用
- 都市与农村渗透率
- 需求趋势与消费模式
第四章:竞争格局
- 介绍
- 2024年各地区公司市占率分析
- 北美洲
- 欧洲
- 亚太地区
- 战略仪表板
- 策略倡议
- 重大併购活动
- 关键伙伴关係和合作
- 产品创新与发布
- 市场扩张策略
- 竞争基准测试
- 创新与永续发展格局
第五章:市场规模及预测:依来源,2021 - 2034
- 主要趋势
- 热电联产
- 地热
- 太阳的
- 仅供热锅炉
- 其他的
第六章:市场规模与预测:按应用,2021 - 2034
- 主要趋势
- 住宅
- 商业的
- 学院/大学
- 办公室
- 政府/军队
- 其他的
- 工业的
- 化学
- 炼油厂
- 纸
- 其他的
第七章:市场规模及预测:依地区,2021 - 2034
- 主要趋势
- 北美洲
- 我们
- 加拿大
- 欧洲
- 德国
- 波兰
- 俄罗斯
- 瑞典
- 芬兰
- 义大利
- 丹麦
- 英国
- 斯洛伐克
- 奥地利
- 捷克共和国
- 法国
- 亚太地区
- 中国
- 日本
- 韩国
第八章:公司简介
- A2A SpA
- Alfa Laval
- Antin Infrastructure Partners
- BEW Berlin Energy and Heat
- CenTrio
- Cordia
- Danfoss
- E.ON
- EDF
- EnBW Energie Baden-Wurttemberg
- ENGIE
- Fortum
- Goteborg Energi
- Hafslund
- Iren SpA
- Kelag Energie & Warme
- Keppel
- Korea District Heating
- LOGSTOR Denmark Holding
- Nevel
- Ørsted
- Ramboll
- RWE
- Shinryo Corporation
- Statkraft
- STEAG
- Vattenfall
- Veolia
The Global District Heating Market was valued at USD 187 billion in 2024 and is estimated to grow at a CAGR of 5.1% to reach USD 308.3 billion by 2034, ushered by enhancing energy security by providing a stable energy supply. Unlike individual heating systems reliant on volatile fossil fuels, district heating networks are less susceptible to price fluctuations and supply disruptions. By utilizing a centralized approach to heat production and distribution, these systems ensure consistent energy availability for residential, commercial, and industrial users. This resilience promotes economic stability and supports sustainability goals by reducing reliance on fossil fuels and lowering carbon emissions. To that end, in June 2024, Hewlett Packard Enterprise and Danfoss joined forces to reduce data center energy usage. Their modular design integrates heat capture systems to accelerate AI and compute tasks at the edge, while excess heat is reused externally. It aligns with global efforts to mitigate energy-related risks and build more resilient energy infrastructures for the future.
The overall district heating market is categorized based on application, source, and region. The geothermal segment will record a promising CAGR through 2032, due to its increasing recognition as a sustainable and reliable heat source. Geothermal energy provides a consistent and renewable supply of heat, reducing dependency on fossil fuels and minimizing GHG emissions. Additionally, technological advancements have made geothermal extraction more efficient and cost-effective, encouraging its integration into district heating systems. Governments and environmental policies also support geothermal adoption for district heating applications, adding to segment growth.
| Market Scope | |
|---|---|
| Start Year | 2024 |
| Forecast Year | 2025-2034 |
| Start Value | $187 Billion |
| Forecast Value | $308.3 Billion |
| CAGR | 5.1% |
The residential segment will acquire a remarkable district heating market share by 2032, owing to growing urbanization and the need for efficient, sustainable heating solutions in densely populated areas. Homeowners are seeking eco-friendly options to reduce energy costs and carbon footprints. District heating systems provide a reliable and convenient heating source, eliminating the need for individual boilers and maintenance. Additionally, government incentives and regulations promoting energy-efficient buildings are ushering in the adoption of district heating in new residential developments. Europe district heating market will infer a notable CAGR during the forecast period, because of the commitment to reducing carbon emissions and achieving climate goals. European countries are investing heavily in renewable energy sources and advanced heating infrastructure. Urbanization and the modernization of aging heating systems catapult the need for more efficient, centralized solutions. Additionally, European Union policies and funding support the development of sustainable district heating networks, encouraging public and private sectors to adopt these systems for improved energy efficiency and environmental impact reduction. These factors will bolster the regional industry growth.
Table of Contents
Chapter 1 Methodology & Scope
- 1.1 Research design
- 1.1.1 Research approach
- 1.1.2 Data collection methods
- 1.1.3 Base estimates and calculations
- 1.1.4 Base year calculation
- 1.1.5 Key trends for market estimates
- 1.2 Forecast model
- 1.3 Primary research and validation
- 1.4 Some of the primary sources (but not limited to)
- 1.5 Data mining sources
- 1.5.1 Secondary
- 1.5.1.1 Paid sources
- 1.5.1.2 Public sources
- 1.5.1.3 Sources, by region
- 1.5.1 Secondary
- 1.6 Market definitions
Chapter 2 Executive Summary
- 2.1 Industry 3600 synopsis, 2021 - 2034
- 2.2 Business trends
- 2.3 Source trends
- 2.4 Application trends
- 2.5 Regional trends
Chapter 3 Industry Insights
- 3.1 Industry ecosystem analysis
- 3.1.1 Key suppliers and technology providers
- 3.1.2 Logistics, distribution, and services
- 3.2 Regulatory landscape
- 3.3 Industry impact forces
- 3.3.1 Growth drivers
- 3.3.2 Industry pitfalls & challenges
- 3.4 Growth potential analysis
- 3.5 Porter's analysis
- 3.5.1 Bargaining power of suppliers
- 3.5.2 Bargaining power of buyers
- 3.5.3 Threat of new entrants
- 3.5.4 Threat of substitutes
- 3.6 PESTEL analysis
- 3.6.1 Political factors
- 3.6.2 Economic factors
- 3.6.3 Social factors
- 3.6.4 Technological factors
- 3.6.5 Legal factors
- 3.6.6 Environmental factors
- 3.7 Cost structure analysis of district heating
- 3.8 Price trend analysis
- 3.8.1 By region
- 3.8.2 By source
- 3.9 Future market outlook & emerging opportunities
- 3.10 Development of future district heating & cooling solutions
- 3.10.1 INDIGO
- 3.10.2 FLEXYNETS
- 3.10.3 E2District
- 3.10.4 InDeal
- 3.11 Case study analysis - Integrated DHC system in Stockholm
- 3.11.1 Project overview
- 3.11.2 Key facts & figures
- 3.11.3 Customer segmentation
- 3.11.4 Policies & incentives supporting the DHC
- 3.12 Technical and operational parameters of district heating systems
- 3.13 Customer & End Use analysis
- 3.13.1 Adoption by residential, industrial, and commercial sectors
- 3.13.2 Urban vs rural penetration
- 3.13.3 Demand trends and consumption patterns
Chapter 4 Competitive Landscape, 2025
- 4.1 Introduction
- 4.2 Company market share analysis, by region 2024
- 4.2.1 North America
- 4.2.2 Europe
- 4.2.3 Asia Pacific
- 4.3 Strategic dashboard
- 4.4 Strategic initiatives
- 4.4.1 Major M&A activities
- 4.4.2 Key partnerships and collaborations
- 4.4.3 Product innovations and launches
- 4.4.4 Market expansion strategies
- 4.5 Competitive benchmarking
- 4.6 Innovation & sustainability landscape
Chapter 5 Market Size and Forecast, By Source, 2021 - 2034 (USD Billion & PJ)
- 5.1 Key trends
- 5.2 CHP
- 5.3 Geothermal
- 5.4 Solar
- 5.5 Heat only boiler
- 5.6 Others
Chapter 6 Market Size and Forecast, By Application, 2021 - 2034 (USD Billion & PJ)
- 6.1 Key trends
- 6.2 Residential
- 6.3 Commercial
- 6.3.1 College/university
- 6.3.2 Office
- 6.3.3 Government/military
- 6.3.4 Others
- 6.4 Industrial
- 6.4.1 Chemical
- 6.4.2 Refinery
- 6.4.3 Paper
- 6.4.4 Others
Chapter 7 Market Size and Forecast, By Region, 2021 - 2034 (USD Billion & PJ)
- 7.1 Key trends
- 7.2 North America
- 7.2.1 U.S.
- 7.2.2 Canada
- 7.3 Europe
- 7.3.1 Germany
- 7.3.2 Poland
- 7.3.3 Russia
- 7.3.4 Sweden
- 7.3.5 Finland
- 7.3.6 Italy
- 7.3.7 Denmark
- 7.3.8 UK
- 7.3.9 Slovakia
- 7.3.10 Austria
- 7.3.11 Czech Republic
- 7.3.12 France
- 7.4 Asia Pacific
- 7.4.1 China
- 7.4.2 Japan
- 7.4.3 South Korea
Chapter 8 Company Profiles
- 8.1 A2A S.p.A.
- 8.2 Alfa Laval
- 8.3 Antin Infrastructure Partners
- 8.4 BEW Berlin Energy and Heat
- 8.5 CenTrio
- 8.6 Cordia
- 8.7 Danfoss
- 8.8 E.ON
- 8.9 EDF
- 8.10 EnBW Energie Baden-Wurttemberg
- 8.11 ENGIE
- 8.12 Fortum
- 8.13 Goteborg Energi
- 8.14 Hafslund
- 8.15 Iren S.p.A.
- 8.16 Kelag Energie & Warme
- 8.17 Keppel
- 8.18 Korea District Heating
- 8.19 LOGSTOR Denmark Holding
- 8.20 Nevel
- 8.21 Ørsted
- 8.22 Ramboll
- 8.23 RWE
- 8.24 Shinryo Corporation
- 8.25 Statkraft
- 8.26 STEAG
- 8.27 Vattenfall
- 8.28 Veolia
 区域供热市场:网路类型、电站容量、能源来源、供热温度、应用、最终用途-2026-2032年全球市场预测
 英国区域供热:市场占有率分析、产业趋势与统计、成长预测(2026-2031)
 全球区域供热市场规模、份额、趋势和成长分析报告(2026-2034年)住宅区域供热市场规模、份额、成长及全球产业分析:按类型、应用和地区分類的洞察,2026-2034 年预测商业区域供热市场规模、份额、成长及全球产业分析:按类型、应用和地区分類的洞察,2026-2034 年预测
 2026年全球区域供热市场报告
 区域供热市场规模、份额和趋势分析报告:按热源、类型、应用、工厂类型、地区和细分市场预测(2026-2033 年)
 全球热力网路市场
 区域供热的全球市场:厂房类型·热源·用途·各地区 (~2032年)
 按工厂类型、热源、应用和地区分類的区域供热市场