


 |
市场调查报告书
商品编码
1822650
替代蛋白质市场机会、成长动力、产业趋势分析及 2025 - 2034 年预测Alternative Proteins Market Opportunity, Growth Drivers, Industry Trend Analysis, and Forecast 2025 - 2034 |
||||||
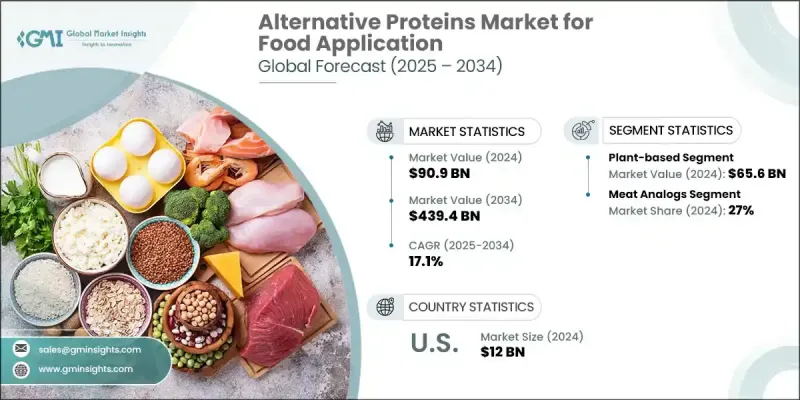
2024 年,全球食品替代蛋白质市场价值为 909 亿美元,预计在环境永续意识的推动下,该市场将以 17.1% 的复合年增长率成长,到 2034 年达到 4,394 亿美元。随着消费者选择环保的生活方式,他们正在寻找生态足迹较低的蛋白质来源。此外,对健康和饮食的担忧促使人们转向植物性和实验室培育的蛋白质,这些蛋白质被认为更健康,不太可能导致慢性疾病。根据国际食品资讯委员会在 2023 年进行的一项调查,超过一半(57%)的美国人尝试过替代蛋白质,其中最常见的是植物性碎牛肉,占 31%,其次是牛肉替代品,占 23%,植物性香肠占 22%,植物性鸡肉替代品占 22%。
此外,食品生产技术的进步使替代蛋白质更易于取得且更具成本效益,加速了市场扩张。替代蛋白质市场根据来源、应用和地区进行分类。在研究期间,昆虫类蛋白质将录得显着增长,这得益于其高效的资源利用率。与传统牲畜相比,昆虫所需的土地、水和饲料显着减少,使其成为高度永续的蛋白质来源。此外,昆虫饲料转换率高,易于快速养殖,这与日益增长的可扩展且富有韧性的食品系统需求相契合。随着人们对永续性的担忧日益加剧,消费者不断寻求创新的蛋白质来源,昆虫类蛋白质因其在应对全球粮食安全挑战的同时最大限度地减少环境影响的潜力而日益受到青睐。 2032年,由于畜牧业采用永续蛋白质来源,动物饲料应用领域将占据显着的替代蛋白质市场。
| 市场范围 | |
|---|---|
| 起始年份 | 2024 |
| 预测年份 | 2025-2034 |
| 起始值 | 909亿美元 |
| 预测值 | 4394亿美元 |
| 复合年增长率 | 17.1% |
随着畜产品需求的增加,农民正在探索可以补充传统饲料的替代蛋白质。这种转变的动机是提高饲料效率并减少与传统饲料成分相关的环境足迹。透过将替代蛋白质整合到动物饲料中,生产商可以提高整体资源利用率并应对饲料短缺的挑战。到2032年,欧洲替代蛋白质市场将呈现强劲的成长趋势,这得益于消费者对永续和道德食品选择的强劲需求。人们越来越意识到传统蛋白质来源对环境的影响,促使欧洲消费者寻求更环保的替代方案。此外,严格的法规和政府鼓励食品生产的可持续性的激励措施正在推动市场成长。健康饮食意识的兴起和食品技术的创新进一步增强了替代蛋白质的吸引力,为整个地区的行业参与者创造了丰厚的商机。
目录
第一章:方法论与范围
第二章:执行摘要
第三章:行业洞察
- 产业生态系统分析
- 供应商格局
- 利润率
- 每个阶段的增值
- 影响价值链的因素
- 中断
- 产业衝击力
- 成长动力
- 产业陷阱与挑战
- 市场机会
- 成长潜力分析
- 监管格局
- 北美洲
- 欧洲
- 亚太地区
- 拉丁美洲
- 中东和非洲
- 波特的分析
- PESTEL分析
- 技术和创新格局
- 当前的技术趋势
- 新兴技术
- 价格趋势
- 按地区
- 未来市场趋势
- 技术和创新格局
- 当前的技术趋势
- 新兴技术
- 专利态势
- 贸易统计资料(HS 编码)(註:仅提供重点国家的贸易统计资料)
- 主要进口国
- 主要出口国
- 永续性和环境方面
- 永续实践
- 减少废弃物的策略
- 生产中的能源效率
- 环保倡议
- 碳足迹考虑
第四章:竞争格局
- 介绍
- 公司市占率分析
- 按地区
- 北美洲
- 欧洲
- 亚太地区
- 拉丁美洲
- 多边环境协定
- 按地区
- 公司矩阵分析
- 主要市场参与者的竞争分析
- 竞争定位矩阵
- 关键进展
- 併购
- 伙伴关係与合作
- 新产品发布
- 扩张计划
第五章:市场估计与预测:按来源,2021-2034
- 主要趋势
- 植物基
- 大豆分离蛋白
- 大豆浓缩蛋白
- 发酵大豆蛋白
- 浮萍蛋白
- 其他的
- 基于昆虫
- 基于微生物
- 细菌
- 酵母菌
- 藻类
- 其他的
第六章:市场估计与预测:按应用,2021-2034
- 主要趋势
- 肉类似物
- 麵包店
- 乳製品替代品
- 谷物和零食
- 饮料
- 其他的
第七章:市场估计与预测:按地区,2021-2034
- 主要趋势
- 北美洲
- 我们
- 加拿大
- 欧洲
- 德国
- 英国
- 法国
- 西班牙
- 义大利
- 欧洲其他地区
- 亚太地区
- 中国
- 印度
- 日本
- 澳洲
- 韩国
- 亚太其他地区
- 拉丁美洲
- 巴西
- 墨西哥
- 阿根廷
- 拉丁美洲其他地区
- 中东和非洲
- 沙乌地阿拉伯
- 南非
- 阿联酋
- 中东和非洲其他地区
第八章:公司简介
- Archer Daniels Midland Company
- Cargill Inc.
- Ingredion Inc.
- Kerry Group
- Impossible Foods Inc.
- The Scoular Company
- DSM NV
- Lightlife Foods, Inc.
- Impossible Foods Inc.
- International Flavors & Fragrances, Inc.
- Glanbia plc
- Bunge Limited
- Axiom Foods Inc.
Global Alternative Protein Market for food application was valued at USD 90.9 billion in 2024 and is estimated to grow at a CAGR of 17.1% to reach USD 439.4 billion by 2034, driven by the awareness of environmental sustainability. As consumers opt for an eco-friendly lifestyle, they are seeking protein sources with a lower ecological footprint. Additionally, concerns over health and diet are prompting a shift towards plant-based and lab-grown proteins, which are perceived as healthier and less likely to cause chronic diseases. According to a survey conducted by the International Food Information Council in 2023, over half (57%) of Americans have tried alternative proteins, with plant-based ground beef being the most common at 31%, followed by beef alternatives at 23%, plant-based sausage at 22%, and plant-based chicken alternatives at 22%.
Further, technological advancements in food production are making alternative proteins more accessible and cost-effective, accelerating market expansion. The alternative protein market is classified based on source, application, and region. The insect-based segment will record a significant growth rate over the study period, driven by its efficiency in resource utilization. Insects require significantly less land, water, and feed than traditional livestock, making them a highly sustainable protein source. Additionally, insects have a high feed conversion rate and can be cultivated quickly, which aligns with the growing need for scalable and resilient food systems. As sustainability concerns mount and consumers seek innovative protein sources, insect-based options are gaining traction due to their potential to address global food security challenges while minimizing environmental impact. The animal feed application segment will clutch a noticeable alternative protein market share by 2032, owing to the adoption of sustainable protein sources within the livestock industry.
| Market Scope | |
|---|---|
| Start Year | 2024 |
| Forecast Year | 2025-2034 |
| Start Value | $90.9 Billion |
| Forecast Value | $439.4 Billion |
| CAGR | 17.1% |
As the demand for livestock products increases, farmers are exploring alternative proteins that can supplement traditional feed. This shift is motivated by the desire to enhance feed efficiency and reduce the environmental footprint associated with conventional feed ingredients. By integrating alternative proteins into animal feed, producers can improve overall resource utilization and address the challenges of feed scarcity. Europe alternative protein market will demonstrate a strong growth trend through 2032, driven by robust consumer demand for sustainable and ethical food choices. The increasing awareness of the environmental impact of traditional protein sources has led European consumers to seek more eco-friendly alternatives. Additionally, stringent regulations and government incentives promoting sustainability in food production are fueling market growth. The rise in health-conscious eating and innovations in food technology further bolster the appeal of alternative proteins, creating lucrative opportunities for the industry players across the region.
Table of Contents
Chapter 1 Methodology & Scope
- 1.1 Market scope and definition
- 1.2 Research design
- 1.2.1 Research approach
- 1.2.2 Data collection methods
- 1.3 Data mining sources
- 1.3.1 Global
- 1.3.2 Regional/Country
- 1.4 Base estimates and calculations
- 1.4.1 Base year calculation
- 1.4.2 Key trends for market estimation
- 1.5 Primary research and validation
- 1.5.1 Primary sources
- 1.6 Forecast model
- 1.7 Research assumptions and limitations
Chapter 2 Executive Summary
- 2.1 Industry 360° synopsis
- 2.2 Key market trends
- 2.2.1 Source trends
- 2.2.2 Application trends
- 2.2.3 Regional
- 2.3 TAM Analysis, 2025-2034
- 2.4 CXO perspectives: Strategic imperatives
- 2.4.1 Executive decision points
- 2.4.2 Critical success factors
- 2.5 Future outlook and strategic recommendations
Chapter 3 Industry Insights
- 3.1 Industry ecosystem analysis
- 3.1.1 Supplier landscape
- 3.1.2 Profit margin
- 3.1.3 Value addition at each stage
- 3.1.4 Factor affecting the value chain
- 3.1.5 Disruptions
- 3.2 Industry impact forces
- 3.2.1 Growth drivers
- 3.2.2 Industry pitfalls and challenges
- 3.2.3 Market opportunities
- 3.3 Growth potential analysis
- 3.4 Regulatory landscape
- 3.4.1 North America
- 3.4.2 Europe
- 3.4.3 Asia Pacific
- 3.4.4 Latin America
- 3.4.5 Middle East & Africa
- 3.5 Porter's analysis
- 3.6 PESTEL analysis
- 3.7 Technology and Innovation landscape
- 3.7.1 Current technological trends
- 3.7.2 Emerging technologies
- 3.8 Price trends
- 3.8.1 By region
- 3.9 Future market trends
- 3.10 Technology and Innovation landscape
- 3.10.1 Current technological trends
- 3.10.2 Emerging technologies
- 3.11 Patent Landscape
- 3.12 Trade statistics (HS code) (Note: the trade statistics will be provided for key countries only)
- 3.12.1 Major importing countries
- 3.12.2 Major exporting countries
- 3.13 Sustainability and environmental aspects
- 3.13.1 Sustainable practices
- 3.13.2 Waste reduction strategies
- 3.13.3 Energy efficiency in production
- 3.13.4 Eco-friendly initiatives
- 3.14 Carbon footprint consideration
Chapter 4 Competitive Landscape, 2024
- 4.1 Introduction
- 4.2 Company market share analysis
- 4.2.1 By region
- 4.2.1.1 North America
- 4.2.1.2 Europe
- 4.2.1.3 Asia Pacific
- 4.2.1.4 LATAM
- 4.2.1.5 MEA
- 4.2.1 By region
- 4.3 Company matrix analysis
- 4.4 Competitive analysis of major market players
- 4.5 Competitive positioning matrix
- 4.6 Key developments
- 4.6.1 Mergers & acquisitions
- 4.6.2 Partnerships & collaborations
- 4.6.3 New product launches
- 4.6.4 Expansion plans
Chapter 5 Market Estimates and Forecast, By Source, 2021-2034 (USD Billion) (Kilo Tons)
- 5.1 Key trends
- 5.2 Plant-based
- 5.2.1 Soy Protein Isolates
- 5.2.2 Soy Protein Concentrates
- 5.2.3 Fermented Soy Protein
- 5.2.4 Duckweed Protein
- 5.2.5 Others
- 5.3 Insect-based
- 5.4 Microbial-based
- 5.4.1 Bacteria
- 5.4.2 Yeast
- 5.4.3 Algae
- 5.4.4 Others
Chapter 6 Market Estimates and Forecast, By Application, 2021-2034 (USD Billion) (Kilo Tons)
- 6.1 Key trends
- 6.2 Meat analogs
- 6.3 Bakery
- 6.4 Dairy alternatives
- 6.5 Cereals & snacks
- 6.6 Beverages
- 6.7 Others
Chapter 7 Market Estimates and Forecast, By Region, 2021-2034 (USD Billion) (Kilo Tons)
- 7.1 Key trends
- 7.2 North America
- 7.2.1 U.S.
- 7.2.2 Canada
- 7.3 Europe
- 7.3.1 Germany
- 7.3.2 UK
- 7.3.3 France
- 7.3.4 Spain
- 7.3.5 Italy
- 7.3.6 Rest of Europe
- 7.4 Asia Pacific
- 7.4.1 China
- 7.4.2 India
- 7.4.3 Japan
- 7.4.4 Australia
- 7.4.5 South Korea
- 7.4.6 Rest of Asia Pacific
- 7.5 Latin America
- 7.5.1 Brazil
- 7.5.2 Mexico
- 7.5.3 Argentina
- 7.5.4 Rest of Latin America
- 7.6 Middle East and Africa
- 7.6.1 Saudi Arabia
- 7.6.2 South Africa
- 7.6.3 UAE
- 7.6.4 Rest of Middle East and Africa
Chapter 8 Company Profiles
- 8.1 Archer Daniels Midland Company
- 8.2 Cargill Inc.
- 8.3 Ingredion Inc.
- 8.4 Kerry Group
- 8.5 Impossible Foods Inc.
- 8.6 The Scoular Company
- 8.7 DSM NV
- 8.8 Lightlife Foods, Inc.
- 8.9 Impossible Foods Inc.
- 8.10 International Flavors & Fragrances, Inc.
- 8.11 Glanbia plc
- 8.12 Bunge Limited
- 8.13 Axiom Foods Inc.
 替代蛋白市场-全球产业规模、份额、趋势、机会、预测:按产品类型、应用、地区和竞争格局划分,2021-2031年
 替代饲料蛋白市场-2026-2031年预测
 下一代乳製品替代品市场预测至2032年:按产品类型、配方、特性、分销管道、成分、应用和地区分類的全球分析植物来源和替代蛋白食品市场预测至2032年:按蛋白质来源、产品类型、形式、分销管道、应用、最终用户和地区分類的全球分析食用昆虫及替代蛋白来源市场预测至2032年:全球原料、昆虫种类、产品形态、通路、应用、最终用户及区域分析
 替代蛋白市场机会、成长驱动因素、产业趋势分析及预测(2025-2034年)替代海鲜市场预测至2032年:按产品类型、产品形态、来源、物种、分销管道和地区分類的全球分析植物基和替代蛋白市场预测至2032年:按产品类型、蛋白质类型、形态、分销管道和地区分類的全球分析
 替代蛋白质的全球市场(~2035年):各类型原料,各用途类型,各性质类型,各形态类型,各地区,产业趋势,预测2032 年替代蛋白质市场预测:按来源、形式、性质、应用和地区分類的全球分析