


 |
市场调查报告书
商品编码
1871223
用于能量收集的压电聚合物市场机会、成长驱动因素、产业趋势分析及预测(2025-2034年)Piezoelectric Polymers for Energy Harvesting Market Opportunity, Growth Drivers, Industry Trend Analysis, and Forecast 2025 - 2034 |
||||||
2024 年全球压电聚合物能量收集市场价值为 4,410 万美元,预计到 2034 年将以 14.3% 的复合年增长率增长至 1.635 亿美元。
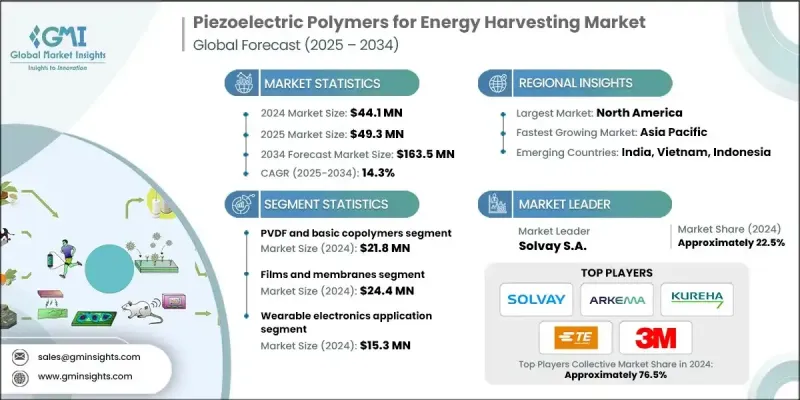
市场成长主要得益于穿戴式装置和物联网设备的日益普及,这些设备需要紧凑、轻巧且灵活的电源。压电聚合物为持续能量产生提供了一种可持续的解决方案,使感测器、健康监测器和连网设备无需频繁更换电池即可运作。消费性电子、医疗保健监测和健身追踪应用领域的需求成长尤为显着。 PVDF 和 PVDF-TrFE 聚合物性能的提升提高了机械柔韧性、耐久性和能量转换效率,使这些材料能够为下一代能量采集系统提供动力。持续的研究和材料创新正在推动其商业应用的拓展,使其在工业和消费性电子领域中得到应用。这些聚合物提供了轻巧、多功能且自供电的解决方案,正日益成为柔性电子产品和微型能量采集设备的首选。
| 市场范围 | |
|---|---|
| 起始年份 | 2024 |
| 预测年份 | 2025-2034 |
| 起始值 | 4410万美元 |
| 预测值 | 1.635亿美元 |
| 复合年增长率 | 14.3% |
2024年,聚偏氟乙烯(PVDF)和碱性共聚物市场规模为2,180万美元,预计2025年至2034年将以13.9%的复合年增长率成长。这些聚合物因其可靠的压电性能、良好的适应性和易加工性而备受青睐。它们广泛应用于穿戴式装置、微型感测器和消费性电子产品,提供高效、永续的能源解决方案。其成本效益和多功能性使其在工业和消费领域广泛应用。
2024年,薄膜和膜材市场规模达到2,440万美元,预计2025年至2034年间将以14.4%的复合年增长率成长。薄膜和膜材因其柔韧性、易于製造以及与穿戴式装置和电子系统的兼容性而成为应用最广泛的材料形式。它们能够实现紧凑的设备设计、轻鬆的层迭和图案化,从而提高能量转换效率。薄膜和膜材在智慧纺织品和柔性电子产品中的应用日益广泛,能够利用使用者的运动在设备内部产生能量。
2024年,北美压电聚合物能量采集市场占33.5%的份额。随着医疗保健、工业自动化和基础设施应用等行业采用自供电感测解决方案,该地区的需求正在成长。智慧基础设施、军事应用和穿戴式装置正在推动美国市场对该技术的采用,这得益于强大的研发投入和对能源效率的监管重点。对智慧城市和国家基础设施项目的投资正在促进基于聚合物的能量采集器整合到道路、桥樑和城市环境中的感测器。製造商正在提高聚合物的耐久性和效率,以确保其在恶劣条件下拥有更长的使用寿命和可靠的性能,从而促进商业规模的部署。
用于能量收集的压电聚合物市场的主要参与者包括3M公司、阿科玛集团、TE Connectivity、Kureha Corporation、索尔维公司等。这些公司正采取多种策略来巩固其市场地位。他们大力投资研发,以提高下一代能量收集器的能量转换效率、机械耐久性和材料柔韧性。与电子产品和穿戴式装置製造商建立合作关係,有助于确保产品在工业和消费领域的应用。各公司正在拓展产品线,以满足微型感测器、智慧纺织品和柔性电子产品的需求。扩大产能、优化供应链和提高成本效益,进一步推动了全球市场的渗透。
目录
第一章:方法论
- 市场范围和定义
- 研究设计
- 研究方法
- 资料收集方法
- 资料探勘来源
- 全球的
- 地区/国家
- 基准估算和计算
- 基准年计算
- 市场估算的关键趋势
- 初步研究和验证
- 原始资料
- 预测模型
- 研究假设和局限性
第二章:执行概要
第三章:行业洞察
- 产业生态系分析
- 供应商格局
- 利润率
- 每个阶段的价值增加
- 影响价值链的因素
- 中断
- 产业影响因素
- 成长驱动因素
- 产业陷阱与挑战
- 供应链的复杂性
- 市场机会
- 成长潜力分析
- 监管环境
- 北美洲
- 欧洲
- 亚太地区
- 拉丁美洲
- 中东和非洲
- 波特的分析
- PESTEL 分析
- 价格趋势
- 按地区
- 副产品
- 未来市场趋势
- 专利格局
- 贸易统计(註:仅提供重点国家的贸易统计)
- 主要进口国
- 主要出口国
- 永续性和环境方面
- 永续实践
- 减少废弃物策略
- 生产中的能源效率
- 环保倡议
- 碳足迹考量
第四章:竞争格局
- 介绍
- 公司市占率分析
- 按地区
- 北美洲
- 欧洲
- 亚太地区
- 拉丁美洲
- MEA
- 按地区
- 公司矩阵分析
- 主要市场参与者的竞争分析
- 竞争定位矩阵
- 关键进展
- 併购
- 合作伙伴关係与合作
- 新产品发布
- 扩张计划
第五章:市场估算与预测:依聚合物类型划分,2021-2034年
- 主要趋势
- 聚偏氟乙烯和碱性共聚物
- 纯PVDF薄膜
- PVDF-HFP共聚物
- 基础型PVDF复合材料
- P(VDF-TrFE) 高级共聚物
- P(VDF-TrFE)薄膜
- P(VDF-TrFE)奈米纤维
- MEMS相容P(VDF-TrFE)
- 聚合物-陶瓷复合材料
- PVDF-BaTiO3复合材料
- PVDF-ZnO奈米复合材料
- 多相陶瓷-聚合物体系
- 特种和新兴聚合物
- 生物基压电聚合物
- 导电聚合物共混物
- 研究阶段新型聚合物
第六章:市场估算与预测:依形式划分,2021-2034年
- 主要趋势
- 薄膜和膜
- 薄膜(<10 μm)
- 标准薄膜(10-100 μm)
- 厚膜(>100 μm)
- 纤维和纺织品
- 静电纺丝奈米纤维
- 包芯纱
- 编织压电织物
- 块体和复合结构
- 3D列印结构
- 模製部件
- 层状复合系统
第七章:市场估计与预测:依应用领域划分,2021-2034年
- 主要趋势
- 穿戴式电子产品
- 智慧纺织品和电子布料
- 健身追踪器和健康监测器
- 智慧手錶及配件
- 电子皮肤(e-skin)应用
- 物联网感测器和无线网路
- 环境监测感测器
- 工业物联网感测器
- 智慧城市基础设施感测器
- 农业和远端监测
- 医疗器械和植入物
- 植入式心臟节律器系统
- 生物感测器和监测设备
- 义肢和辅助设备
- 药物输送系统
- 结构健康监测
- 桥樑和基础设施监测
- 建筑结构监测
- 管道和公用设施监测
- 汽车应用
- 轮胎压力监测系统
- 车辆结构监测
- 车内感测器网络
- 航太与国防
- 飞机结构监测
- 军事感测器网络
- 空间应用
第八章:市场估算与预测:依地区划分,2021-2034年
- 主要趋势
- 北美洲
- 我们
- 加拿大
- 欧洲
- 德国
- 英国
- 法国
- 义大利
- 西班牙
- 欧洲其他地区
- 亚太地区
- 中国
- 印度
- 日本
- 澳洲
- 韩国
- 亚太其他地区
- 拉丁美洲
- 巴西
- 墨西哥
- 阿根廷
- 拉丁美洲其他地区
- 中东和非洲
- 沙乌地阿拉伯
- 南非
- 阿联酋
- 中东和非洲其他地区
第九章:公司简介
- Solvay SA
- Arkema Group
- 3M Company
- Kureha Corporation
- Daikin Industries
- Smart Material Corp
- Measurement Specialties / TE Connectivity
- PI Ceramic
- Noliac A/S
- CeramTec
- Piezotech SA
- USound GmbH
- EnOcean GmbH
- Energiot Ltd
- Ionix Advanced Technologies
- Johnson Matthey
- Murata Manufacturing
- Morgan Advanced Materials
- Honeywell International
- Others (Harri, etc.)
- Matregenix
- APC International
- Physik Instrumente
- Cedrat Technologies
- Perpetuum
The Global Piezoelectric Polymers for Energy Harvesting Market was valued at USD 44.1 million in 2024 and is estimated to grow at a CAGR of 14.3% to reach USD 163.5 million by 2034.
The market's growth is driven by the expanding adoption of wearables and IoT devices, which require compact, lightweight, and flexible power sources. Piezoelectric polymers offer a sustainable solution for continuous energy generation, enabling sensors, health monitors, and connected devices to operate without frequent battery replacement. Rising demand is particularly evident in consumer electronics, healthcare monitoring, and fitness tracking applications. Enhanced performance of PVDF and PVDF-TrFE polymers has improved mechanical flexibility, durability, and energy conversion efficiency, allowing these materials to power next-generation energy-harvesting systems. Continuous research and material innovations are helping expand commercial adoption, enabling applications in both industrial and consumer electronics sectors. These polymers provide lightweight, versatile, and self-powered solutions that are increasingly preferred for flexible electronics and micro-energy harvesting devices.
| Market Scope | |
|---|---|
| Start Year | 2024 |
| Forecast Year | 2025-2034 |
| Start Value | $44.1 million |
| Forecast Value | $163.5 million |
| CAGR | 14.3% |
The PVDF and basic copolymers segment was valued at USD 21.8 million in 2024 and is expected to grow at a CAGR of 13.9% from 2025 to 2034. These polymers are favored for their reliable piezoelectric performance, adaptability, and ease of processing. They are widely applied in wearables, miniaturized sensors, and consumer electronics, providing efficient, self-sustaining energy solutions. Their cost-effectiveness and versatility support consistent adoption across industrial and consumer applications.
The films and membranes segment reached USD 24.4 million in 2024 and is projected to grow at a CAGR of 14.4% during 2025-2034. Films and membranes are the most used forms because of their flexibility, ease of manufacturing, and compatibility with wearable and electronic systems. They allow compact device designs, easy layering, and patterning to improve energy conversion efficiency. Their use is increasing in smart textiles and flexible electronics, enabling in-device energy generation from user movements.
North America Piezoelectric Polymers for Energy Harvesting Market held a 33.5% share in 2024. Demand in the region is growing as industries adopt self-powered sensing solutions across healthcare, industrial automation, and infrastructure applications. Smart infrastructure, military applications, and wearables are driving adoption in the U.S., supported by strong R&D and regulatory focus on energy efficiency. Investments in smart cities and national infrastructure projects are promoting the integration of polymer-based energy harvesters in sensors across roads, bridges, and urban environments. Manufacturers are enhancing polymer durability and efficiency to ensure long lifespans and reliable performance in harsh conditions, facilitating commercial-scale deployment.
Key players in the Piezoelectric Polymers for Energy Harvesting Market include 3M Company, Arkema Group, TE Connectivity, Kureha Corporation, Solvay S.A., and others. Companies in the Piezoelectric Polymers for Energy Harvesting Market are pursuing several strategies to strengthen their market position. They are investing heavily in R&D to improve energy conversion efficiency, mechanical durability, and material flexibility for next-generation energy harvesters. Partnerships with electronics and wearable device manufacturers help secure adoption in industrial and consumer applications. Firms are diversifying product lines to cater to miniaturized sensors, smart textiles, and flexible electronics. Scaling production capacity, optimizing supply chains, and enhancing cost-effectiveness are further enabling global market penetration.
Table of Contents
Chapter 1 Methodology
- 1.1 Market scope and definition
- 1.2 Research design
- 1.2.1 Research approach
- 1.2.2 Data collection methods
- 1.3 Data mining sources
- 1.3.1 Global
- 1.3.2 Regional/Country
- 1.4 Base estimates and calculations
- 1.4.1 Base year calculation
- 1.4.2 Key trends for market estimation
- 1.5 Primary research and validation
- 1.5.1 Primary sources
- 1.6 Forecast model
- 1.7 Research assumptions and limitations
Chapter 2 Executive Summary
- 2.1 Industry 3600 synopsis
- 2.2 Key market trends
- 2.2.1 Regional
- 2.2.2 Polymer Type
- 2.2.3 Form
- 2.2.4 Application
- 2.3 TAM Analysis, 2025-2034
- 2.4 CXO perspectives: Strategic imperatives
- 2.4.1 Executive decision points
- 2.4.2 Critical success factors
- 2.5 Future Outlook and Strategic Recommendations
Chapter 3 Industry Insights
- 3.1 Industry ecosystem analysis
- 3.1.1 Supplier Landscape
- 3.1.2 Profit Margin
- 3.1.3 Value addition at each stage
- 3.1.4 Factor affecting the value chain
- 3.1.5 Disruptions
- 3.2 Industry impact forces
- 3.2.1 Growth drivers
- 3.2.2 Industry pitfalls and challenges
- 3.2.2.1 Supply chain complexity
- 3.2.3 Market opportunities
- 3.3 Growth potential analysis
- 3.4 Regulatory landscape
- 3.4.1 North America
- 3.4.2 Europe
- 3.4.3 Asia Pacific
- 3.4.4 Latin America
- 3.4.5 Middle East & Africa
- 3.5 Porter's analysis
- 3.6 PESTEL analysis
- 3.6.1 Technology and Innovation landscape
- 3.6.2 Current technological trends
- 3.6.3 Emerging technologies
- 3.7 Price trends
- 3.7.1 By region
- 3.7.2 By product
- 3.8 Future market trends
- 3.9 Patent Landscape
- 3.10 Trade statistics (Note: the trade statistics will be provided for key countries only)
- 3.10.1 Major importing countries
- 3.10.2 Major exporting countries
- 3.11 Sustainability and Environmental Aspects
- 3.11.1 Sustainable Practices
- 3.11.2 Waste Reduction Strategies
- 3.11.3 Energy Efficiency in Production
- 3.11.4 Eco-friendly Initiatives
- 3.12 Carbon Footprint Considerations
Chapter 4 Competitive Landscape, 2024
- 4.1 Introduction
- 4.2 Company market share analysis
- 4.2.1 By region
- 4.2.1.1 North America
- 4.2.1.2 Europe
- 4.2.1.3 Asia Pacific
- 4.2.1.4 LATAM
- 4.2.1.5 MEA
- 4.2.1 By region
- 4.3 Company matrix analysis
- 4.4 Competitive analysis of major market players
- 4.5 Competitive positioning matrix
- 4.6 Key developments
- 4.6.1 Mergers & acquisitions
- 4.6.2 Partnerships & collaborations
- 4.6.3 New Product Launches
- 4.6.4 Expansion Plans
Chapter 5 Market Estimates and Forecast, By Polymer Type, 2021 - 2034 (USD Million, Kilo Tons)
- 5.1 Key trends
- 5.2 PVDF and Basic Copolymers
- 5.2.1 Pure PVDF Films
- 5.2.2 PVDF-HFP Copolymers
- 5.2.3 Basic PVDF Composites
- 5.3 P(VDF-TrFE) Advanced Copolymers
- 5.3.1 P(VDF-TrFE) Thin Films
- 5.3.2 P(VDF-TrFE) Nanofibers
- 5.3.3 MEMS-Compatible P(VDF-TrFE)
- 5.4 Polymer-Ceramic Composites
- 5.4.1 PVDF-BaTiO3 Composites
- 5.4.2 PVDF-ZnO Nanocomposites
- 5.4.3 Multi-phase Ceramic-Polymer Systems
- 5.5 Specialty and Emerging Polymers
- 5.5.1 Bio-based Piezoelectric Polymers
- 5.5.2 Conductive Polymer Blends
- 5.5.3 Research-stage Novel Polymers
Chapter 6 Market Estimates and Forecast, By Form, 2021 - 2034 (USD Million, Kilo Tons)
- 6.1 Key trends
- 6.2 Films and membranes
- 6.2.1 Thin films (<10 μm)
- 6.2.2 Standard films (10-100 μm)
- 6.2.3 Thick films (>100 μm)
- 6.3 Fibers and textiles
- 6.3.1 Electrospun nanofibers
- 6.3.2 Core-spun yarns
- 6.3.3 Woven piezoelectric fabrics
- 6.4 Bulk and composite structures
- 6.4.1 3D-printed structures
- 6.4.2 Molded components
- 6.4.3 Layered composite systems
Chapter 7 Market Estimates and Forecast, By Application, 2021 - 2034 (USD Million, , Kilo Tons)
- 7.1 Key trends
- 7.2 Wearable electronics
- 7.2.1 Smart textiles and e-fabrics
- 7.2.2 Fitness trackers and health monitors
- 7.2.3 Smart watches and accessories
- 7.2.4 Electronic skin (e-skin) applications
- 7.3 IoT sensors and wireless networks
- 7.3.1 Environmental monitoring sensors
- 7.3.2 Industrial IoT sensors
- 7.3.3 Smart city infrastructure sensors
- 7.3.4 Agricultural and remote monitoring
- 7.4 Medical devices and implants
- 7.4.1 Implantable pacemaker systems
- 7.4.2 Biosensors and monitoring devices
- 7.4.3 Prosthetics and assistive devices
- 7.4.4 Drug delivery systems
- 7.5 Structural health monitoring
- 7.5.1 Bridge and infrastructure monitoring
- 7.5.2 Building structural monitoring
- 7.5.3 Pipeline and utility monitoring
- 7.6 Automotive applications
- 7.6.1 Tire pressure monitoring systems
- 7.6.2 Vehicle structural monitoring
- 7.6.3 In-cabin sensor networks
- 7.7 Aerospace and defense
- 7.7.1 Aircraft structural monitoring
- 7.7.2 Military sensor networks
- 7.7.3 Space applications
Chapter 8 Market Estimates and Forecast, By Region, 2021 - 2034 (USD Million, Kilo Tons)
- 8.1 Key trends
- 8.2 North America
- 8.2.1 U.S.
- 8.2.2 Canada
- 8.3 Europe
- 8.3.1 Germany
- 8.3.2 UK
- 8.3.3 France
- 8.3.4 Italy
- 8.3.5 Spain
- 8.3.6 Rest of Europe
- 8.4 Asia Pacific
- 8.4.1 China
- 8.4.2 India
- 8.4.3 Japan
- 8.4.4 Australia
- 8.4.5 South Korea
- 8.4.6 Rest of Asia Pacific
- 8.5 Latin America
- 8.5.1 Brazil
- 8.5.2 Mexico
- 8.5.3 Argentina
- 8.5.4 Rest of Latin America
- 8.6 Middle East & Africa
- 8.6.1 Saudi Arabia
- 8.6.2 South Africa
- 8.6.3 UAE
- 8.6.4 Rest of Middle East & Africa
Chapter 9 Company Profiles
- 9.1 Solvay S.A.
- 9.2 Arkema Group
- 9.3 3M Company
- 9.4 Kureha Corporation
- 9.5 Daikin Industries
- 9.6 Smart Material Corp
- 9.7 Measurement Specialties / TE Connectivity
- 9.8 PI Ceramic
- 9.9 Noliac A/S
- 9.10 CeramTec
- 9.11 Piezotech S.A.
- 9.12 USound GmbH
- 9.13 EnOcean GmbH
- 9.14 Energiot Ltd
- 9.15 Ionix Advanced Technologies
- 9.16 Johnson Matthey
- 9.17 Murata Manufacturing
- 9.18 Morgan Advanced Materials
- 9.19 Honeywell International
- 9.20 Others (Harri, etc.)
- 9.21 Matregenix
- 9.22 APC International
- 9.23 Physik Instrumente
- 9.24 Cedrat Technologies
- 9.25 Perpetuum
 2034年全球月球能量采集市场机会与策略
 全球能源采集系统市场:按应用、终端用途系统、组件、技术、振动技术、国家和地区划分-产业分析、市场规模、份额和预测(2025-2032年)
 全球能量采集系统市场:市场规模、占有率、成长率、产业分析、依类型、应用和地区划分的分析以及未来预测(2026-2034 年)
 振动能量采集系统市场-全球产业规模、份额、趋势、机会及预测(依产品、应用、区域及竞争格局划分,2021-2031年)
 微型太阳能发电市场规模、份额及成长分析(按应用和地区划分)-2026-2033年产业预测
 能源采集市场规模、份额和成长分析(按技术、组件、应用、最终用户和地区划分)-2026-2033年产业预测
 能源采集系统市场规模、份额及成长分析(依技术、组件、最终用途、应用及地区划分)-2026-2033年产业预测
 飞轮市场规模、份额和成长分析(按类型、产品类型和地区划分)-2026-2033年产业预测
 能源采集系统市场规模、份额和趋势分析报告:按技术、振动技术、应用、组件、地区和细分市场预测(2026-2033 年)能源采集设备市场-2025-2030年预测