


 |
市场调查报告书
商品编码
1851505
能源采集系统:市场占有率分析、产业趋势、统计数据和成长预测(2025-2030 年)Energy Harvesting Systems - Market Share Analysis, Industry Trends & Statistics, Growth Forecasts (2025 - 2030) |
||||||
※ 本网页内容可能与最新版本有所差异。详细情况请与我们联繫。
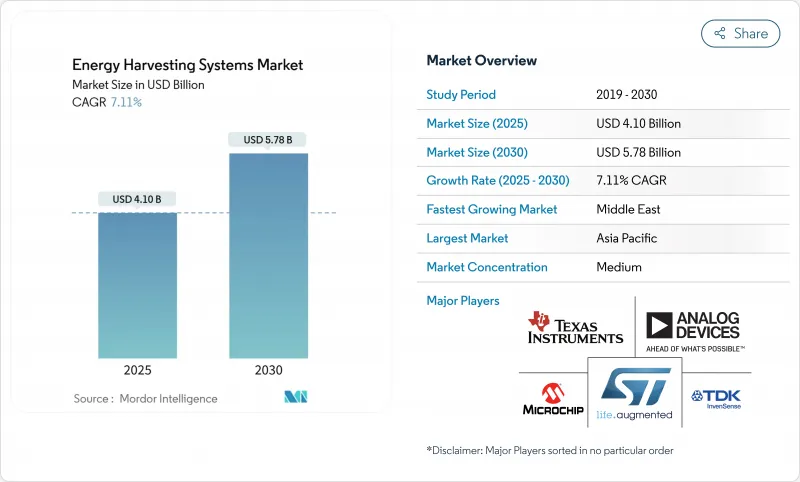
预计到 2025 年,能源采集系统市场规模将达到 41 亿美元,到 2030 年将达到 57.8 亿美元,年复合成长率为 7.11%。
对无电池物联网 (IoT) 设备日益增长的需求,以及工业和消费领域超低功耗电子产品的普及,正在推动这一成长。电源管理积体电路的快速小型化是推动这一成长的主要动力,如今,这些积体电路已将复杂的调节功能整合到亚毫米级的尺寸中。同时,减少一次性电池废弃物的政策压力也提升了能源采集解决方案的价值提案。生态系统伙伴关係关係也将促进市场发展,加速承包模组和参考设计的上市速度,进一步推动智慧建筑、工厂和穿戴式装置等领域的应用。这些因素共同增强了能源采集系统市场未来十年的发展前景。
全球能源采集系统市场趋势与洞察
智慧建筑中无电池物联网感测器节点的普及
欧盟生态设计法规2024/1781强制要求商业建筑使用节能控制系统,促使楼宇管理人员转向使用无电池无线感测器。巴黎和奥维耶多的试点研究表明,透过整合太阳能和射频供电的感测器,并通讯居住和环境数据,平均可节省36.8千瓦的电力。射频能量采集器可转换10%至50%的环境能量,在受控室内区域转换效率可达70%以上,确保感测器在建筑物的整个生命週期内持续运作。业主越来越关注整体拥有成本,并意识到三次电池更换週期的成本超过了感测器的初始硬体成本,因此正在加速向能量采集解决方案转型。随着采购团队将预算从维护转向支援分析功能的硬件,商业房地产行业对能源采集系统市场的需求持续旺盛。
亚太地区工厂对永续、低功耗自动化的需求
中国、日本和韩国的工业集团已部署能量采集器,以履行企业碳减排承诺并减少因更换电池而导致的非计划停机时间。西班牙电信技术公司(Telefónica Tech)在石油和气体纯化部署了经ATEX认证的热电发电机,为振动节点供电,因为这些场所的电池供应受到严格限制。韩国科学技术研究院的调查团队开发了一种混合能量采集器,结合了热电效应和压电效应,使重型机械监测的输出功率提高了50%以上。密集的製造生态系统促进了试点部署,并实现了零件供应商之间的快速回馈循环,从而进一步降低了零件成本。随着监管审核越来越重视生产工厂的能源基准,经营团队正日益在多个工厂中标准化能量收集平台,从而形成区域性的发展势头。
农村地区环境射频能量密度低
田间试验表明,70%的种植者放弃了无线感测器试点计画。农业技术整合商目前正将小型太阳能瓦片和振动条与灌溉帮浦结合使用,以应对阴天和射频讯号较弱的问题。然而,混合设计增加了成本,也使维护计画更加复杂,减缓了成本敏感型农场的广泛采用。在农村连接基础设施扩展之前,此限制因素将推动农业和环境监测能源采集系统市场短期内的成长。
细分市场分析
到2024年,基于光的光伏能量采集器将占据能源采集系统市场42%的份额。由于其技术成熟度高、每瓦成本低且昼夜能量变化可预测,光伏技术在建筑和户外装置领域仍保持领先地位。然而,随着5G网路的密集部署增加可用于为感测器供电的环境电磁波水平,射频能量采集技术到2030年的复合年增长率将达到11%。振动和电磁波能量采集器适用于旋转式高能量机械,而热席贝克装置则在汽车废气和工业炉等领域找到了应用空间。融合多种模式的混合架构可在光照或运动停滞期间提供持续的能量收集,因此非常适合关键任务应用情境。随着整合商将智慧最大功率点追踪与自适应储存相结合,以优化波动电源的产量比率效率,能源采集系统市场变得越来越具有韧性。
环境式能量采集系统的展示案例也层出不穷。 Ambient 光电在200勒克斯光照强度下实现了传统电池三倍的输出功率,从而为室内遥控器和键盘的应用奠定了基础。同时,韩国科学技术研究院(KIST)报告称,透过在悬臂梁平台上融合热电和压电通道,实现了50%的输出功率提升。这些进步促使目标商标产品製造商(OEM)在其提案书中指定采用多源设计,因为这种设计可以缩短投资回收期并延长运作保证。随着射频能量采集效率的提高和组件价格的下降,能源采集系统市场将出现融合模组,这些模组能够每隔几毫秒自动选择最高效的能量来源,以满足负载需求。
至2024年,电源管理IC将占能源采集系统市场规模的38%。随着设计人员不再局限于单一电源架构,而是需要专用转换层,能量采集感测器市场到2030年将以9.5%的复合年增长率成长。薄膜电池和超级电容用于缓衝间歇性能量流,而超低功耗微控制器则负责进行分析,从而验证感测器部署的合理性。意法半导体(STMicroelectronics)的SPV1050对太阳能和热电输入的转换效率高达99%,凸显了精密的调节技术如何延长节点寿命。旭化成(Asahi Kasei)的AP4413系列将电池平衡和涓流充电控制整合到1.43mm²的晶粒上,为对成本敏感的消费性电子产品提供能量采集解决方案。
产业发展蓝图正朝着系统晶片晶片封装(SoC)的方向发展,这种封装将能量采集前端、降压转换器和微控制器整合在单一层压板中。这种整合消除了板级互连损耗,简化了认证流程,并拓宽了可应用场景的范围,从工业自动化到智慧玩具。在预测期内,整合式电源管理积体电路(PMIC)的平均售价将下降,这将进一步巩固能源采集系统的市场。
能源采集系统市场按技术(光能能源采集、振动能源采集及其他)、组件(能源采集转换器、电源管理IC及其他)、功率范围(小于10MW、10-100MW及其他)、应用(消费电子、楼宇及家庭自动化、工业IoT及自动化及其他)及地区进行细分。市场预测以美元计价。
区域分析
到2024年,亚洲将占全球销售额的35%,这得益于中国庞大的物联网部署以及日本在压电材料领域的领先地位(例如TDK公司tdk.com)。从首尔到深圳,政府支持的智慧城市计画正在津贴感测器基础设施建设,委託製造製造商则提供了经济高效的组装方案,缩短了产品週期。韩国的半导体生态系统正在拓展客製化电源管理积体电路(PMIC)製造,新加坡的物流园区正在测试大规模环境物联网阵列,以展示能量采集器在实际应用中的稳健性。
中东地区将呈现最快的成长轨迹,到2030年年均复合成长率将达到9.2%。沙乌地阿拉伯的「2030愿景」将可再生能源置于其特大城市规划的核心位置,而阿克萨清真寺的室内导航信标正在试用压电地地板材料,这种地砖可以将朝圣者的脚步转化为电网电力。波湾合作理事会的电力公司正在将太阳能发电装置整合到智慧电錶机壳中,从而避免了派遣卡车进行电池维护的需要。以色列和阿联酋已组成了一个区域研发丛集,将奈米材料研究所与创投基金结合,以加速高效能能量收集器的商业化进程。
北美和欧洲市场对能源产品的需求日趋成熟且强劲,同时法律规范也强调生命週期永续性。美国能源局提案对充电器的待机功率设定更严格的限制,引导家电製造商走上绿色能源发展之路。德国和英国正在为工厂的旋转机械配备振动能量采集器,并指出其在三到五年内可带来净现值收益。在这些经济体中,工程团队在选择感测器平台时会量化碳减排量,这使得能源采集系统市场订单稳定成长,儘管其初始投资较高。
其他福利:
- Excel格式的市场预测(ME)表
- 3个月的分析师支持
目录
第一章 引言
- 研究假设和市场定义
- 调查范围
第二章调查方法
第三章执行摘要
第四章 市场情势
- 市场概览
- 市场驱动因素
- 无电池物联网感测器节点在智慧建筑中的普及(欧洲、北美)
- 亚太地区工厂必须推行永续、低功耗自动化。
- 超低功耗MCU的快速小型化,使其达到亚瓦阈值
- 无线状态监测技术在铁路和航空OEM厂商的应用日益广泛
- 将太阳能收集器整合到穿戴式装置和医疗贴片中
- 市场限制
- 农村地区环境射频能量密度低
- 缺乏通用的电源管理标准
- 竞争性的低功耗广域网路电池减少了对车载能量采集器的需求。
- 交通设施维修的初始设计和整合成本高昂
- 价值/供应链分析
- 监理与技术展望
- 波特五力分析
- 供应商的议价能力
- 买方的议价能力
- 新进入者的威胁
- 替代品的威胁
- 竞争对手之间的竞争
- 投资分析
第五章 市场规模与成长预测
- 透过技术
- 光能(太阳能/光伏)能源采集
- 振动(压电和电磁)能源采集
- 热能(席贝克/热电)能源采集
- 射频能源采集
- 混合/多源能源采集
- 按组件
- 能源采集转换器
- 电源管理积体电路
- 储能单元(薄膜电池、超级电容)
- 超低功耗感测器和微控制器
- 按输出范围
- 小于10微瓦
- 10至100微瓦
- 100微瓦至1毫瓦
- 1~10 mW
- 10毫瓦或以上
- 透过使用
- 消费性电子产品
- 楼宇和家庭自动化
- 工业IoT和自动化
- 运输
- 车
- 铁路
- 航空业
- 医疗保健和穿戴式设备
- 国防与安全
- 农业与环境监测
- 按地区
- 北美洲
- 美国
- 加拿大
- 墨西哥
- 欧洲
- 德国
- 英国
- 法国
- 义大利
- 西班牙
- 北欧国家(瑞典、挪威、丹麦、芬兰)
- 比荷卢经济联盟(比利时、荷兰、卢森堡)
- 亚太地区
- 中国
- 日本
- 印度
- 韩国
- 东协(新加坡、马来西亚、泰国、印尼、菲律宾、越南)
- 南美洲
- 巴西
- 阿根廷
- 中东
- 沙乌地阿拉伯
- 阿拉伯聯合大公国
- 以色列
- 土耳其
- 非洲
- 南非
- 奈及利亚
- 肯亚
- 北美洲
第六章 竞争情势
- 市场集中度
- 策略趋势
- 市占率分析
- 公司简介
- Microchip Technology Inc.
- STMicroelectronics NV
- Texas Instruments Incorporated
- Analog Devices Inc.
- Renesas Electronics Corporation
- NXP Semiconductors NV
- onsemi(ON Semiconductor Corp.)
- TDK Corporation(InvenSense)
- Powercast Corporation
- Cymbet Corporation
- EnOcean GmbH
- e-peas SA
- ABB Ltd.
- Advanced Linear Devices Inc.
- Cap-XX Limited
- Fujitsu Components America Inc.
- G24 Power Ltd.
- Drayson Technologies Ltd.
- Piezo.com(Mide Technology)
- LORD MicroStrain(Parker Hannifin)
第七章 市场机会与未来展望
The energy harvesting systems market size is USD 4.10 billion in 2025 and is forecast to climb to USD 5.78 billion by 2030, advancing at a 7.11% CAGR.
Rising demand for battery-free Internet-of-Things (IoT) devices and the spread of ultra-low-power electronics across industrial and consumer environments underpin this growth. Momentum stems from rapid miniaturization in power-management integrated circuits that now squeeze sophisticated regulation functions into sub-millimeter footprints, while policy pressure to cut disposable battery waste reinforces the value proposition for energy harvesting solutions. Developers also benefit from ecosystem partnerships that speed time-to-market for turnkey modules and reference designs, further lifting adoption in smart buildings, factories, and wearables. Together, these forces strengthen the energy harvesting systems market outlook during the current decade.
Global Energy Harvesting Systems Market Trends and Insights
Proliferation of Battery-less IoT Sensor Nodes in Smart Buildings
The European Union Ecodesign Regulation 2024/1781 obliges commercial properties to use energy-efficient control systems, which pushes building managers toward battery-free wireless sensors Demonstrations in Paris and Oviedo logged 36.8 kW average power savings after integrating solar and RF-powered sensors that communicate occupancy and environmental data. RF harvesters convert 10-50% of ambient energy and more than 70% in tuned indoor zones, keeping sensors operational for the entire building life cycle. Facility owners increasingly weigh total cost of ownership and find that three battery replacement cycles eclipse initial sensor hardware costs, accelerating migration to harvesting solutions. As procurement teams pivot budgets from maintenance to analytics-ready hardware, the energy harvesting systems market gains sustained demand from the commercial real-estate sector.
Mandates for Sustainable Low-Power Automation in APAC Factories
Industrial groups across China, Japan, and South Korea install harvesters to satisfy corporate carbon pledges and cut unscheduled downtime tied to battery swaps. Telefonica Tech rolled out ATEX-certified thermoelectric generators that power vibration nodes in oil and gas refineries where battery access is tightly restricted. Researchers at the Korea Institute of Science and Technology combined thermoelectric and piezoelectric effects in a hybrid harvester that boosts power output by more than 50% for heavy-machinery monitoring. Dense manufacturing ecosystems allow quick feedback loops between pilot deployments and component suppliers, further trimming bill-of-materials cost. As regulatory audits emphasize energy baselines in production plants, executives increasingly standardize harvesting platforms across multiple factory sites, reinforcing regional momentum.
Low Energy Density of Ambient RF in Rural Installations
Field trials show that 70% of growers abandon wireless sensor pilots because nodes exhaust batteries faster than expected, a gap magnified where RF density dips below harvestable levels. Agritech integrators now blend small solar tiles with vibration strips on irrigation pumps to hedge against cloudy seasons and weak RF signals. Even so, hybrid designs raise costs and complicate maintenance schedules, delaying wide deployment in cost-sensitive farms. Until rural connectivity infrastructure expands, this restraint caps immediate upside for the energy harvesting systems market in agriculture and environmental monitoring.
Other drivers and restraints analyzed in the detailed report include:
- Rapid Miniaturization of Ultra-Low-Power MCUs Enabling Sub-µW Thresholds
- Growing Deployment of Wireless Condition-Monitoring in Rail & Aviation OEMs
- Absence of Universal Power-Management Standards
For complete list of drivers and restraints, kindly check the Table Of Contents.
Segment Analysis
Light-based photovoltaic harvesters controlled 42% of the energy harvesting systems market share in 2024. Superior maturity, low cost per watt, and predictable diurnal energy profiles keep photovoltaics in pole position for building and outdoor installations. RF harvesting, however, posts an 11% CAGR to 2030 as dense 5G deployments raise ambient electromagnetic levels that can be scavenged for sensor power. Vibration and electromagnetic harvesters serve machinery where rotational energy is plentiful, while thermal Seebeck devices find niches in automotive exhaust and industrial furnaces. Hybrid architectures that blend multiple modalities deliver continuity during light or motion lulls, appealing to mission-critical use cases. The energy harvesting systems market gains resilience as integrators pair intelligent maximum-power-point tracking with adaptive storage to optimize yield across variable sources.
Hybrid proof points abound. Ambient Photonics records triple the power output in 200 lux compared with legacy cells, unlocking indoor remote controls and keyboards. Meanwhile, the Korea Institute of Science and Technology reports a 50% power bump by merging thermoelectric and piezoelectric channels in a cantilever platform. These advances compress payback periods and extend uptime guarantees, encouraging original-equipment manufacturers to specify multi-source designs in request-for-proposal documents. As RF harvesting efficiency rises and component prices drop, the energy harvesting systems market will witness converged modules that auto-select the most productive source every few milliseconds to sustain load demands.
Power-management ICs captured 38% of the energy harvesting systems market size in 2024 by value because every harvester topology requires accurate voltage regulation and storage orchestration. Energy-harvesting transducers exhibit a 9.5% CAGR to 2030 as designers diversify beyond single-source architectures and need specialized conversion layers. Thin-film batteries and supercapacitors buffer intermittent energy streams, while ultra-low-power microcontrollers perform the analytics that justify sensor deployments. STMicroelectronics' SPV1050 achieves up to 99% conversion efficiency for photovoltaic and thermoelectric inputs, highlighting how sophisticated regulation extends node lifetimes. Asahi Kasei's AP4413 series integrates cell-balancing and trickle-charge control in a 1.43 mm2 die, bringing harvesting solutions to cost-sensitive consumer gadgets.
Industry roadmaps converge on system-on-chip packages that embed harvesting front ends, buck-boost converters, and microcontrollers within a single laminate. This consolidation removes board-level interconnect losses and simplifies certification, expanding addressable use cases from industrial automation to smart toys. Over the forecast window, falling ASPs for integration-ready PMICs will spur volume shipments, further fortifying the energy harvesting systems market.
Energy Harvesting Systems Market is Segmented by Technology (Light Energy Harvesting, Vibration Energy Harvesting, and More), Component (Energy-Harvesting Transducers, Power-Management ICs, and More), Power Range (Less Than 10 MW, 10-100 MW, and More), Application (Consumer Electronics, Building and Home Automation, Industrial IoT and Automation, and More), Geography. The Market Forecasts are Provided in Terms of Value (USD).
Geography Analysis
Asia held 35% of 2024 global revenue, benefiting from China's immense IoT roll-outs and Japan's leadership in piezoelectric materials through firms such as TDK Corporation tdk.com. Government-backed smart-city programs from Seoul to Shenzhen subsidize sensor infrastructure, while contract manufacturers in Taiwan and Malaysia offer cost-efficient assembly paths that shorten product cycles. South Korea's semiconductor ecosystem extends bespoke PMIC fabrication, and Singapore's logistics parks test large-scale ambient IoT arrays that showcase real-world harvester robustness.
The Middle East records the fastest trajectory at a 9.2% CAGR to 2030. Saudi Arabia's Vision 2030 positions renewable energy at the center of megacity planning, and indoor navigation beacons at the Al-Haram mosque now trial piezo tile flooring that converts pilgrim footsteps into grid power doi.org. Gulf Cooperation Council utilities integrate photovoltaic harvesters into smart-meter housings to avoid truck rolls for battery service. Israel and the United Arab Emirates anchor regional R&D clusters that pair nano-material labs with venture funds, accelerating commercialization timelines for high-efficiency harvesters.
North America and Europe show mature yet solid demand tied to regulatory frameworks that emphasize lifecycle sustainability. The United States Department of Energy proposes stricter standby limits for chargers, nudging appliance makers toward ambient power paths. Germany and the United Kingdom equip factories with vibration harvesters for rotating machinery, citing net present value gains over three to five years. Across these economies, engineering teams now quantify carbon abatement when selecting sensor platforms, a trend that channels steady orders into the energy harvesting systems market even where initial capital outlay is higher.
- Microchip Technology Inc.
- STMicroelectronics N.V.
- Texas Instruments Incorporated
- Analog Devices Inc.
- Renesas Electronics Corporation
- NXP Semiconductors N.V.
- onsemi (ON Semiconductor Corp.)
- TDK Corporation (InvenSense)
- Powercast Corporation
- Cymbet Corporation
- EnOcean GmbH
- e-peas S.A.
- ABB Ltd.
- Advanced Linear Devices Inc.
- Cap-XX Limited
- Fujitsu Components America Inc.
- G24 Power Ltd.
- Drayson Technologies Ltd.
- Piezo.com (Mide Technology)
- LORD MicroStrain (Parker Hannifin)
Additional Benefits:
- The market estimate (ME) sheet in Excel format
- 3 months of analyst support
TABLE OF CONTENTS
1 INTRODUCTION
- 1.1 Study Assumptions and Market Definition
- 1.2 Scope of the Study
2 RESEARCH METHODOLOGY
3 EXECUTIVE SUMMARY
4 MARKET LANDSCAPE
- 4.1 Market Overview
- 4.2 Market Drivers
- 4.2.1 Proliferation of Battery-less IoT Sensor Nodes in Smart Buildings (Europe and North America)
- 4.2.2 Mandates for Sustainable Low-Power Automation in APAC Factories
- 4.2.3 Rapid Miniaturization of Ultra-Low-Power MCUs Enabling Sub-W Thresholds
- 4.2.4 Growing Deployment of Wireless Condition-Monitoring in Rail and Aviation OEMs
- 4.2.5 Integration of Photovoltaic Harvesters into Wearables and Medical Patches
- 4.3 Market Restraints
- 4.3.1 Low Energy Density of Ambient RF in Rural Installations
- 4.3.2 Absence of Universal Power-Management Standards
- 4.3.3 Competing LPWAN Batteries Reducing Need for On-Board Harvesters
- 4.3.4 High Up-front Design-Integration Costs for Transportation Retrofits
- 4.4 Value / Supply-Chain Analysis
- 4.5 Regulatory and Technological Outlook
- 4.6 Porter's Five Forces Analysis
- 4.6.1 Bargaining Power of Suppliers
- 4.6.2 Bargaining Power of Buyers
- 4.6.3 Threat of New Entrants
- 4.6.4 Threat of Substitutes
- 4.6.5 Intensity of Competitive Rivalry
- 4.7 Investment Analysis
5 MARKET SIZE AND GROWTH FORECASTS (VALUE)
- 5.1 By Technology
- 5.1.1 Light (Solar/Photovoltaic) Energy Harvesting
- 5.1.2 Vibration (Piezoelectric and Electromagnetic) Energy Harvesting
- 5.1.3 Thermal (Seebeck / Thermoelectric) Energy Harvesting
- 5.1.4 RF (Radio-Frequency) Energy Harvesting
- 5.1.5 Hybrid / Multi-Source Energy Harvesting
- 5.2 By Component
- 5.2.1 Energy-Harvesting Transducers
- 5.2.2 Power-Management ICs
- 5.2.3 Energy-Storage Units (Thin-Film Batteries, Supercapacitors)
- 5.2.4 Ultra-Low-Power Sensors and MCUs
- 5.3 By Power Range
- 5.3.1 Less than 10 micro W
- 5.3.2 10-100 micro W
- 5.3.3 100 micro W-1 mW
- 5.3.4 1-10 mW
- 5.3.5 Greater than 10 mW
- 5.4 By Application
- 5.4.1 Consumer Electronics
- 5.4.2 Building and Home Automation
- 5.4.3 Industrial IoT and Automation
- 5.4.4 Transportation
- 5.4.4.1 Automotive
- 5.4.4.2 Rail
- 5.4.4.3 Aviation
- 5.4.5 Healthcare and Wearables
- 5.4.6 Defense and Security
- 5.4.7 Agriculture and Environmental Monitoring
- 5.5 By Geography
- 5.5.1 North America
- 5.5.1.1 United States
- 5.5.1.2 Canada
- 5.5.1.3 Mexico
- 5.5.2 Europe
- 5.5.2.1 Germany
- 5.5.2.2 United Kingdom
- 5.5.2.3 France
- 5.5.2.4 Italy
- 5.5.2.5 Spain
- 5.5.2.6 Nordics (Sweden, Norway, Denmark, Finland)
- 5.5.2.7 Benelux (Belgium, Netherlands, Luxembourg)
- 5.5.3 Asia-Pacific
- 5.5.3.1 China
- 5.5.3.2 Japan
- 5.5.3.3 India
- 5.5.3.4 South Korea
- 5.5.3.5 ASEAN (Singapore, Malaysia, Thailand, Indonesia, Philippines, Vietnam)
- 5.5.4 South America
- 5.5.4.1 Brazil
- 5.5.4.2 Argentina
- 5.5.5 Middle East
- 5.5.5.1 Saudi Arabia
- 5.5.5.2 United Arab Emirates
- 5.5.5.3 Israel
- 5.5.5.4 Turkey
- 5.5.6 Africa
- 5.5.6.1 South Africa
- 5.5.6.2 Nigeria
- 5.5.6.3 Kenya
- 5.5.1 North America
6 COMPETITIVE LANDSCAPE
- 6.1 Market Concentration
- 6.2 Strategic Moves
- 6.3 Market Share Analysis
- 6.4 Company Profiles {(includes Global level Overview, Market level overview, Core Segments, Financials as available, Strategic Information, Market Rank/Share for key companies, Products and Services, and Recent Developments)}
- 6.4.1 Microchip Technology Inc.
- 6.4.2 STMicroelectronics N.V.
- 6.4.3 Texas Instruments Incorporated
- 6.4.4 Analog Devices Inc.
- 6.4.5 Renesas Electronics Corporation
- 6.4.6 NXP Semiconductors N.V.
- 6.4.7 onsemi (ON Semiconductor Corp.)
- 6.4.8 TDK Corporation (InvenSense)
- 6.4.9 Powercast Corporation
- 6.4.10 Cymbet Corporation
- 6.4.11 EnOcean GmbH
- 6.4.12 e-peas S.A.
- 6.4.13 ABB Ltd.
- 6.4.14 Advanced Linear Devices Inc.
- 6.4.15 Cap-XX Limited
- 6.4.16 Fujitsu Components America Inc.
- 6.4.17 G24 Power Ltd.
- 6.4.18 Drayson Technologies Ltd.
- 6.4.19 Piezo.com (Mide Technology)
- 6.4.20 LORD MicroStrain (Parker Hannifin)
7 MARKET OPPORTUNITIES AND FUTURE OUTLOOK
- 7.1 White-space and Unmet-Need Assessment
 2034年全球月球能量采集市场机会与策略
 全球能源采集系统市场:按应用、终端用途系统、组件、技术、振动技术、国家和地区划分-产业分析、市场规模、份额和预测(2025-2032年)
 振动能量采集系统市场-全球产业规模、份额、趋势、机会及预测(依产品、应用、区域及竞争格局划分,2021-2031年)
 微型太阳能发电市场规模、份额及成长分析(按应用和地区划分)-2026-2033年产业预测
 能源采集市场规模、份额和成长分析(按技术、组件、应用、最终用户和地区划分)-2026-2033年产业预测
 能源采集系统市场规模、份额及成长分析(依技术、组件、最终用途、应用及地区划分)-2026-2033年产业预测
 飞轮市场规模、份额和成长分析(按类型、产品类型和地区划分)-2026-2033年产业预测
 能源采集系统市场规模、份额和趋势分析报告:按技术、振动技术、应用、组件、地区和细分市场预测(2026-2033 年)
 能源采集设备市场-2025-2030年预测
 能源采集设备市场预测至2032年:按产品类型、功率输出、能源来源、技术、应用、最终用户和地区分類的全球分析