


 |
市场调查报告书
商品编码
1892654
购电协议(PPA)平台市场机会、成长驱动因素、产业趋势分析及预测(2026-2035年)Power Purchase Agreement (PPA) Platform Market Opportunity, Growth Drivers, Industry Trend Analysis, and Forecast 2026 - 2035 |
||||||
2025 年全球购电协议平台市场价值为 24 亿美元,预计到 2035 年将以 14.6% 的复合年增长率增长至 95 亿美元。
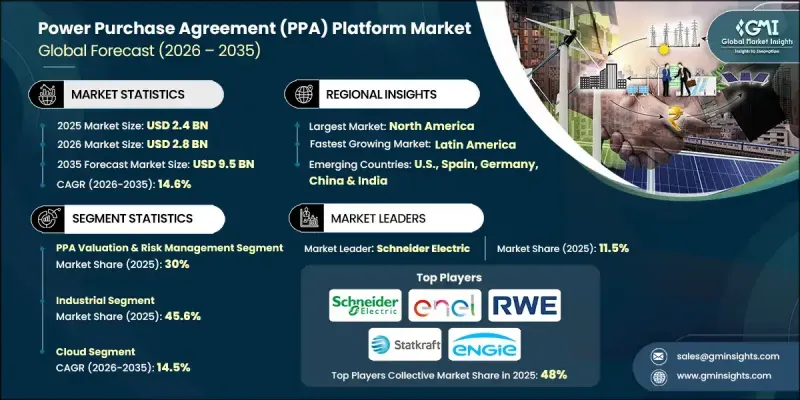
再生能源采购流程日益数位化和透明化是推动市场发展的驱动力。各机构正利用购电协议(PPA)平台评估价格、比较再生能源、管理谈判流程并监控长期合约的履行情况。数位化平台能够提高效率、减少交易摩擦,并支援各地区企业和公用事业的脱碳计画。购电协议平臺本质上是一个软体驱动的市场,连接再生能源开发商与企业、工业和公用事业买家。这些平台透过提供定价工具、风险评估、合约标准化和专案评估功能来简化采购流程。透过改善买卖双方的匹配,这些平台能够提高专案的融资可行性、优化定价策略、评估买家的信用度并追踪交易阶段,从而建立一个更有效率的再生能源生态系统。
| 市场范围 | |
|---|---|
| 起始年份 | 2025 |
| 预测年份 | 2026-2035 |
| 起始值 | 24亿美元 |
| 预测值 | 95亿美元 |
| 复合年增长率 | 14.6% |
预计到2025年,购电协议(PPA)估值和风险管理细分市场将占据30%的市场份额,并预计在2035年之前以13.5%的复合年增长率成长。该细分市场专注于评估与长期再生能源合约相关的财务、营运和监管风险。此类平台提供先进的预测、建模和分析功能,用于评估信用风险、价格波动、专案可行性和整体合约绩效。
预计到2025年,公用事业板块的估值将达到7.102亿美元。公用事业公司正越来越多地采用购电协议(PPA)平台,以满足监管要求和永续发展目标,同时简化交易流程并确保获得经济高效的再生能源。不断增长的企业能源需求、电网脱碳政策以及再生能源强制规定正在推动该行业对购电协议的更高采用率。
预计到2025年,美国购电协议平台市场将占据74%的市场份额,创造7.342亿美元的收入。随着企业、公用事业公司和大型能源用户为实现永续发展目标和脱碳承诺而增加再生能源采购,预计该市场成长速度将加快。
目录
第一章:方法论与范围
第二章:执行概要
第三章:行业洞察
- 产业生态系分析
- 原物料供应及采购分析
- 製造能力评估
- 供应链韧性与风险因素
- 配电网路分析
- 监管环境
- 产业影响因素
- 成长驱动因素
- 产业陷阱与挑战
- 成长潜力分析
- 波特的分析
- PESTEL 分析
- 购电协议(PPA)平台成本结构分析
- 新兴机会与趋势
- 投资展望与数位转型
- 永续发展与工业4.0融合
第四章:竞争格局
- 介绍
- 按地区分類的公司市占率分析
- 北美洲
- 欧洲
- 亚太地区
- 中东和非洲
- 拉丁美洲
- 战略仪錶板
- 策略倡议
- 重要伙伴关係与合作
- 主要併购活动
- 产品创新与发布
- 市场扩张策略
- 竞争性标竿分析
- 创新与永续发展格局
第五章:市场规模及预测:依解决方案划分,2022-2035年
- 购电协议估值与风险管理
- 合约与投资组合管理
- 市场/招标平台
- 分散式能源/微电网购电协议平台
第六章:市场规模及预测:依部署方式划分,2022-2035年
- 云
- 现场
第七章:市场规模及预测:依最终用途划分,2022-2035年
- 工业的
- 能源开发商
- 公用事业
- 金融机构
第八章:市场规模及预测:依应用领域划分,2022-2035年
- 再生能源采购
- 金融风险与估值
- 投资组合优化与报告
第九章:市场规模及预测:依地区划分,2022-2035年
- 北美洲
- 我们
- 加拿大
- 墨西哥
- 欧洲
- 西班牙
- 德国
- 英国
- 法国
- 义大利
- 波兰
- 荷兰
- 瑞典
- 亚太地区
- 中国
- 澳洲
- 印度
- 日本
- 韩国
- 新加坡
- 印尼
- 菲律宾
- 中东和非洲
- 沙乌地阿拉伯
- 阿联酋
- 南非
- 埃及
- 阿曼
- 摩洛哥
- 拉丁美洲
- 巴西
- 智利
- 阿根廷
- 哥伦比亚
第十章:公司简介
- Anthesis
- Astatine Ltd.
- Aurora Energy Research
- CFP FlexPower GmbH
- cQuant.io
- Ecohz
- Enel Spa
- ENGIE
- FlexiDAO
- Kebola
- KYOS
- LevelTen Energy
- Next Kraftwerke
- Noble Green Energy
- Path Energy
- Pexapark
- Power Ledger
- REsurety
- RWE
- Schneider Electric
- Statkraft
- Synergy Solar Solutions
- Veyt
- Zeigo
The Global Power Purchase Agreement Platform Market was valued at USD 2.4 billion in 2025 and is estimated to grow at a CAGR of 14.6% to reach USD 9.5 billion by 2035.
The market is driven by the increasing digitalization and transparency of renewable energy procurement processes. Organizations are leveraging PPA platforms to assess pricing, compare renewable energy sources, manage negotiation workflows, and monitor long-term contract performance. Digital platforms enhance efficiency, minimize transaction friction, and support corporate and utility decarbonization initiatives across regions. A PPA platform is essentially a software-enabled marketplace that connects renewable energy developers with corporate, industrial, and utility buyers. These platforms streamline procurement by offering pricing tools, risk assessment, contract standardization, and project evaluation capabilities. By improving buyer-seller matchmaking, these platforms boost project bankability, optimize pricing strategies, evaluate buyer creditworthiness, and track deal stages, creating a more efficient renewable energy ecosystem.
| Market Scope | |
|---|---|
| Start Year | 2025 |
| Forecast Year | 2026-2035 |
| Start Value | $2.4 Billion |
| Forecast Value | $9.5 Billion |
| CAGR | 14.6% |
The PPA valuation and risk management segment held a 30% share in 2025 and is expected to grow at a CAGR of 13.5% through 2035. This segment focuses on evaluating the financial, operational, and regulatory risks associated with long-term renewable energy contracts. Platforms in this category offer advanced forecasting, modeling, and analytics to assess credit risk, price volatility, project viability, and overall contract performance.
The utility segment was valued at USD 710.2 million in 2025. Utilities are increasingly adopting PPA platforms to meet regulatory requirements and sustainability goals while simplifying transaction processes and securing cost-effective renewable energy. Rising corporate energy demand, grid decarbonization policies, and renewable energy mandates are driving higher adoption across this sector.
U.S. Power Purchase Agreement Platform Market held 74% share in 2025, generating USD 734.2 million. Growth is expected to accelerate as corporations, utilities, and large-scale energy consumers increase renewable energy procurement to achieve sustainability targets and decarbonization commitments.
Major players in the Power Purchase Agreement Platform Market include Anthesis, Astatine, Aurora Energy Research, CFP FlexPower, cQuant.io, Ecohz, Enel Spa, ENGIE, FlexiDAO, Kebola, KYOS, LevelTen Energy, Next Kraftwerke, Noble Green Energy, Path Energy, Pexapark, Power Ledger, REsurety, RWE, Schneider Electric, Statkraft, Synergy Solar Solutions, Veyt, and Zeigo. Companies in the Power Purchase Agreement (PPA) Platform Market are implementing several strategies to strengthen their market presence. They are investing in advanced analytics and AI-powered platforms to enhance pricing accuracy, contract management, and risk assessment. Partnerships with renewable developers, utilities, and corporate buyers allow broader market access and faster deal closure. Companies are also expanding geographically to capture emerging renewable markets and provide localized support. Integration with IoT and blockchain solutions enhances transparency, operational efficiency, and trust in long-term contracts.
Table of Contents
Chapter 1 Methodology & Scope
- 1.1 Research design
- 1.1.1 Research approach
- 1.1.2 Data collection methods
- 1.2 Base estimates and calculations
- 1.2.1 Base year calculation
- 1.2.2 Market estimates & forecast parameters
- 1.3 Forecast
- 1.3.1 Key trends for market estimates
- 1.3.2 Quantified market impact analysis
- 1.3.2.1 Mathematical impact of growth parameters on forecast
- 1.3.3 Scenario analysis framework
- 1.4 Primary research and validation
- 1.4.1 Some of the primary sources (but not limited to)
- 1.5 Data mining sources
- 1.5.1 Paid Sources
- 1.5.2 Sources, by region
- 1.6 Research trail & scoring components
- 1.6.1 Research trail components
- 1.6.2 Scoring components
- 1.7 Research transparency addendum
- 1.7.1 Source attribution framework
- 1.7.2 Quality assurance metrics
- 1.7.3 Our commitment to trust
- 1.8 Market definitions
Chapter 2 Executive Summary
- 2.1 Industry synopsis, 2022 - 2035
- 2.1.1 Business trends
- 2.1.2 Solution trends
- 2.1.3 Deployment trends
- 2.1.4 End use trends
- 2.1.5 Application trends
- 2.1.6 Regional trends
Chapter 3 Industry Insights
- 3.1 Industry ecosystem analysis
- 3.1.1 Raw material availability & sourcing analysis
- 3.1.2 Manufacturing capacity assessment
- 3.1.3 Supply chain resilience & risk factors
- 3.1.4 Distribution network analysis
- 3.2 Regulatory landscape
- 3.3 Industry impact forces
- 3.3.1 Growth drivers
- 3.3.2 Industry pitfalls & challenges
- 3.4 Growth potential analysis
- 3.5 Porter's analysis
- 3.5.1 Bargaining power of suppliers
- 3.5.2 Bargaining power of buyers
- 3.5.3 Threat of new entrants
- 3.5.4 Threat of substitutes
- 3.6 PESTEL analysis
- 3.6.1 Political factors
- 3.6.2 Economic factors
- 3.6.3 Social factors
- 3.6.4 Technological factors
- 3.6.5 Legal factors
- 3.6.6 Environmental factors
- 3.7 Cost structure analysis of power purchase agreement (PPA) platform
- 3.8 Emerging opportunities & trends
- 3.9 Investment outlook & digital transformation
- 3.10 Sustainability & industry 4.0 integration
Chapter 4 Competitive Landscape, 2025
- 4.1 Introduction
- 4.2 Company market share analysis, by region, 2025
- 4.2.1 North America
- 4.2.2 Europe
- 4.2.3 Asia Pacific
- 4.2.4 Middle East & Africa
- 4.2.5 Latin America
- 4.3 Strategic dashboard
- 4.4 Strategic initiatives
- 4.4.1 Key partnerships & collaborations
- 4.4.2 Major M&A activities
- 4.4.3 Product innovations & launches
- 4.4.4 Market expansion strategies
- 4.5 Competitive benchmarking
- 4.6 Innovation & sustainability landscape
Chapter 5 Market Size and Forecast, By Solution, 2022 - 2035 (USD Million)
- 5.1 Key trends
- 5.2 PPA valuation & risk management
- 5.3 Contract & portfolio management
- 5.4 Marketplace/ tendering platforms
- 5.5 Distributed energy/ microgrid PPA platforms
Chapter 6 Market Size and Forecast, By Deployment, 2022 - 2035 (USD Million)
- 6.1 Key trends
- 6.2 Cloud
- 6.3 On-premises
Chapter 7 Market Size and Forecast, By End Use, 2022 - 2035 (USD Million)
- 7.1 Key trends
- 7.2 Industrial
- 7.3 Energy developers
- 7.4 Utility
- 7.5 Financial institutions
Chapter 8 Market Size and Forecast, By Application, 2022 - 2035 (USD Million)
- 8.1 Key trends
- 8.2 Renewable energy procurement
- 8.3 Financial risk & valuation
- 8.4 Portfolio optimization & reporting
Chapter 9 Market Size and Forecast, By Region, 2022 - 2035 (USD Million)
- 9.1 Key trends
- 9.2 North America
- 9.2.1 U.S.
- 9.2.2 Canada
- 9.2.3 Mexico
- 9.3 Europe
- 9.3.1 Spain
- 9.3.2 Germany
- 9.3.3 UK
- 9.3.4 France
- 9.3.5 Italy
- 9.3.6 Poland
- 9.3.7 Netherlands
- 9.3.8 Sweden
- 9.4 Asia Pacific
- 9.4.1 China
- 9.4.2 Australia
- 9.4.3 India
- 9.4.4 Japan
- 9.4.5 South Korea
- 9.4.6 Singapore
- 9.4.7 Indonesia
- 9.4.8 Philippines
- 9.5 Middle East & Africa
- 9.5.1 Saudi Arabia
- 9.5.2 UAE
- 9.5.3 South Africa
- 9.5.4 Egypt
- 9.5.5 Oman
- 9.5.6 Morocco
- 9.6 Latin America
- 9.6.1 Brazil
- 9.6.2 Chile
- 9.6.3 Argentina
- 9.6.4 Colombia
Chapter 10 Company Profiles
- 10.1 Anthesis
- 10.2 Astatine Ltd.
- 10.3 Aurora Energy Research
- 10.4 CFP FlexPower GmbH
- 10.5 cQuant.io
- 10.6 Ecohz
- 10.7 Enel Spa
- 10.8 ENGIE
- 10.9 FlexiDAO
- 10.10 Kebola
- 10.11 KYOS
- 10.12 LevelTen Energy
- 10.13 Next Kraftwerke
- 10.14 Noble Green Energy
- 10.15 Path Energy
- 10.16 Pexapark
- 10.17 Power Ledger
- 10.18 REsurety
- 10.19 RWE
- 10.20 Schneider Electric
- 10.21 Statkraft
- 10.22 Synergy Solar Solutions
- 10.23 Veyt
- 10.24 Zeigo
 2026年全球太阳能人工智慧市场报告2026年全球可再生能源购电合约市场报告
 西班牙电力:市场份额分析、行业趋势和统计数据、成长预测(2026-2031 年)2026年全球能源电力人工智慧(AI)市场报告
 80 PLUS 白金电源市场按功率范围、模组化设计、外形规格、散热方式、价格范围、最终用户和分销渠道划分 - 全球预测(2026-2032 年)日本电力:市场占有率分析、产业趋势与统计、成长预测(2026-2031)电力:市场占有率分析、产业趋势与统计、成长预测(2026-2031)马来西亚电力市场-份额分析、产业趋势与统计、成长预测(2026-2031)
 电力交易市场-全球产业规模、份额、趋势、机会和预测,按类型(日前交易、日内交易)、应用(工业、商业、住宅)、地区和竞争格局划分,2021-2031年预测
 印度电力与再生能源最新动态:2025年第三季度