


 |
市场调查报告书
商品编码
1913361
7级卡车市场机会、成长要素、产业趋势分析及2026年至2035年预测Class 7 Trucks Market Opportunity, Growth Drivers, Industry Trend Analysis, and Forecast 2026 - 2035 |
||||||
全球 7 级卡车市场预计到 2025 年将价值 653 亿美元,到 2035 年达到 1,069 亿美元,年复合成长率为 5.2%。
7级卡车,总重介于26,001至33,000磅(约11,800至15,000公斤)之间,不再被视为基础作业车辆,而是日益被视为优化的车队投资。这些卡车服务都市区货运、区域配送、建筑施工、市政服务和公共产业运营。全球车队所有者正在整合数位监控工具、安全技术和替代动力系统,以提高资产利用率、营运效率和生命週期规划。监管压力和不断演变的物流模式正在加速车辆更新换代,并影响车队的长期策略。排放气体标准、公私合营以及永续性指令正在重塑采购行为和基础设施规划,而新兴市场则透过分阶段的监管实施来实现车队现代化。随着互联车队生态系统的日益成熟,营运视觉性和数据驱动的部署正成为7级卡车在全球市场中提升性能和盈利的核心要素。
| 市场覆盖范围 | |
|---|---|
| 开始年份 | 2025 |
| 预测年份 | 2026-2035 |
| 起始值 | 653亿美元 |
| 预测金额 | 1069亿美元 |
| 复合年增长率 | 5.2% |
各国政府的政策和环境法规正深刻影响全球各地对7级卡车的需求。排放气体法律规范和清洁车队计画正在加速现有车辆的更新换代,而开发中国家不断完善的标准则推动车队的逐步现代化。这些政策正在影响动力传动系统选择、资本规划和长期营运投资,而连网车队技术则在迅速提升生产效率和成本控制。
预计到2025年,柴油动力系统总成市占率将达到80.81%,并在2035年之前以4.6%的复合年增长率成长。柴油引擎凭藉其强劲的扭力输出、燃油效率高、经久耐用以及在中型运输领域良好的营运经济性,仍然是首选。燃料的广泛供应也进一步推动了柴油引擎在成熟市场和发展中市场的持续普及。
预计到 2025 年,货运配送领域将占 35% 的市场份额,从 2026 年到 2035 年,复合年增长率将达到 5.3%。 7 级卡车在有效负载容量、机动性和效率方面实现了有效平衡,使其非常适合中距离货运和由不断扩大的商业活动驱动的高频配送作业。
预计到 2025 年,亚太地区 7 级卡车市场将占全球市场份额的 65.5%,市场规模将达到 253.8 亿美元。持续的基础设施投资、不断扩大的物流网络以及对商用车更新换代的政策支持推动了市场成长,刺激了建筑支援、市政车队和区域货运的需求。
目录
第一章调查方法
第二章执行摘要
第三章业界考察
- 生态系分析
- 供应商情况
- 利润率分析
- 成本结构
- 每个阶段的附加价值
- 影响价值链的因素
- 中断
- 产业影响因素
- 司机
- 全球对电动和混合动力7级卡车的需求正在成长
- 北美货运活动不断扩大
- 欧洲实施更严格的排放法规
- 亚太地区基础建设活动投资增加
- 中东和非洲的采矿、石油和天然气产业对7级卡车的需求不断增长
- 产业潜在风险与挑战
- 高昂的初始成本和维修成本
- 卡车驾驶人短缺
- 市场机会
- 市政和城市物流车辆的电气化
- 新兴经济体基础设施和建设活动的扩张
- 灵活所有权、租赁和卡车即服务 (TaaS) 模式的成长
- 整合先进的远端资讯处理和车队分析解决方案
- 司机
- 成长潜力分析
- 监管环境
- 北美洲
- NEVI/IIJA,先进清洁卡车 (ACT) 法规
- 欧洲
- 德国:《电动车法案》(EmoG)
- 英国:清洁车辆改装认证计画 (CVRAS)、超低排放气体区 (ULEZ)
- 法国:流动性导向法(LOM 法)
- 义大利:国家综合能源与气候计画(PNIEC)
- 亚太地区
- 中国:新能源汽车(NEV)强制政策
- 印度:FAME II计划
- 日本:电动车与燃料电池车引进战略蓝图
- 澳洲:各州零排放车辆强制令
- 拉丁美洲
- 巴西:国家电动车政策(PNME)
- 墨西哥:都市区零排放车辆计划
- 阿根廷:各州电动车奖励政策(布宜诺斯艾利斯省)
- 中东和非洲
- 阿联酋:电动车充电基础设施法规(ADDM/DEWA)
- 沙乌地阿拉伯:电动车推广法规结构(SASO)
- 南非:绿色交通战略
- 北美洲
- 波特五力分析
- PESTEL 分析
- 科技与创新趋势
- 当前技术趋势
- 新兴技术
- 专利分析
- 定价分析
- 按地区
- 按燃料
- 生产统计
- 生产基地
- 消费基础
- 出口和进口
- 成本細項分析
- 永续性和环境影响分析
- 永续实践
- 减少废弃物策略
- 生产中的能源效率
- 环保倡议
- 碳足迹考量
- 未来前景与机会
- 车队采购与采购行为分析
- 7级卡车购买决策标准
- OEM选择与品牌偏好因素
- 燃料、负载容量和运作时间如何影响购买决策
- 二手7级卡车市场的残值与市场动态
- 融资、租赁和卡车即服务 (TaaS) 的经济学
- 售后市场、服务与零件经济学
- 动力传动系统转型与燃料转型路径
第四章 竞争情势
- 介绍
- 公司市占率分析
- 主要市场公司的竞争分析
- 竞争定位矩阵
- 战略展望矩阵
- 重大进展
- 併购
- 伙伴关係与合作
- 新产品发布
- 企业扩张计画和资金筹措
第五章 依燃料类型分類的市场估算与预测,2022-2035年
- 柴油引擎
- 天然气
- 油电混合车
- 其他的
第六章 按应用领域分類的市场估算与预测,2022-2035年
- 货运
- 公共产业服务
- 建筑和采矿
- 其他的
7. 按车轴分類的市场估算与预测,2022-2035 年
- 4x2
- 6x4
- 6x2
第八章 按马力分類的市场估算与预测,2022-2035年
- 不到300马力
- 300马力至400马力
- 400马力至500马力
- 超过500马力
9. 按所有权类型分類的市场估算与预测,2022-2035 年
- 车队营运商
- 独立企业
第十章 依输电方式分類的市场估计与预测,2022-2035年
- 手排变速箱
- 自动变速箱
第十一章 2022-2035年各地区市场估计与预测
- 北美洲
- 美国
- 加拿大
- 欧洲
- 德国
- 英国
- 法国
- 义大利
- 西班牙
- 俄罗斯
- 北欧国家
- 亚太地区
- 中国
- 印度
- 日本
- 澳洲
- 韩国
- 菲律宾
- 印尼
- 拉丁美洲
- 巴西
- 墨西哥
- 阿根廷
- 中东和非洲
- 南非
- 沙乌地阿拉伯
- 阿拉伯聯合大公国
第十二章:公司简介
- 世界玩家
- Daimler Truck
- Ford Motor Company
- Hino Motors
- Isuzu Motors
- Navistar
- Scania
- TRATON
- Volvo Trucks
- 本地製造商
- Ashok Leyland
- BYD
- Eicher Motor
- GMC
- Hyundai
- JAC Motors
- Kenworth
- Kia
- Mack Trucks
- Mahindra &Mahindra
- Mitsubishi Fuso Truck and Bus Corporation
- Peterbilt
- SML Isuzu
- Tata Motors
- 新兴製造商
- Dongfeng Motor
- Rivian Automotive
- SAIC Maxus
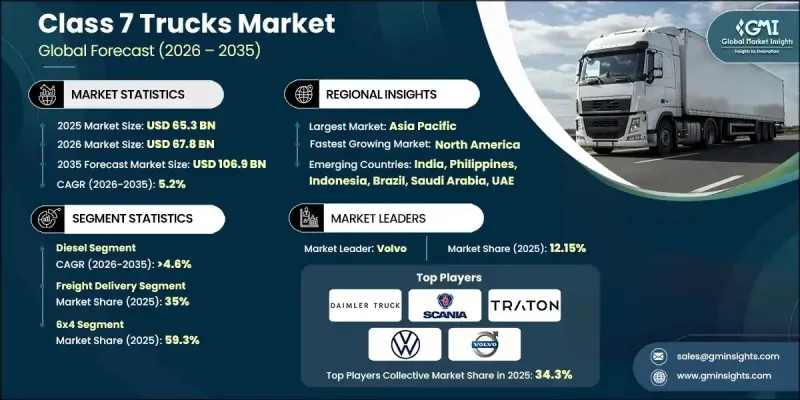
The Global Class 7 Truck Market was valued at USD 65.3 billion in 2025 and is estimated to grow at a CAGR of 5.2% to reach USD 106.9 billion by 2035.
Class 7 trucks, defined by a GVWR range of 26,001-33,000 lbs, are no longer viewed as basic work vehicles but are increasingly treated as optimized fleet investments. These trucks support urban freight movement, regional distribution, construction assistance, municipal duties, and utility operations. Fleet owners worldwide integrate digital monitoring tools, safety technologies, and alternative propulsion systems to improve asset utilization, operational efficiency, and lifecycle planning. Regulatory pressure and evolving logistics models are accelerating replacement cycles and influencing long-term fleet strategies. Emission standards, public-private coordination, and sustainability mandates are reshaping purchasing behavior and infrastructure planning, while emerging markets continue to modernize fleets through phased regulatory adoption. As connected fleet ecosystems mature, operational visibility and data-driven deployment are becoming central to Class 7 truck performance and profitability across global markets.
| Market Scope | |
|---|---|
| Start Year | 2025 |
| Forecast Year | 2026-2035 |
| Start Value | $65.3 Billion |
| Forecast Value | $106.9 Billion |
| CAGR | 5.2% |
Government policy and environmental regulation strongly influence Class 7 truck demand across global regions. Emission compliance frameworks and clean-fleet initiatives are driving faster turnover of existing vehicles, while evolving standards in developing economies are encouraging gradual fleet modernization. These policies shape powertrain selection, capital planning, and long-term operational investments, while connected fleet technologies are rapidly improving productivity and cost control.
The diesel powertrains segment held 80.81% share in 2025 and is forecast to grow at a CAGR of 4.6% through 2035. Diesel engines remain the preferred choice due to their strong torque delivery, fuel efficiency, durability, and favorable operating economics for medium-duty hauling. Widespread fuel availability further supports continued adoption across both mature and developing markets.
The freight delivery segment held 35% share in 2025 and is projected to grow at a CAGR of 5.3% from 2026 to 2035. Class 7 trucks offer an effective balance of payload capacity, maneuverability, and efficiency, making them suitable for medium-distance goods movement and high-frequency delivery operations driven by expanding commerce activity.
Asia Pacific Class 7 Truck Market held 65.5% share, generating USD 25.38 billion in 2025. Growth is supported by sustained infrastructure investment, expanding logistics networks, and policy-backed commercial vehicle upgrades that stimulate demand across construction support, municipal fleets, and regional freight transport.
Key participants active in the Global Class 7 truck market include Volvo, PACCAR, Daimler Trucks, Isuzu Motors, Traton, Ford, Volkswagen, SCANIA, Peterbilt, and Kenworth. To strengthen their positioning, Class 7 truck manufacturers focus on product portfolio diversification, technology integration, and strategic partnerships. Companies invest heavily in powertrain innovation, connected vehicle platforms, and advanced safety systems to align with regulatory and fleet efficiency expectations. Localization of production and supplier networks helps reduce costs and improve regional responsiveness. Manufacturers also expand aftermarket services, financing solutions, and fleet management support to build long-term customer relationships. Strategic collaborations with technology providers accelerate digital adoption, while continuous platform upgrades allow brands to address evolving logistics and infrastructure demands without sacrificing reliability or total cost of ownership.
Table of Contents
Chapter 1 Methodology
- 1.1 Research approach
- 1.2 Quality commitments
- 1.2.1 GMI AI policy & data integrity commitment
- 1.3 Research trail & confidence scoring
- 1.3.1 Research trail components
- 1.3.2 Scoring components
- 1.4 Data collection
- 1.4.1 Partial list of primary sources
- 1.5 Data mining sources
- 1.5.1 Paid sources
- 1.6 Base estimates and calculations
- 1.6.1 Base year calculation
- 1.7 Forecast model
- 1.8 Research transparency addendum
Chapter 2 Executive Summary
- 2.1 Industry 360° synopsis, 2022 - 2035
- 2.2 Key market trends
- 2.2.1 Regional
- 2.2.2 Fuel
- 2.2.3 Application
- 2.2.4 Axle
- 2.2.5 Horsepower
- 2.2.6 Ownership
- 2.2.7 Transmission
- 2.3 TAM Analysis, 2026-2035
- 2.4 CXO perspectives: Strategic imperatives
- 2.4.1 Executive decision points
- 2.4.2 Critical success factors
- 2.5 Future outlook and strategic recommendations
Chapter 3 Industry Insights
- 3.1 Industry ecosystem analysis
- 3.1.1 Supplier landscape
- 3.1.2 Profit margin analysis
- 3.1.3 Cost structure
- 3.1.4 Value addition at each stage
- 3.1.5 Factor affecting the value chain
- 3.1.6 Disruptions
- 3.2 Industry impact forces
- 3.2.1 Growth drivers
- 3.2.1.1 Increasing demand for electric & hybrid class 7 trucks across the globe
- 3.2.1.2 Growing freight transportation activities across North America
- 3.2.1.3 Implementation of stringent emission regulations in Europe
- 3.2.1.4 Rising investments in infrastructure development activities in Asia Pacific
- 3.2.1.5 Growing demand for class 7 from mining and oil & gas sector in MEA
- 3.2.2 Industry pitfalls and challenges
- 3.2.2.1 High initial and maintenance costs
- 3.2.2.2 Shortage of truck drivers
- 3.2.3 Market opportunities
- 3.2.3.1 Electrification of municipal and urban logistics fleets
- 3.2.3.2 Expansion of infrastructure and construction activities in emerging economies
- 3.2.3.3 Growth of flexible ownership, leasing, and Truck-as-a-Service (TaaS) models
- 3.2.3.4 Integration of advanced telematics and fleet analytics solutions
- 3.2.1 Growth drivers
- 3.3 Growth potential analysis
- 3.4 Regulatory landscape
- 3.4.1 North America
- 3.4.1.1 NEVI / IIJA, Advanced Clean Trucks (ACT) Regulation.
- 3.4.2 Europe
- 3.4.2.1 Germany: Electric Mobility Act (EmoG)
- 3.4.2.2 UK: Clean Vehicle Retrofit Accreditation Scheme (CVRAS), Ultra-Low Emission Zone (ULEZ)
- 3.4.2.3 France: Mobility Orientation Law (LOM Act)
- 3.4.2.4 Italy: National Integrated Plan for Energy and Climate (PNIEC)
- 3.4.3 Asia Pacific
- 3.4.3.1 China: New Energy Vehicle (NEV) Mandate
- 3.4.3.2 India: FAME II Scheme
- 3.4.3.3 Japan: Strategic Roadmap for EV/FCV Deployment
- 3.4.3.4 Australia: State-Level Zero-Emission Vehicle Mandates
- 3.4.4 Latin America
- 3.4.4.1 Brazil: National Electric Mobility Policy (PNME)
- 3.4.4.2 Mexico: Urban Zero-Emission Fleet Programs
- 3.4.4.3 Argentina: Provincial EV Incentive Regulations (Buenos Aires)
- 3.4.5 MEA
- 3.4.5.1 UAE: EV Charging Infrastructure Regulation (ADDM/DEWA)
- 3.4.5.2 Saudi Arabia: EV Deployment Regulatory Framework (SASO)
- 3.4.5.3 South Africa: Green Transport Strategy
- 3.4.1 North America
- 3.5 Porter's analysis
- 3.6 PESTEL analysis
- 3.7 Technology and Innovation landscape
- 3.7.1 Current technological trends
- 3.7.2 Emerging technologies
- 3.8 Patent analysis
- 3.9 Pricing Analysis
- 3.9.1 By region
- 3.9.2 By fuel
- 3.10 Production statistics
- 3.10.1 Production hubs
- 3.10.2 Consumption hubs
- 3.10.3 Export and import
- 3.11 Cost breakdown analysis
- 3.12 Sustainability and environmental impact analysis
- 3.12.1 Sustainable practices
- 3.12.2 Waste reduction strategies
- 3.12.3 Energy efficiency in production
- 3.12.4 Eco-friendly initiatives
- 3.12.5 Carbon footprint considerations
- 3.13 Future outlook & opportunities
- 3.14 Fleet procurement & buying behavior analysis
- 3.14.1 Purchase decision criteria for Class 7 trucks
- 3.14.2 OEM selection and brand preference factors
- 3.14.3 Impact of fuel, payload, and uptime on buying decisions
- 3.15 Residual value & used Class 7 truck market dynamics
- 3.16 Financing, leasing & Truck-as-a-Service (TaaS) economics
- 3.17 Aftermarket, service & parts economics
- 3.18 Powertrain transition & fuel migration pathways
Chapter 4 Competitive Landscape, 2025
- 4.1 Introduction
- 4.2 Company market share analysis
- 4.2.1 North America
- 4.2.2 Europe
- 4.2.3 Asia Pacific
- 4.2.4 Latin America
- 4.2.5 MEA
- 4.3 Competitive analysis of major market players
- 4.4 Competitive positioning matrix
- 4.5 Strategic outlook matrix
- 4.6 Key developments
- 4.6.1 Mergers & acquisitions
- 4.6.2 Partnerships & collaborations
- 4.6.3 New Product Launches
- 4.6.4 Expansion Plans and funding
Chapter 5 Market Estimates & Forecast, By Fuel, 2022 - 2035 ($Bn, Units)
- 5.1 Key trends
- 5.2 Diesel
- 5.3 Natural gas
- 5.4 Hybrid electric
- 5.5 Others
Chapter 6 Market Estimates & Forecast, By Application, 2022 - 2035 ($Bn, Units)
- 6.1 Key trends
- 6.2 Freight delivery
- 6.3 Utility services
- 6.4 Construction & mining
- 6.5 Others
Chapter 7 Market Estimates & Forecast, By Axle, 2022 - 2035 ($Bn, Units)
- 7.1 Key trends
- 7.2 4x2
- 7.3 6x4
- 7.4 6x2
Chapter 8 Market Estimates & Forecast, By Horsepower, 2022 - 2035 ($Bn, Units)
- 8.1 Key trends
- 8.2 Below 300HP
- 8.3 300HP - 400HP
- 8.4 400HP - 500HP
- 8.5 500HP & Above
Chapter 9 Market Estimates & Forecast, By Ownership, 2022 - 2035 ($Bn, Units)
- 9.1 Key trends
- 9.2 Fleet operator
- 9.3 Independent operator
Chapter 10 Market Estimates & Forecast, By Transmission, 2022 - 2035 ($Bn, Units)
- 10.1 Key trends
- 10.2 Manual transmission
- 10.3 Automatic transmission
Chapter 11 Market Estimates & Forecast, By Region, 2022 - 2035 ($Bn, Units)
- 11.1 Key trends
- 11.2 North America
- 11.2.1 US
- 11.2.2 Canada
- 11.3 Europe
- 11.3.1 Germany
- 11.3.2 UK
- 11.3.3 France
- 11.3.4 Italy
- 11.3.5 Spain
- 11.3.6 Russia
- 11.3.7 Nordics
- 11.4 Asia Pacific
- 11.4.1 China
- 11.4.2 India
- 11.4.3 Japan
- 11.4.4 Australia
- 11.4.5 South Korea
- 11.4.6 Philippines
- 11.4.7 Indonesia
- 11.5 Latin America
- 11.5.1 Brazil
- 11.5.2 Mexico
- 11.5.3 Argentina
- 11.6 MEA
- 11.6.1 South Africa
- 11.6.2 Saudi Arabia
- 11.6.3 UAE
Chapter 12 Company Profiles
- 12.1 Global Players
- 12.1.1 Daimler Truck
- 12.1.2 Ford Motor Company
- 12.1.3 Hino Motors
- 12.1.4 Isuzu Motors
- 12.1.5 Navistar
- 12.1.6 Scania
- 12.1.7 TRATON
- 12.1.8 Volvo Trucks
- 12.2 Regional Players
- 12.2.1 Ashok Leyland
- 12.2.2 BYD
- 12.2.3 Eicher Motor
- 12.2.4 GMC
- 12.2.5 Hyundai
- 12.2.6 JAC Motors
- 12.2.7 Kenworth
- 12.2.8 Kia
- 12.2.9 Mack Trucks
- 12.2.10 Mahindra & Mahindra
- 12.2.11 Mitsubishi Fuso Truck and Bus Corporation
- 12.2.12 Peterbilt
- 12.2.13 SML Isuzu
- 12.2.14 Tata Motors
- 12.3 Emerging Players
- 12.3.1 Dongfeng Motor
- 12.3.2 Rivian Automotive
- 12.3.3 SAIC Maxus
 8级卡车市场:按卡车类型、推进系统、变速箱、引擎功率和最终用途划分-2026-2032年全球预测
 全球7级卡车市场规模、份额、趋势和成长分析报告(2026-2034年)全球8级卡车市场规模、份额、趋势和成长分析报告(2026-2034年)
 中重型商用车排气系统市场-全球产业规模、份额、趋势、机会及预测(依燃料类型、后处理类型、零件类型、地区及竞争格局划分,2021-2031年)中重型商用车泵市场-全球产业规模、份额、趋势、机会和预测:按泵类型、技术类型、销售管道、地区和竞争格局划分,2021-2031年轻型商用车泵市场 - 全球产业规模、份额、趋势、机会及预测(按泵浦类型、技术类型、销售管道、地区和竞争格局划分,2021-2031年)
 8级卡车市场成长机会、成长要素、产业趋势分析及2026年至2035年预测日本轻型商用车与中重型卡车市场展望(2025 年)全球中重型商用车售后市场策略分析(2025)
 7 级卡车市场(按推进方式和地区划分)